What the PRC’s Economic Slowdown Means for Key Countries: Case Studies
Ana Horigoshi, Jonathan Solis, Rodney Knight, and Bryan Burgess
ANA HORIGOSHI is a Research Scientist in the Policy Analysis Unit at AidData. She can be reached at <ahorigoshi@aiddata.org>.
JONATHAN SOLIS is a Research Scientist in the Policy Analysis Unit at AidData. He can be reached at <jsolis@aiddata.org>.
RODNEY KNIGHT is a Senior Research Scientist in the Policy Analysis Unit at AidData. He can be reached at <rodneyknight@aiddata.org>.
BRYAN BURGESS is a Senior Policy Specialist in the Policy Analysis Unit at AidData. He can be reached at < bvburgess@aiddata.org>.
This chapter presents five case studies analyzing the implications of a slowdown in the domestic economy of the People’s Republic of China (PRC) for a diverse set of countries: Brazil, Germany, Indonesia, Nigeria, and Paraguay. These countries were selected to cover a range of geographic regions, levels of economic development, and engagement with the PRC. By investigating these representative cases, this chapter highlights the different channels through which the effects of a Chinese economic slowdown would unfold globally.

Each case evaluates the patterns of economic interdependence with the PRC, assesses the vulnerabilities resulting from reduced Chinese demand and investments, and considers policy options for governments to navigate the slowdown. Collectively, the case studies provide a framework for understanding the global ramifications of a Chinese economic slowdown and offer policymakers guidance to mitigate risks and leverage new opportunities.
Brazil
Brazil occupies a complex position in the global landscape. As Latin America’s largest country by population and GDP, it wields significant regional influence. Yet, it also faces external dependencies. Through its membership in the BRICS grouping, Brazil has strengthened ties with the PRC, envisioning a future aligned with countries outside the G-7 and challenging the dominance of the U.S. dollar.[1] Recent additions to the coalition, such as Iran, further signal an alignment among countries seeking to counter Western dominance. This reinforces Brazil’s pivot toward multipolarity. The Brazilian economy supports a population of 211 million, with a GDP per capita of $9,258 in 2023 (in constant 2015 U.S. dollars).[2] Its population has grown steadily since 2000, with projections indicating continued expansion in population and economic output.[3] In 2023, Brazil’s overall Human Development Index was 0.76 (on a 0 to 1 scale), which qualifies as “high human development.”[4] As it stands, Brazil’s economic potential remains largely unrealized.
Brazil recognized the PRC in 1974 after decades of diplomatic relations with the Republic of China (or Taiwan), aligning with a wave of similar decisions by other nations.[5] In 1993, it became the first Latin American country that the PRC recognized as a “strategic partner.”[6] Relations with Beijing have remained strong, with trade becoming the foundation of the partnership, leading to Brazil’s invitation to join the BRICS in the 2000s.[7] However, as of October 2024, Brazil has declined to join the PRC’s Belt and Road Initiative (BRI)—a global infrastructure and investment strategy designed to enhance connectivity and trade routes across Asia, Africa, and Latin America.[8] While it is possible that the holdout is a signal of Brazil’s unwillingness to explicitly align itself with the PRC, the decision most likely relates to the limited benefits of joining, coupled with the country’s long-standing policy of nonalignment. Brazil already receives nearly half of the investment directed to the region, suggesting that signaling alignment by joining BRI is not necessary to enhance access to Chinese capital.[9]
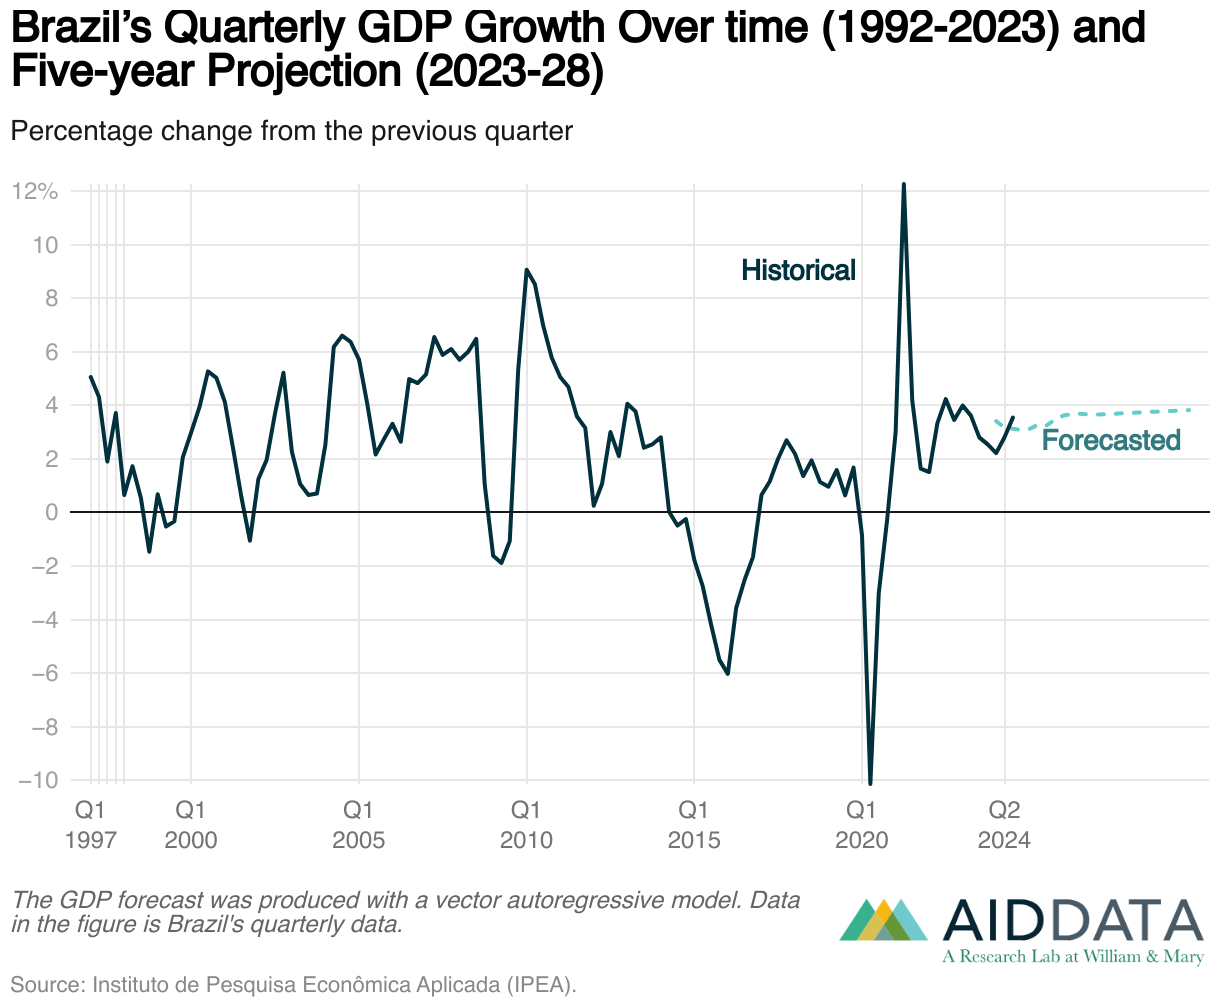
Since 1992, Brazil’s economy has experienced significant fluctuations. Periods of robust growth in the early 2000s were followed by contractions during the global financial crisis and the political and economic crises of the mid-2010s, which included a recession, the impeachment of President Dilma Rousseff, and U.S. tariffs on steel and aluminum (see Figure 1). A sharp decline of GDP growth in 2020 reflects the negative impact of the Covid-19 pandemic. Overall, recent history suggests that Brazil’s economy is indeed exposed to external shocks—similar to what it would face from a slowdown of the PRC economy. Post-pandemic recovery has been uneven, with growth strongly rebounding briefly before stabilizing at lower, though positive, levels. The “forecast GDP” line in Figure 1 represents the GDP growth forecast generated by AidData’s model, which includes variables for tariff and pandemic shocks that directly affect Brazil’s growth potential. The forecasts suggest that Brazil will experience an initial shock and dip in growth but sustain positive economic growth, albeit without significant improvement.[10] This projection underscores the challenges facing the country in maintaining long-term economic momentum amid global uncertainties and domestic structural issues.
Our analysis focuses on two major economic inputs that link the PRC to Brazil: trade and development financing. While foreign direct investment is another significant channel— amounting to approximately $73.3 billion across 264 confirmed projects in Brazil between 2007 and 2023—FDI is not included in our analysis due to issues with data quality and availability.[11]
The remainder of this case study examines the potential impact of the PRC’s economic slowdown on Brazil by first exploring how shifts in the PRC’s domestic demand could influence Brazil’s economic performance, including its trade dynamics and investment flows, and then identifying vulnerable sectors and potential mitigating responses. We find that Brazil is substantially vulnerable to changes in the Chinese economy due to its dependence on commodity exports. The case study concludes with policy options for Brazil to navigate these challenges effectively.
The PRC’s Trade with Brazil
Brazil’s bilateral trade with the PRC has undergone remarkable growth since the 1990s (see Figure 2). Cumulatively, between 1992 and 2023 the PRC exported $648.3 billion worth of goods to Brazil, while importing $1.215 trillion worth of goods from Brazil, resulting in a total trade value of $1.864 trillion over this period.[12] During this time, Brazil consistently maintained a trade surplus with the PRC each year, underscoring its role as a critical supplier of raw materials and commodities that fueled the economic growth of the PRC in its infrastructure- and investment- driven era. Brazil’s large trade surplus with the PRC also highlights the latter’s reliance on high- value exports such as soybeans, iron ore, and crude petroleum.[13] This dynamic has consistently driven bilateral trade and allows Brazil to maintain a more balanced economic relationship than other countries that are heavily dependent on what the PRC imports from them. While this trade deficit, from Beijing’s perspective, is not inherently harmful—offering access to affordable inputs that boost domestic productivity—it could create vulnerabilities for the PRC. The PRC might view a persistent deficit as making the country overly reliant on foreign goods, weakening its domestic industries, and threatening the goal of self-sufficiency, which was discussed in chapter 1. In response, Beijing might seek to boost exports or curb reliance on key imports, particularly commodities. Beyond these policy factors, Brazil is also highly vulnerable to changes in Chinese demand, given that the PRC is responsible for over a quarter of Brazilian exports.[14]

The total value of trade between Brazil and the PRC has experienced exponential growth, especially since the early 2000s, as seen in Figure 2. Years with significant spikes in trade activity include 2010, which was the year following Brazil’s entry into the BRICS, as well as 2011, 2018, and 2021. Notably, total trade peaked at $163.2 billion in 2021, driven by Brazil’s robust export performance. Overall, increasing trade with the PRC has coincided for Brazil with some periods of economic expansion, such as in the 2000s, but also periods of low to negative growth in which its trade with the PRC still increased.
While Figures 1 and 2 show the general trend of Brazil-PRC trade, they do not tell the story of the sectors driving these numbers. Table 1 further breaks down trade flows by stage of production and product sector for the entire period from 1992 to 2022, for 2010, and for 2021.[15] The table highlights the PRC’s reliance on Brazil for energy and other commodities. The raw materials category consistently tops both overall imports and total trade flows. When broken down by sector, minerals are the top sector in total trade and in what the PRC imports from Brazil, while fuels consistently come in third. Capital goods—equipment and machinery used to produce other goods—are consistently the top export from the PRC to Brazil.
Table 1
Top Brazil-PRC sectors and stages by trade flow
“Exports” refers to PRC exports to Brazil. “Imports” refers to PRC imports from Brazil.
1992-2022 (Cumulative)
| Trade Flow | Top Stage | Top Sectors |
|---|---|---|
| Total Trade | Raw materials |
|
| Exports | Capital goods |
|
| Imports | Raw materials |
|
2010
| Trade Flow | Top Stage | Top Sectors |
|---|---|---|
| Total Trade | Raw materials |
|
| Exports | Capital goods |
|
| Imports | Raw materials |
|
2021
| Trade Flow | Top Stage | Top Sectors |
|---|---|---|
| Total Trade | Raw materials |
|
| Exports | Capital goods |
|
| Imports | Raw materials |
|
Source: World Integrated Trade Solution (WITS) database.
Note: Imports refers to PRC imports from Brazil, and exports refer to PRC exports to Brazil. Stage refers to stages of production (capital goods, consumer goods, intermediate goods, or raw materials), and sector refers to the specific sector of the product.
A slowdown in the PRC’s economy could disrupt this dynamic. Declining industrial and consumer demand may reduce its imports of raw materials for energy, which are Brazil’s primary exports to the PRC. This shift could pose challenges for Brazil, as the PRC’s evolving growth model dampens demand for other major Brazilian exports like iron ore. Around 60% of Brazil’s iron ore exports go to the PRC, making it the top destination and Brazil’s second-largest export to the PRC, behind only soybeans.[16]With the PRC moving away from an infrastructure-heavy economy (see chapter 1), Brazil will need to navigate a shifting trade landscape where its traditional commodity exports may play a diminished role. This could in turn narrow the country’s trade surplus or even result in a trade deficit, diminishing the benefits Brazil currently enjoys from its balanced economic position. This could further expose the Brazilian economy to future external shocks, such as supply chain disruptions or geopolitical tensions with key trade partners.
That being said, it is important to avoid overstating the direct impact of a slowdown in the PRC economy on Brazil’s GDP growth. The increase of trade between the two countries has not consistently translated into higher economic growth in Brazil. Instead, Brazil has experienced substantial fluctuations in growth, particularly in the 2010s, despite consistent growth in trade with the PRC. Furthermore, given the size of the PRC’s economy, even a depressed growth rate would still result in a substantial increase in global demand.
The PRC’s Development Finance in Brazil
Overall and sectoral perspectives. Since 2000, the PRC has committed approximately $54 billion in development financing to Brazil (see Figures 3 and 4).[17] Chinese investments have been heavily concentrated in a few key sectors (Figure 5), and nearly 98% of this financing is in the form of debt (i.e., loans with interest rates approaching market rates) as opposed to aid (i.e., grants or loans at no interest or low interest rates).[18] The sector of industry, mining, and construction accounts for the largest share, totaling $28.1 billion, or 51.6% of the PRC’s development finance commitments in Brazil. Within this sector, Rio de Janeiro leads other states with $16.1 billion in investments— nearly 60% of all mining projects—while Goiás ranks second at $2.7 billion. Notably, the PRC owns two niobium (columbium) mines in Goiás. Niobium is a resource critical for strengthening steel, producing jet engine superalloys, developing superconducting magnets for advanced technologies, and enhancing the stability of electronic capacitors—applications that certainly fit with the PRC’s strategy of pursuing a high-tech growth strategy centered on hard technology.


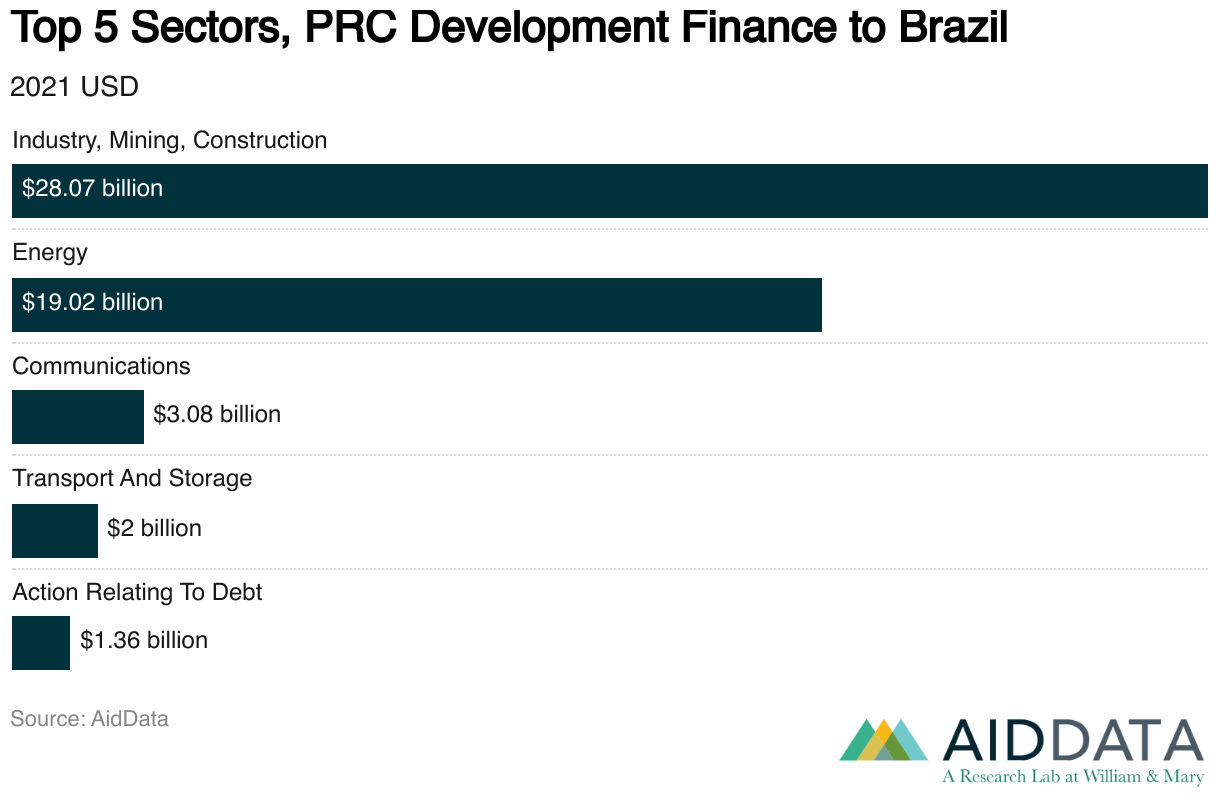
Energy is the second-largest recipient of the PRC’s development financing in Brazil, accounting for approximately 35% of total commitments, or $19 billion.[19] The state of Rio Grande do Norte, located in Brazil’s northeast, is the top destination for these investments, attracting $11.7 billion. This includes one major deal between Petrobras and the China Development Bank (CDB) in 2016, where an over $10 billion line of credit was provided in two $5.75 billion tranches to help Petrobras manage its debt obligations.[20]
Investments in communications and transport and storage, the third- and fourth- largest recipient sectors, respectively, further underscore the PRC’s strategic emphasis on telecommunications, resource extraction, and infrastructure critical to its global supply chain and energy security goals. For example, in 2009 the CDB provided loans of $450 million and $750 million to Telemar Norte Leste SA to purchase telecommunications equipment and services from Huawei.[21] Similarly, in 2015 the CDB issued a $673 million loan for the same purpose. In 2018, it extended yet another loan of $4.2 million to Telemar Norte Leste SA, although the terms and purpose remain unclear.
The top two sectors—industry, mining, and construction, followed by energy—are particularly vulnerable as Beijing seeks to target its investments more precisely. The compositional changes in the PRC’s economy that were discussed in chapter 1 suggest a decrease in the need for those inputs. Furthermore, despite Brazil’s substantial known reserves of critical minerals, the country might not be able to rely on the PRC’s investment to mine them, as it has done with iron ore.
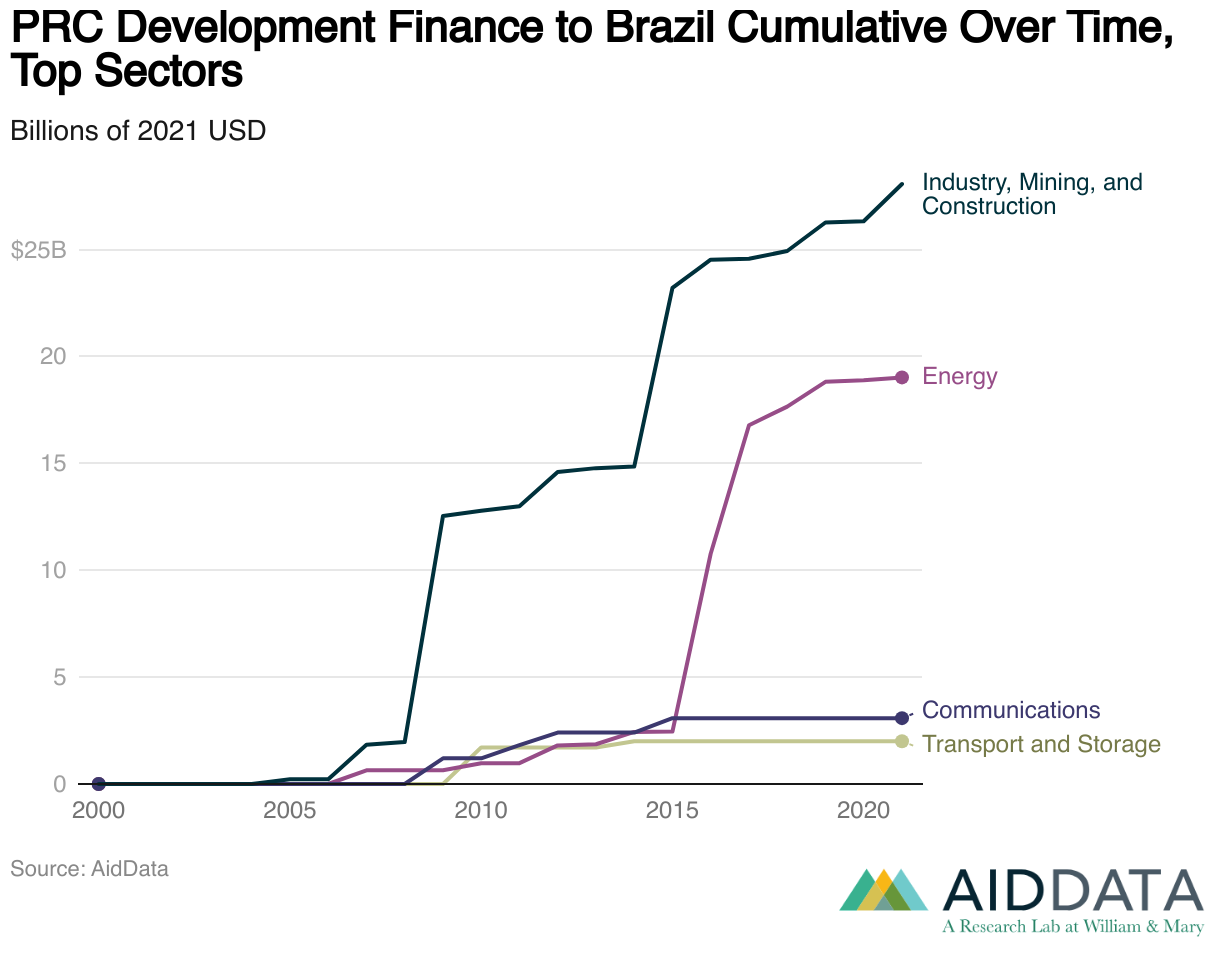
Temporal trends in investment and economic growth. Over time, PRC investments in financial development trends reveal a marked increase in activity after the global financial crisis in 2008 (see Figure 6). Overall PRC development finance surged sharply in 2009 and coincides with Brazil’s entrance to the BRICS grouping, aligning with the country’s efforts to attract foreign capital for large-scale projects. Sectorally, the biggest project driving the spike comes from the industry, mining, and construction sector—namely a $10.5 billion line of credit provided by the CDB to Petrobras for oil exploration in the Santos Basin.[22] The years 2016 and 2017 marked significant milestones in Brazil’s energy sector, featuring major projects such as a $1.2 billion overseas investment loan from the Industrial and Commercial Bank of China to facilitate CTG Brazil’s acquisition of the Ilha Solteira and Jupiá hydropower dams.[23] In 2017 the Bank of China participated in a $145.8 million syndicated buyer’s credit loan as part of a larger project to construct a 292-megawatt solar power plant in Ribeira do Piauí, located in Brazil’s northeastern state of Piauí.[24] Construction began in July 2016, and the plant became operational in September 2017. After the dramatic increase from 2015 to 2017, growth in the energy sector continued, albeit at a slower pace, as seen in Figure 6. Meanwhile, investments in communications and transport have remained relatively modest by comparison, with incremental growth over time.
Interestingly, the relationship between PRC development finance and Brazil’s GDP growth reveals a more complex dynamic (see Figure 7). While some periods of high investment coincide with economic growth, the overall trend suggests a negative association, whereby higher PRC financing aligns with slower GDP growth. This pattern underscores the influence of broader macroeconomic factors, which appear to play a more decisive role in shaping Brazil’s economic performance.

Implications of the PRC’s Economic Slowdown for Brazil
The PRC’s domestic economic slowdown could disrupt Brazil’s access to development financing for at least three reasons. First, since most PRC development assistance comes in the form of loans, a reduction in new financing or refinancing could strain ongoing projects, as well as hinder the initiation or expansion of others, in key sectors like energy and mining. As of 2021, Brazil was the seventh-largest recipient of PRC development finance among low- and middle-income countries.[25] That makes it particularly vulnerable to future slowdowns. Additionally, repayment obligations could become more challenging if Brazil’s economic growth slows in parallel, increasing the risk of financial distress to the borrower. Reduced Chinese demand for Brazilian exports like soybeans and iron ore could further exacerbate debt-servicing pressures and strain Brazil’s economy.
Second, the PRC’s efforts to reduce indebtedness across its economy could have an impact on Brazil as a top receiver of PRC FDI by constraining debt-laden Chinese firms, limiting their ability to sustain or expand overseas investments.[26] For example, HNA Group invested aggressively in Brazil’s aviation sector in the mid-2010s, acquiring a 23.7% stake of the airline Azul in 2015 and 30% of the Rio de Janeiro–Galeão International Airport in 2017.[27] However, HNA Group accumulated over $96.25 billion in debt by 2018.[28] Subsequently, it shifted quickly from aggressive global expansion to asset sales once Beijing emphasized domestic debt reduction.[29]
A third, related reason is the PRC’s policy of capital controls aimed at curbing private FDI along with curbing BRI projects that underperformed—those seen as being marred by corruption, provoking political backlash, or yielding disappointing financial results (discussed in more detail in chapter 1). As with Beijing’s push to reduce indebtedness, capital controls could affect Brazil due to the substantial FDI it receives from the PRC. BYD, a Chinese battery and electric vehicle manufacturer, began constructing a factory in the northeastern state of Bahia in 2024, where 163 Chinese nationals were found to be working in conditions compared to “slavery.”[30].A Chinese company, Jinjiang Group, was contracted to build the factory for BYD. As a result, Brazilian officials halted the $484.2 million project to build the electric vehicle factory in early 2025.[31]
Policy Options
Brazil’s economic engagements with the PRC, especially through trade and development financing, increase its vulnerability to the PRC’s own economic performance. Declining energy demand or reduced flows of development finance from the PRC could affect the course of Brazil’s growth plan and pose significant risks to the country’s economic stability. This vulnerability underscores the importance of diversifying Brazil’s export markets and reducing over-reliance on a single trading partner. By addressing these challenges, Brazil can improve its economic diversity and build resilience against future global and domestic uncertainties. To mitigate domestic consequences of a Chinese economic slowdown, Brazil could consider the following policy options:
- Diversify export markets and reduce over-reliance on a single trading partner. When possible, Brazil should pursue trade agreements with other major markets, including India, Southeast Asia, and Africa. Expanding export opportunities can help the country stabilize its economy against shocks stemming from the PRC’s economic fluctuations. Brazil’s export market is currently heavily concentrated in the PRC, making it particularly vulnerable to fluctuations in the Chinese economy.
- Strengthen domestic financial, regulatory, and governance frameworks. Brazil should foster a stable, attractive investment environment by reforming regulations, offering tax incentives, and improving infrastructure to attract a broader range of investors and reduce reliance on Chinese development finance. With PRC financing playing a central role in Brazil’s development and emerging signs that the Chinese economy is slowing down, Brazil must ensure that future investment supports high-quality, sustainable growth. Strengthening democratic institutions and curbing corruption would also facilitate access to loans and investments from Western institutions that emphasize governance and transparency, diversifying Brazil’s financial partnerships and reducing exposure to external risks.
- Leverage existing ties to renegotiate more favorable loan terms with the PRC. Nearly 98% of Brazil’s development finance comes in the form of debt, with interest rates approaching market rates. Lower rates on financial development projects would reduce Brazil’s debt-servicing costs, freeing up fiscal space to counterbalance the negative effects of the PRC’s economic slowdown with fiscal policy measures. This helps ensure that critical infrastructure, energy, and mining development projects continue without placing additional financial strain on the Brazilian economy during a period of global uncertainty. By lowering the burden of repayment, Brazil can better maintain stability even if new funding flows from the PRC diminish.
Germany
Germany holds a central position in the world economy. It is the third-largest economy after the United States and the PRC and the largest economy in the European Union.[32] In current dollar terms, Germany’s 2023 GDP of $4.5 trillion and GDP per capita of $54,000 give the country substantial economic power at both the national and individual levels. While the PRC has a much larger GDP ($17.8 trillion), it has a lower GDP per capita ($12,000). The differential in GDP per capita could play into how the PRC’s economic slowdown affects Germany. The lower labor costs in the PRC could continue to make its manufacturing sector highly competitive (see chapter 1), potentially continuing to attract German foreign direct investment. In 2021, German FDI stocks in the PRC reached $118 billion.[33] Combined with lower labor costs, the PRC has almost 17 times the population of Germany, which gives it an enormous pool of labor to expand manufacturing even amid slowing economic growth.[34]
Nonetheless, Germany faces a possible weakness in an environment of slowing Chinese economic growth. As a net exporter to the PRC, Germany could see its economy take a hit from lower exports, particularly in the automobile sector. While most vehicles from German automakers sold in the PRC are made locally there, many models are still imported from Germany. As noted in chapter 1 of this report, the PRC’s efforts to expand its high-tech manufacturing and promote self-sufficiency in strategic technologies and industries make the components of German exports particularly vulnerable.
Outside of economic factors, global politics could determine the impact of the PRC’s economic slowdown on the German economy. Russia’s invasion of Ukraine and the PRC’s support to Russia prompted a turning point in Germany-Russia relations that affected Germany’s relations with the PRC.[35] Since the invasion, businesses in Germany have reduced reliance on Chinese parts for products through diversification to manufacturers in other countries.[36] Such diversification can make these companies more resilient to supply-chain issues relating to Chinese inputs. But it also increases the risk that German companies that have invested in the PRC’s manufacturing sector may see shrinking export markets back to Germany.
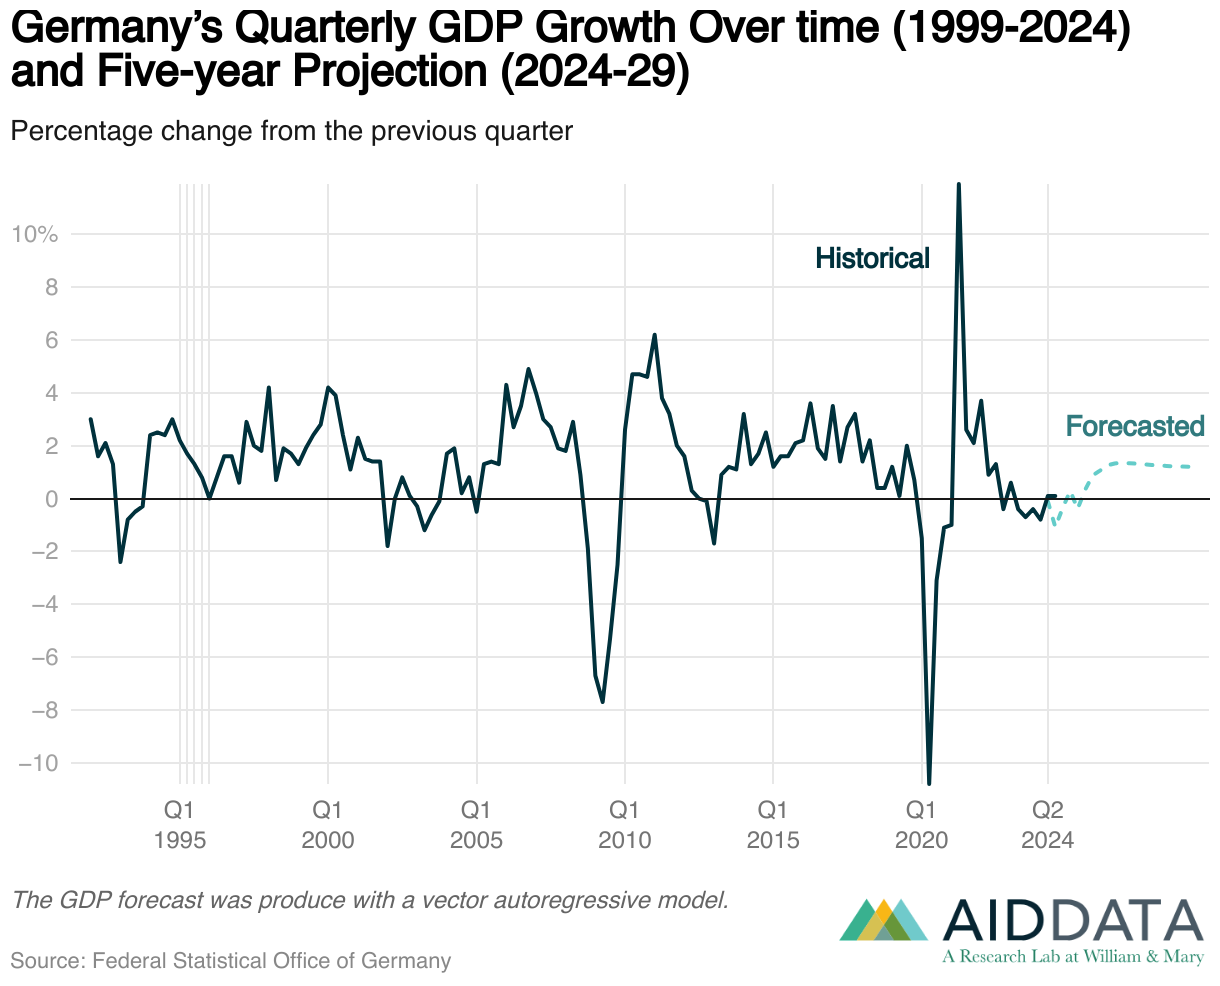
Even with its size and strength, the German economy has experienced several downturns stemming from slowdowns in key trading partners, reflecting its exposure to external shocks. The global financial crisis in 2008 and the Covid-19 pandemic in 2020 were the two most notable shocks, as seen in a graph of quarterly GDP growth from the end of 1999 through 2024 (see Figure 8). The euro area crisis that started for other EU countries in 2009 had a delayed effect on Germany, which first recovered from the 2008 global financial crisis and then did not succumb to the euro area crisis until after 2010. Researchers have highlighted a number of weaknesses in existing policies that have persisted after the euro area crisis, suggesting continued vulnerability to external shocks.[37]
Germany is already experiencing a decline in GDP, which may be seen as starting with Russia’s invasion of Ukraine in 2022, following a large rebound in the economy after the Covid-19 pandemic. Yet, higher energy prices resulting from the war in Ukraine might not be the only factor slowing the German economy. Analysts and economists suggest that high interest rates; external competition; an aging population, which reduces the size of the labor force; overdependence on exports, including those to the PRC; and weak growth in productivity also play a role.[38]
The economic downturns of the past and the current economic crisis suggest that the PRC’s economic slowdown would either be neutral or contribute to a further slowdown in Germany’s economy. Our forecast for GDP growth from 2024 to 2029 shows an immediate decline in GDP growth, followed by a temporary rebound and a flattening of growth, as seen in Figure 8.[39] While the model does not simply show a continued downward trend, it does suggest that an economic shock from a slowdown in the PRC economy will produce lower growth than otherwise would be expected.
The PRC’s Trade with Germany
As expected for the size and diversity of its economy, Germany has very active trade with the PRC (see Figure 9). Over time the country has maintained a trade surplus—or at worst a limited trade deficit—making it an outlier among the PRC’s largest trading partners. During the period from 1992 to 2008, Germany fluctuated between having a slightly positive or slightly negative trade balance with the PRC. Starting in 2009, it consistently maintained a positive trade balance for over a decade. After 2021, however, both exports from and imports to the PRC began to plummet. This decline in trade could be in part a consequence of Russia’s invasion of Ukraine. The PRC’s support for Russia, combined with Germany’s opposition to the invasion, led to a cooling of relations between Germany and the PRC, which might have slowed down trade. Declining bilateral trade could have a negative effect on Germany’s GDP growth, even before accounting for the effect of the slowdown in the PRC’s economy. It may, therefore, be difficult to know if the current deceleration of the German economy is primarily due to a slowing Chinese economy or other factors—whether related to the bilateral relationship or outside it.

PRC imports from Germany do not focus on raw materials, as is often the case for countries less developed than Germany, nor do they focus mainly on consumer goods. They instead focus on capital goods (see Table 2). The share of capital goods, however, has been decreasing. In 1992, consumer goods accounted for 14% of PRC imports from Germany, rising gradually to 31% by 2022, while throughout the period from 1992 to 2022 over half of the PRC’s imports from Germany were capital goods.[40] In particular, from 1992 to 2009, capital goods accounted for over 60% of the PRC’s imports from Germany, but they gradually declined to around 50% by 2022.
Table 2
Top Germany-PRC sectors and stages by trade flow
“Exports” refers to PRC exports to Germany. “Imports” refers to PRC imports from Germany.
1992-2022 (Cumulative)
| Trade Flow | Top Stage | Top Sectors |
|---|---|---|
| Total Trade | Capital goods |
|
| Exports | Capital goods |
|
| Imports | Capital goods |
|
2010
| Trade Flow | Top Stage | Top Sectors |
|---|---|---|
| Total Trade | Capital goods |
|
| Exports | Capital goods |
|
| Imports | Capital goods |
|
2021
| Trade Flow | Top Stage | Top Sectors |
|---|---|---|
| Total Trade | Capital goods |
|
| Exports | Capital goods |
|
| Imports | Raw materials |
|
Source: World Integrated Trade Solution (WITS) database.
Note: Imports refers to PRC imports from Germany, and exports refer to PRC exports to Germany. Stage refers to stages of production (capital goods, consumer goods, intermediate goods, or raw materials), and sector refers to the specific sector of the product.
Why should a focus on capital goods over consumer goods matter? In terms of trade stability, capital goods will be less prone to changing consumer preferences or the weak consumer demand identified as a major factor driving the PRC’s slowdown. Trade in capital goods will have a level of stability not found in consumer goods for this reason. Capital goods are, however, subject to the level of demand for production, which could be reduced during an economic slowdown. The continued strength of Chinese manufacturing exports, even in times of economic slowdown, could thereby prop up the demand for the capital goods required to produce those consumer goods.
Yet, the stabilizing effect of a strong Chinese manufacturing sector on demand for imports of German capital goods could be countered by other factors. As the Chinese industry matures, the PRC will produce more of the capital goods it requires domestically, thereby reducing demand for German capital goods. The growth of manufacturing in the PRC, as well as the level of manufacturing, can affect the demand for capital goods. New or expanded production that is part of growth will require higher levels of capital goods than existing manufacturing. If the level of manufacturing remains stable, but growth is limited, there will be less demand for capital goods than during a high-growth period.
Other factors that could change PRC demand for German capital good are the globalization of Chinese manufacturing, shifts of trade to other countries due to tariff or non-tariff barriers on Chinese imports, or even other countries becoming more competitive. If some Chinese manufacturing moves to other countries, will the Chinese joint ventures or subsidiaries in those countries be as motivated to import capital goods from Germany? The success of German firms selling capital goods to these countries will depend in part on how established Germany’s trade and business relationships are with them.
While the foregoing analysis has focused on capital goods, it is important to note that certain sectors of the German economy that rely on exports of consumer goods to the PRC are substantially vulnerable to fluctuations in the Chinese economy. For example, the PRC represents a large share of global sales of luxury brands such as Porsche and Adidas.[41]
Bilateral Investment Flows
Alongside their robust trade relationship, the PRC and Germany actively invest in the other’s economy. Despite the PRC’s strict capital controls following major outflows around 2015, Germany has contributed much more foreign direprct investment and foreign portfolio investment (FPI) to the PRC than the PRC has to Germany (see Figure 10).[42] Examining the stocks of FDI since 2010, Germany started with around $48 billion in combined FDI and FPI. Germany expanded its investment in the PRC to $119 billion by 2022. FDI from Germany ranged from $43 billion in 2010 to $95 billion in 2022, with a peak of $118 billion in 2021. The PRC’s FDI in Germany, on the other hand, declined to less than $6 billion by 2022. The trend for PRC FDI in Germany did not include portfolio investment because of the tight capital controls that restrict outbound portfolio investment from the PRC, as noted in chapter 1.[43]
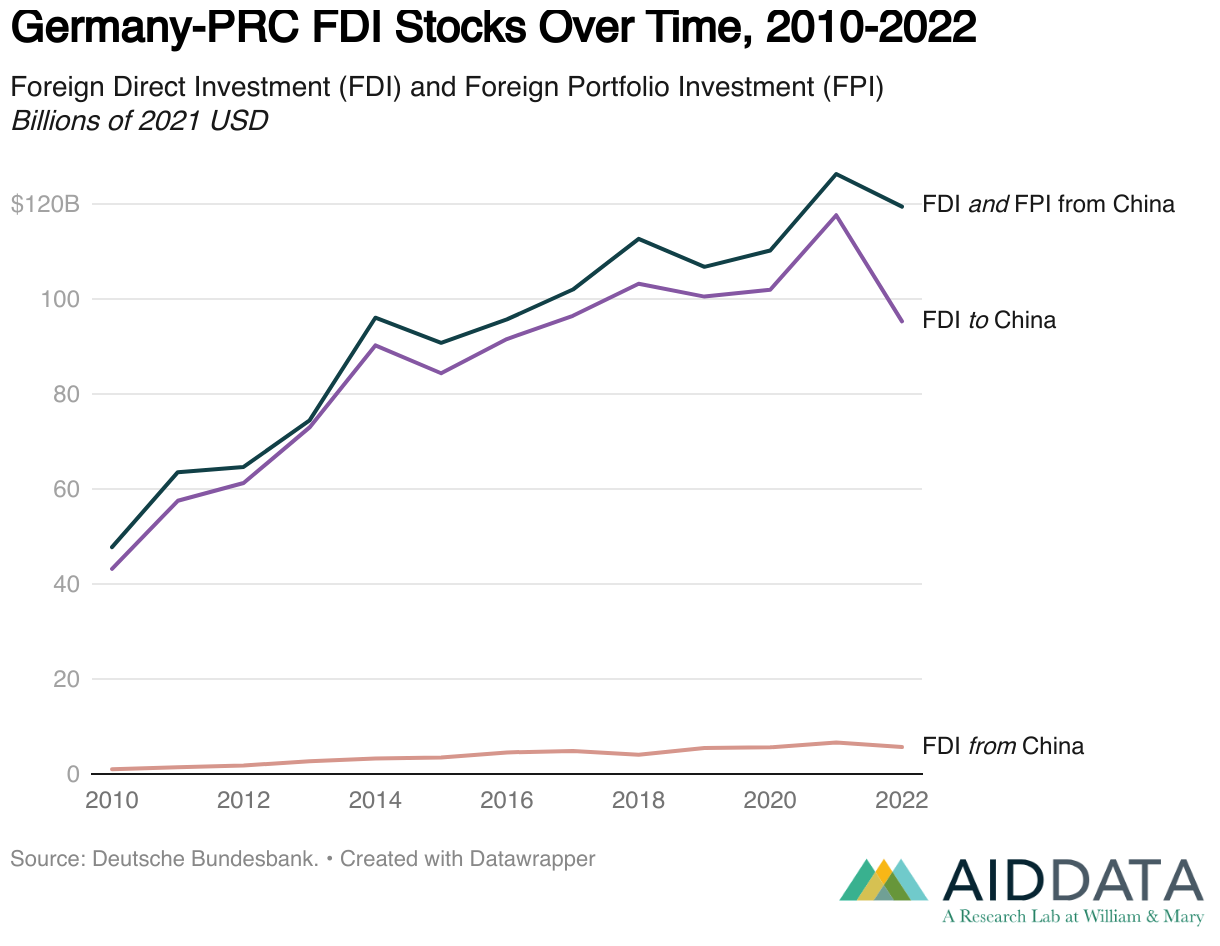
How might this relatively high level of FDI from Germany to the PRC affect the former’s broader economic fortunes?[44] The degree to which the German economy is dependent on returns from this FDI will influence the effect on German GDP. The level of FDI, while seemingly high, represents less than 3% of Germany’s GDP, which is over $4 trillion annually. Profits that German investors received from FDI in 2021 were estimated to be only $18 billion, which is less than 1% of GDP.[45] Given the low levels of FDI and related profits relative to GDP, as well as the challenges in increasing FDI due to fears that investments are difficult to exit because of the PRC’s tight capital controls, it seems unlikely that a reduction in FDI from Germany will have much effect on the GDP of Germany.
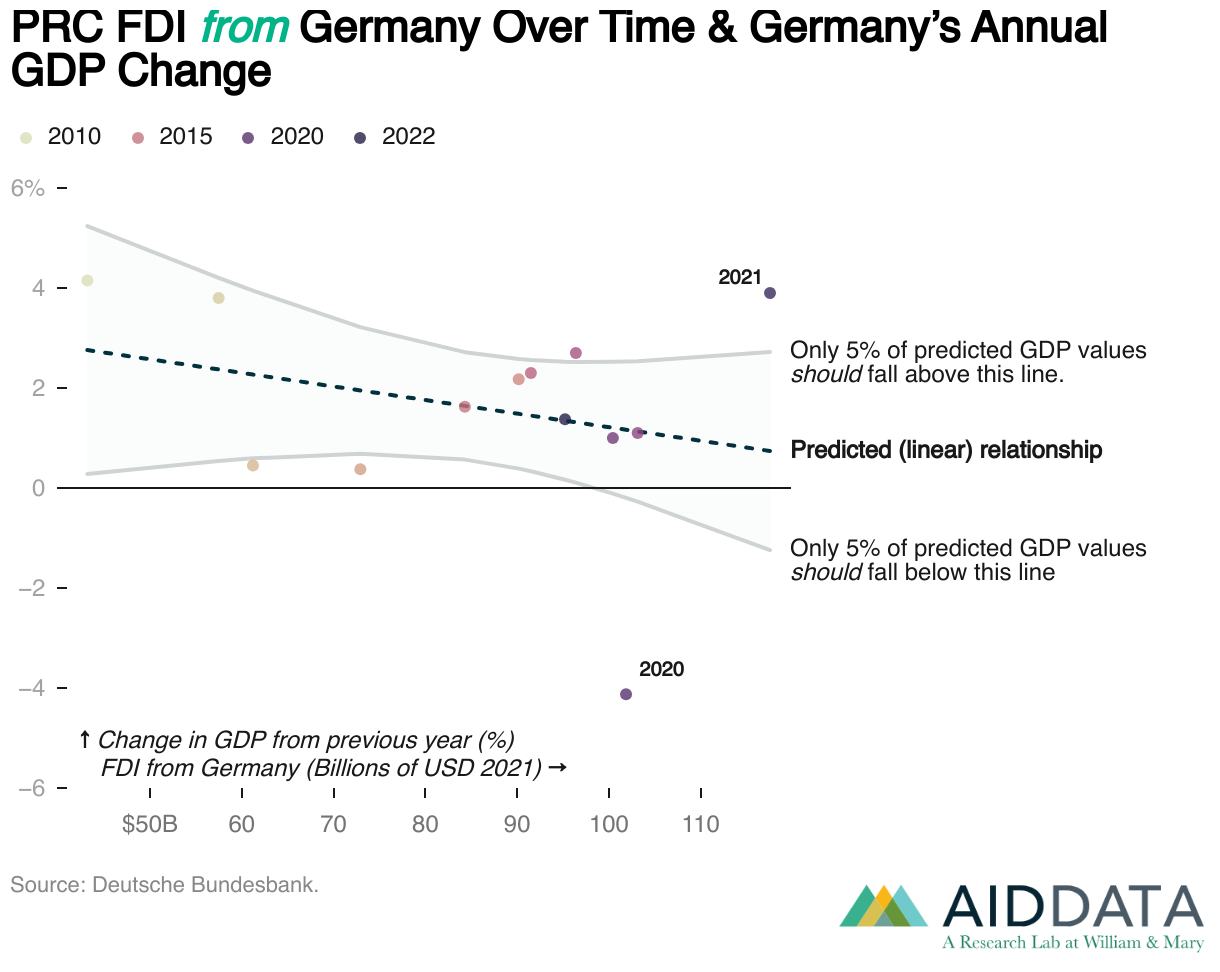
The first step in assessing whether FDI from or to the PRC can influence German GDP is to view the change in FDI along with the change in GDP (see Figures 11, 12, and 13). The annual change in FDI reflects new inputs to FDI minus divestments. This net change accounts for the total investment/divestment in the year and is what would be expected to influence the GDP.[46] In the case of FDI from the PRC to Germany and FDI from Germany to the PRC, the pattern of the change in FDI does not clearly mirror the pattern of the quarterly change in GDP. To test whether either type of FDI is correlated with changes in GDP, regression models were run to evaluate the effect of the change in FDI to and from Germany on GDP change. Both models (see Figures 14 and 15) did not find a significant effect. In short, neither German investment into the PRC nor PRC investment into Germany particularly matters for German GDP growth. These results are not surprising, given the limited size of FDI relative to the size of Germany’s GDP—a phenomenon partly driven by the PRC’s capital controls and the limited sample size.


Policy Options
As the third-largest economy in the world, with a highly competitive manufacturing sector and a central role in European and global supply chains, Germany occupies a special position in the global economy. When Germany falters, the rest of Europe is affected and to some extent the rest of the world; similarly, Germany has shown that it is vulnerable to economic downturns stemming from external shocks. The intertwining of the German and PRC economies in terms of trade and investment makes both countries vulnerable to the economic slowdown of the other.
Germany and the PRC depend on each other for capital goods to support their export-oriented economies. In the 1990s, trade was characterized by the PRC exporting consumer goods to and importing capital goods from Germany. Through the 2000s, the PRC gradually caught up to Germany to the point where its exports of capital goods to Germany met or exceeded imports of German capital goods. Germany has become as dependent on capital goods from the PRC as the PRC is dependent on Germany. The story for consumer goods is different. While Germany had been catching up to the PRC on trade of consumer goods, in the last few years the trend has shifted back to the PRC dominating the consumer goods trade. As the PRC’s manufacturing base broadens, it will have an advantage to increase exports to Germany, particularly of consumer goods. Exports of consumer goods could be what gives the PRC a long-term trade surplus with Germany. To avoid sustained dependence on the PRC, Germany needs to look for other trade options.
Geopolitical events also are pushing Germany to consider alternatives. After Russia’s invasion of Ukraine, Germany re-evaluated its interactions with the PRC as well as with Russia. Some de-risking has occurred,[47] and trade has slowed as German companies have begun to diversify the acquisition of critical resources and the production of products away from the PRC to other countries. Moreover, Germany is currently experiencing its own economic slowdown, irrespective of the PRC. The slowing of the Chinese economy exacerbates these economic woes.
For all these reasons, the resilience of the German economy will, in general, depend on diversification. While Germany will continue the large volume of trade with the PRC and investment in and from the PRC, its current level of dependence on the PRC need not remain fixed. Germany already has very active trading and investment relations with the United States and many other countries in Europe and Asia to draw on for diversification. To reduce its dependence on the PRC, Germany could consider the following policy options:
- Diversify export and import markets and reduce over-reliance on the PRC. Germany already has very active trading partnerships with other European countries, the United States, and many other countries globally. Germany should evaluate its trade ecosystem and consider expanding or refocusing efforts to increase its market access and reduce vulnerability to the economic well-being of any one country. Expanded or refocused trading relationships can reduce risks to the supply chain for German industrial production, particularly in the automotive industry, and provide more stable sources for consumer goods.
- Evaluate and guide FDI with the PRC.As a larger provider of FDI to the PRC than a recipient, Germany should evaluate the experience of its companies and institutions investing in the PRC. How well have these investments returned value, and what alternatives exist for investment in other markets? What impacts do the PRC’s tight capital controls have on German investments, both presently and in the future? Understanding the answers to these questions can help the German government create guidance and policies to protect German investment interests in the PRC.
- Leverage existing ties within the EU and Europe more broadly to promote economic stability.Looking more closely at its neighboring countries could improve Germany’s relations with them, diversify markets for investment, and improve trading relations. Creating joint strategies and working to curb the economic and political influence of the PRC on Germany and Europe could strengthen cooperation between European countries, thereby increasing political stability and fostering economic growth within the region.
Indonesia
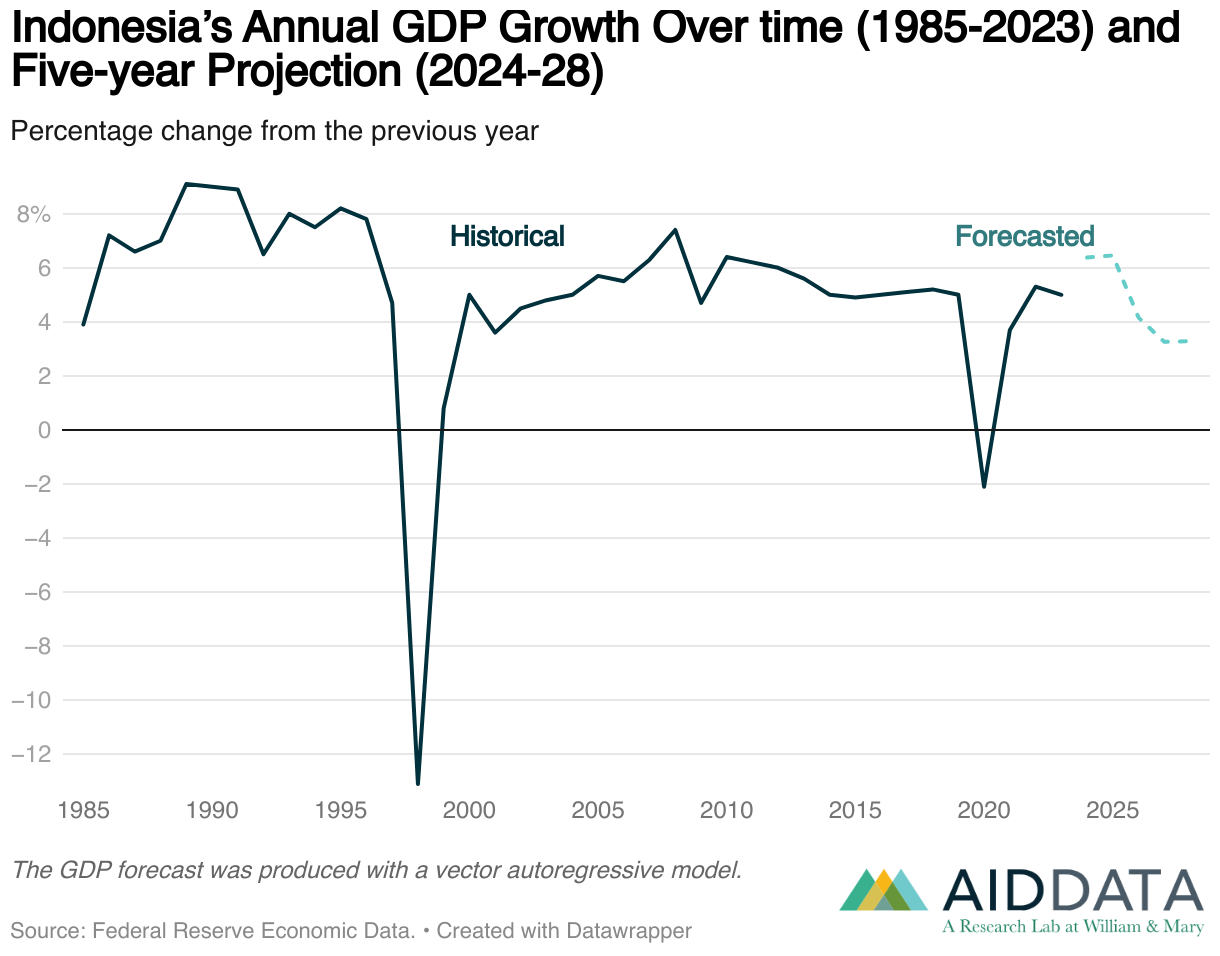
While the PRC is by far the largest economy in Asia, Indonesia is an important regional power in Southeast Asia. With a population and an economy twice the size of its neighbors, Indonesia is a leader in the Association of Southeast Asian Nations (ASEAN) and a bellwether for the economy of the region as a whole. On January 7, 2025, the BRICS members formally admitted it to the trade bloc as a full member, reflecting their desire to deepen economic linkages between Indonesia, the PRC, and other members of the bloc. Since the ASEAN-China Free Trade Area (ACFTA) was created, trade flows between Indonesia and the PRC have seen dramatic growth.[48]Meanwhile, Indonesia has sustained an upward trajectory in economic and human development for most of that period, raising important questions about just how much of the country’s rise is contingent on the economic links to and growth of its mainland neighbor (see Figure 16).
Despite having first established diplomatic relations in 1950, Jakarta and Beijing have had a contentious relationship. The Suharto regime suspended diplomatic recognition of the PRC shortly after wresting power from President Sukarno in 1967, and only resumed diplomatic relations in 1990.[49] Since then, Indonesia has joined a number of multinational initiatives with the PRC, including the Belt and Road Initiative in 2015.
This case study focuses on two major economic channels that link the PRC to Indonesia: trade and development finance. While the PRC’s foreign direct investment is another significant channel—amounting to approximately $7.4 billion in realized investment projects in 2023, nearly 15% of total FDI and on par with the total investments from the United States, Canada, and Europe combined[50]—our analysis does not include FDI due to the lack of transparent valuation methods and long-term disaggregated data.
The remainder of this case study analyzes how trade dynamics and investment flows between Indonesia and the PRC could influence the Indonesian economy. We find that Indonesia’s raw commodities exports are particularly vulnerable to fluctuations in the PRC’s economy, but there are opportunities for Indonesia to protect itself from these fluctuations by seeking new partnerships—either through strengthening trade agreements and reducing trade barriers or by moving up the value chain to produce semi-processed goods that can be exported to advanced economies. Although Indonesia has already shifted its trade with the PRC upward in the value chain, the conclusion suggests additional steps Jakarta could take to reduce its vulnerability to a slowdown in the Chinese economy.
The PRC’s Trade with Indonesia
Following the signing of a formal trade agreement in August 1990, trade between the PRC and Indonesia rapidly expanded under the framework of the ACFTA. Cumulatively, between 1992 and 2023 the PRC exported $754.4 billion worth of goods to Indonesia, while importing $703 billion worth of goods, resulting in a total trade value of $1.457 trillion over this period.[51] During this time, Indonesia alternated between a trade surplus and a trade deficit with the PRC several times (see Figure 17). It transitioned from a consumer of Chinese capital goods and processed metals during much of the 2010s to an exporter of intermediate goods in the current decade.
Metals, particularly iron, steel, nickel, and copper goods, are one of the key throughlines undergirding this changing relationship. While iron and steel were a leading inbound category in 2022 (amounting to $6.7 billion, or 9% of Indonesia’s imports from the PRC), Indonesia exported nearly three times as much back to the PRC ($19.0 billion, or 28% of Indonesia’s exports to the PRC).[52] The value of these exports represented an increase of over 27 times from 2010 levels.[53] Crucially, alongside a change in quantity of metal, the quality of metal has shifted as well. In the early 2010s, Indonesia’s metal exports were dominated by raw or scrap metals, which are very low-input commodities, with the PRC dominating flows of finished or processed metals. Now, Indonesia is exporting far more semi-finished goods to the PRC, indicating an increasing domestic capacity and decreasing reliance on Chinese processing firms. This is potentially a result of a net-positive strategy on Indonesia’s side to move up the value chain by requiring buyers to set up processing facilities in the country (see chapter 1 for further discussion). However, it is important to note that the results of the bans on exports of raw minerals have been different for other products. In the case of bauxite, the 2014 export ban led to the PRC replacing imports from Indonesia with new supplies from Guinea and a drastic drop in Indonesian production of bauxite. In the case of nickel, by contrast, the 2020 export ban was quite successful, leading to substantial investment in mineral processing and manufacturing in Indonesia.[54] As the PRC’s manufacturing sector is likely to remain highly competitive and self-sufficiency remains a major political goal for the country in spite of its economic slowdown, Indonesia’s efforts to move up the value chain in this space could face headwinds. Coupled with slowing growth in the rate of the PRC’s demand for commodities due to the decline of infrastructure- and construction-driven growth, Indonesia’s metals sector may be further squeezed.
Fuel exports from Indonesia to the PRC are not growing at the same pace and appear to be detaching from the rapid rise seen across other goods. This trend is possibly a reflection of the broader trend in the PRC’s economy (discussed in chapter 1) away from the kind of energy- intensive infrastructure-driven growth that led to massive fuel imports. Throughout the past two decades, petroleum and coal exports were a central pillar of the bilateral trading relationship. Indeed, much of the recent reversal in the Indonesian trade deficit (as seen in Figure 17) can be attributed to a $12.7 billion jump in Indonesian fuel exports to the PRC between 2020 and 2021. However, prior to this jump, fuel goods had declined from 35% of Indonesia’s PRC-bound exports to just over 25%. Petroleum exports from Indonesia to the PRC decreased by 6% between 2022 and 2023, and exports of lignite coal and briquettes were down as well.[55] These declines ended a five- year run where coal exports from Indonesia to the PRC more than doubled in value (increasing by 146% and 174%, respectively). The PRC still retains a near monopoly on Indonesian lignite, buying approximately 95% of Indonesia’s annual exports. As a result, if demand declines, Indonesia will need to either diversify markets or face contractions. In contrast, semi-processed coal goods such as briquettes have a variety of alternative markets, the largest of which is India. From 2018 to 2023, Indonesia’s briquette exports to India grew from $6.75 billion to $9.4 billion.[56] Japan, Taiwan, and South Korea are all also leading consumers. As with metal commodities, should an economic slowdown restrict the PRC’s appetite for raw lignite, Indonesian producers may have to look to processed exports in related goods to reach other advanced markets across South and East Asia, or face large declines in domestic production, as seen in the case of bauxite.
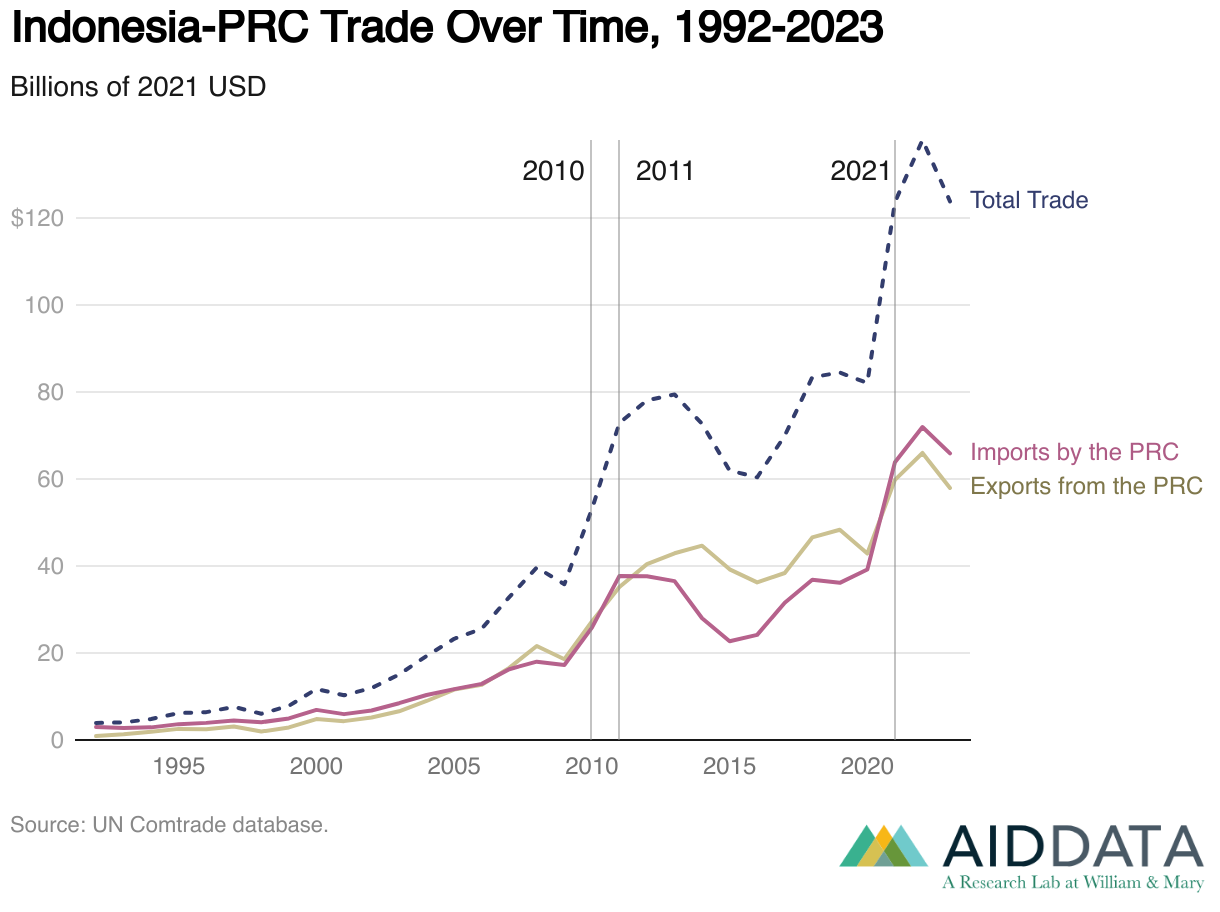
Key “banner” years in the bilateral trade relationship include 2010 and 2011, following the ACFTA’s drawdown of tariffs. Bilateral trade again spiked in 2021, buoyed by fuel exports, as economies reopened during the Covid-19 pandemic. One counterintuitive trend stands out. Indonesia signed onto BRI in March 2015, with much discussion of bolstering trade relations. However, this period aligned with a clear decline of $19.1 billion in trade volumes between 2014 and 2016 (see Figure 17).[57] This appears to indicate that “trade sweeteners” were not an immediate priority for Beijing as it sought to bring more members of ASEAN into its development initiative, and that the purported economic benefits of BRI are not necessarily found in increased trade volumes.
Table 3 further breaks down trade flows (exports, imports, and total trade) by stage of production and sector of product for the entire period from 1992 to 2022, 2010, and 2021.[58] Capital goods, particularly machine and electric goods, dominate Chinese exports to Indonesia, while fuels consistently lead the countervailing flows. However, as discussed above, increased value- adding processes for metal exports have led to a shift in the total portfolio of Indonesia’s exports to the PRC. Raw materials were the leading category of trade in 2010, whereas intermediate goods made up the largest share in 2021.
Table 3
Top Indonesia-PRC sectors and stages by trade flow
“Exports” refers to PRC exports to Indonesia. “Imports” refers to PRC imports from Indonesia.
1992-2022 (Cumulative)
| Trade Flow | Top Stage | Top Sectors |
|---|---|---|
| Total Trade | Intermediate goods |
|
| Exports | Capital goods |
|
| Imports | Raw materials |
|
2010
| Trade Flow | Top Stage | Top Sectors |
|---|---|---|
| Total Trade | Raw materials |
|
| Exports | Capital goods |
|
| Imports | Raw materials |
|
2021
| Trade Flow | Top Stage | Top Sectors |
|---|---|---|
| Total Trade | Intermediate goods |
|
| Exports | Capital goods |
|
| Imports | Intermediate goods |
|
Source: World Integrated Trade Solution (WITS) database.
Note: Imports refers to PRC imports from Indonesia, and exports refer to PRC exports to Indonesia. Stage refers to stages of production (capital goods, consumer goods, intermediate goods, or raw materials), and sector refers to the specific sector of the product.
A downturn in the PRC’s economy is likely to reduce demand for raw materials for energy and for intermediate materials for construction and capital goods. In particular, as discussed in chapter 1, this slowdown and the accompanying changes in the PRC’s growth model are likely to be particularly hard on commodity imports—with the potential for even “new” commodities such as critical minerals to not see the same sustained price increases that traditional commodities such as oil or iron ore have encountered. In the short term, this could narrow Indonesia’s trade surplus or even result in a trade deficit. Indonesia is unlikely to slow down its computer and telecommunication imports, and there are few ready and able alternative sources for these goods. In the medium to long term, however, the disruption to Indonesia’s trade balance could accelerate pressure to transition domestic production sectors away from raw and intermediate materials toward technologies and finished consumer goods, as Indonesia and ASEAN pursue higher-value production and resilience against external disruptions. Nonetheless, as noted in chapter 1, the slowdown in the PRC’s economy will likely not affect the growing competitiveness of its manufacturing sector—posing significant challenges to countries like Indonesia that seek to move up the value chain. An additional challenge to Indonesia’s efforts to move up the value chain is its reliance on non-tariff-measures, which adds up to an average tariff equivalent of 30%, increasing the costs of inputs and potentially hindering Indonesia’s ability to transition further away from commodity exports.[59]
The PRC’s Development Finance in Indonesia
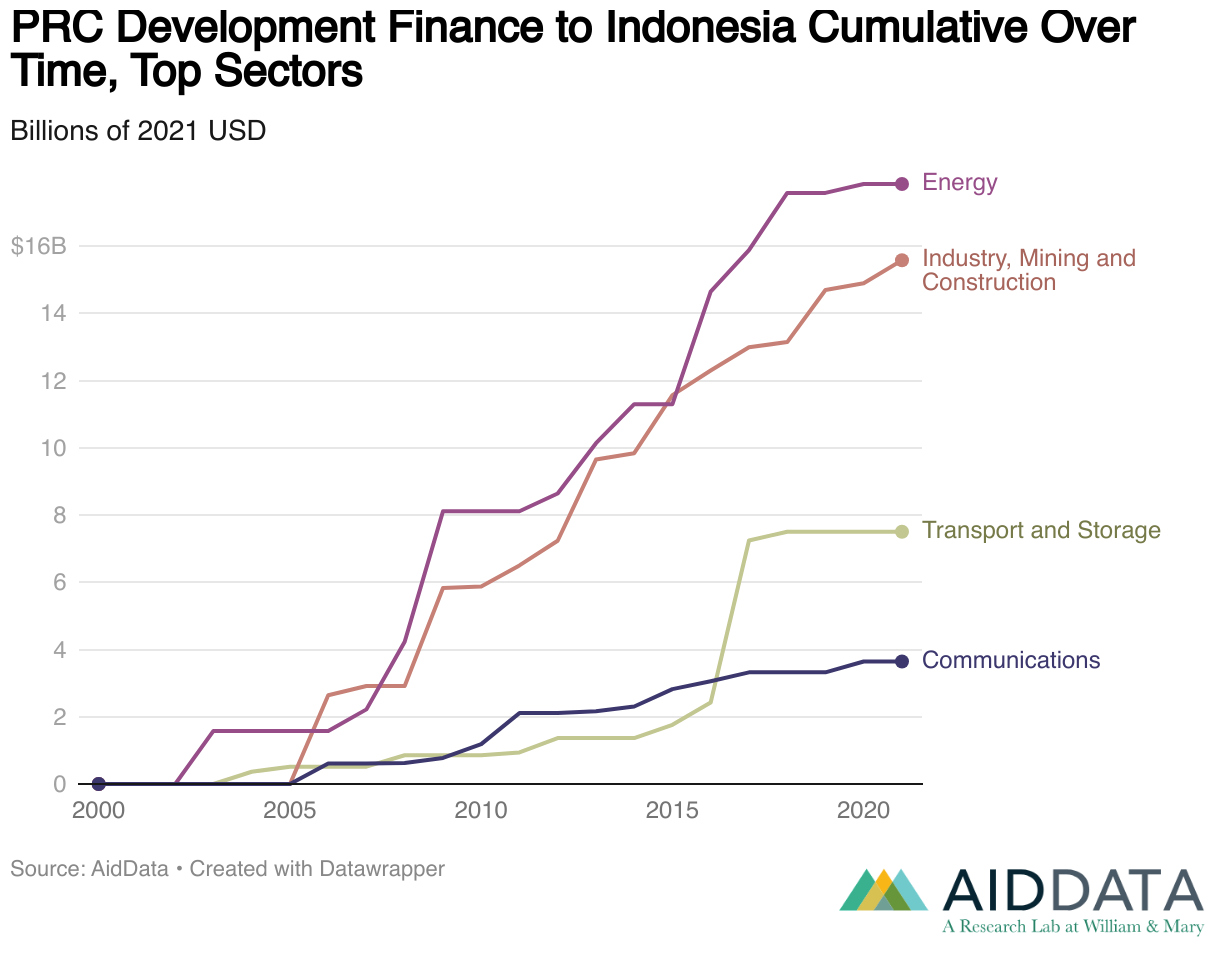
Overall and sectoral perspectives. Since 2000, the PRC has committed approximately $55.2 billion in development financing to Indonesia, with investments heavily concentrated in infrastructure sectors such as energy, industry, and mining (see Figure 18).[60] Nearly 89% of this financing is in the form of debt (i.e., loans with interest rates approaching market rates) as opposed to aid (i.e., grants or loans at no interest or low interest rates). The energy sector accounts for the largest share of PRC official development financing, totaling $17.9 billion, or 32% of the PRC’s development finance commitments in the country (see Figure 19).[61]
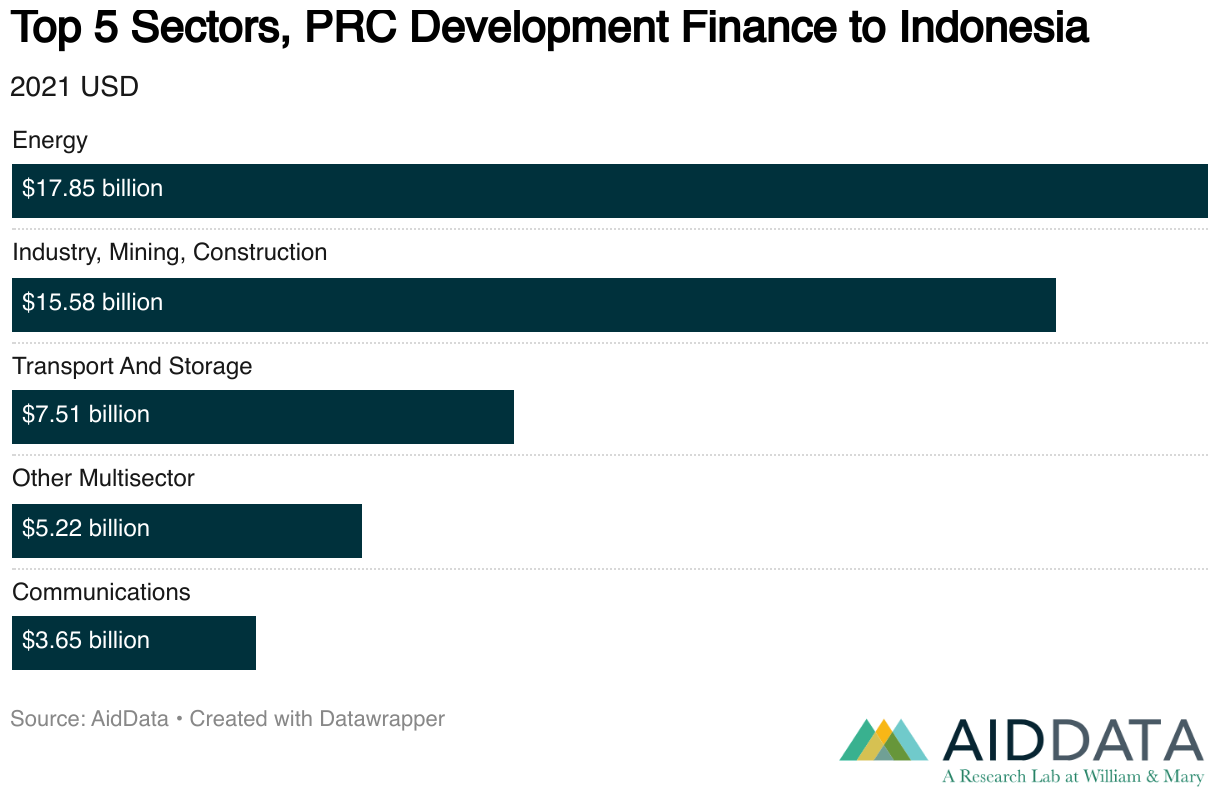
Energy was closely followed by the industry, mining, and construction sector, which accounted for 28% of the PRC’s official development financing. These sectors are both capital- and material- intensive and benefited from Beijing’s desire to divest itself of its foreign currency reserves and excess capacity in construction materials since 2013.[62] Furthermore, many of these projects are focused on expanding Indonesia’s domestic production capacity and thereby increasing the PRC’s access to high-value or strategic inputs. In 2021, PRC banks committed $686.7 million to two large mineral projects: phase 1 of the Indonesia Lithium Project at Morowali Industrial Park and the Huayou Nickel and Cobalt Project.[63] These projects indicate that Beijing anticipates high-value metals continuing to be at the core of Indonesia’s exports, as the PRC seeks to expand its access to transition and rare earth metals. Since 2015, Indonesia has attracted six major loans investing in transition minerals, collectively worth $3.5 billion.[64]
Investments in transport and storage, the third-largest recipient sector, further underscore the PRC’s strategic emphasis on infrastructure critical to its global supply chain goals, as well as potentially expanding access to capital for transformative infrastructure projects. A banner example of these investments is the Jakarta-Bandung high-speed-rail project. The project was originally proposed by the Japan International Cooperation Agency, but the CDB bid on the project and won by promising to implement it in three rather than five years.[65] The project was financed in two loans collectively worth $4 billion with a forty-year maturity, ten-year grace period, 2.00%–3.46% interest rate, and no sovereign guarantees.[66]
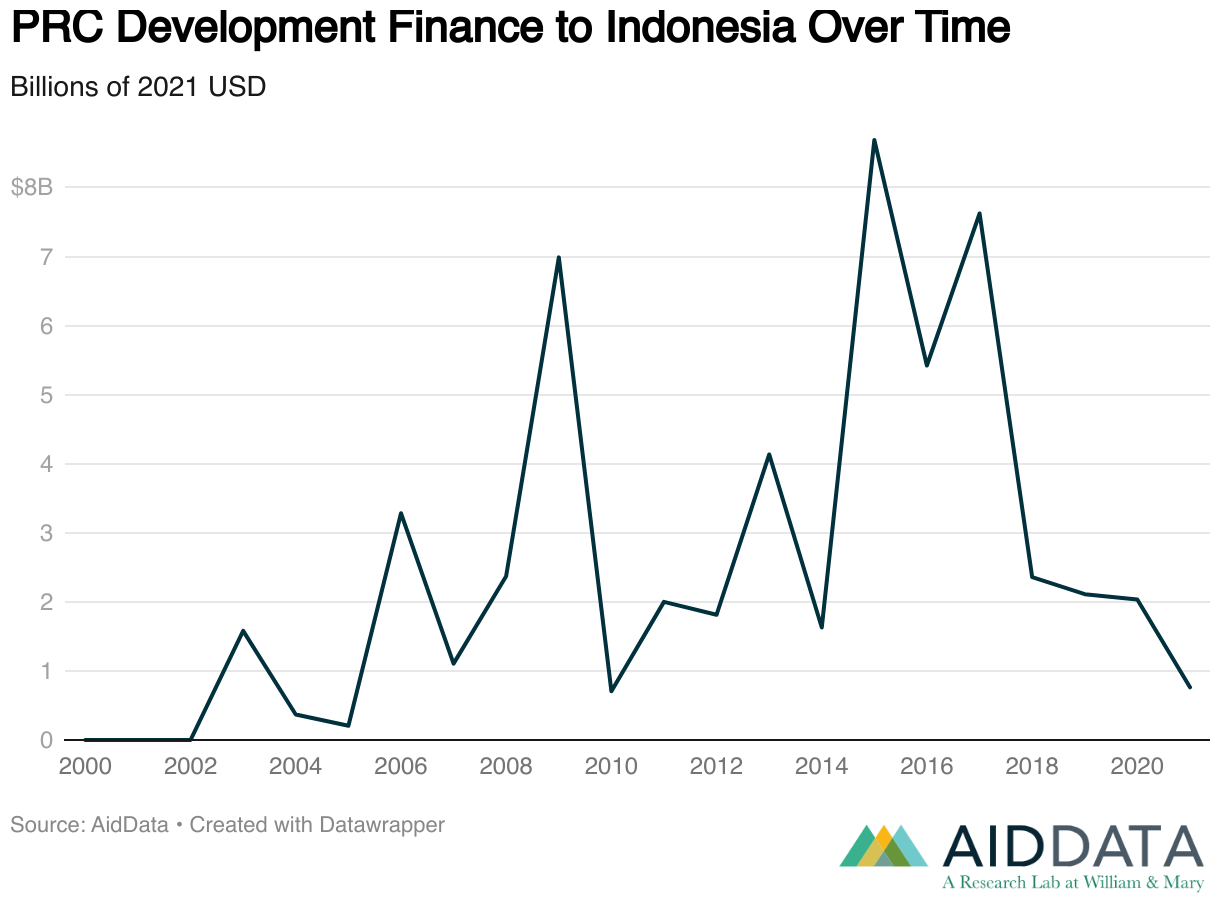
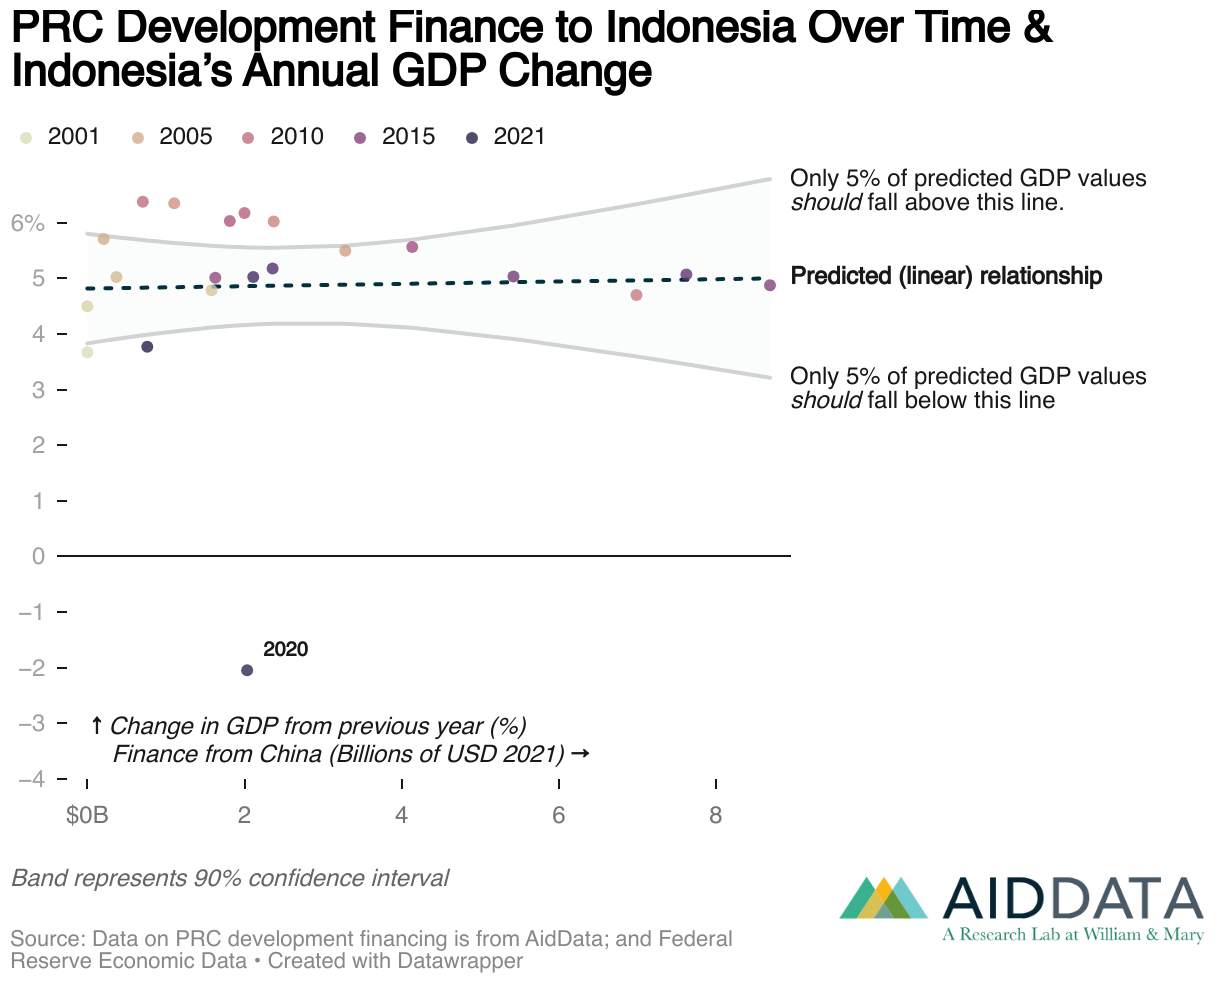
Temporal trends in investment and economic growth. Trends in the PRC’s development finance reveal a marked increase in activity after 2006. The growth of investment was by no means steady, however, with peaks in 2009, 2015, 2016, and 2017 (see Figure 20). Notably, PRC development finance surged after Indonesia’s entrance into BRI, reflecting mutual efforts to mobilize Chinese capital for large-scale projects. Financing increased over four times, from $1.6 billion to $8.7 billion between 2014 and 2015. This is a common trend in the PRC’s engagement with some members, where there is increased attention from state-backed investors during the years surrounding BRI memoranda of understanding as an incentive to join the development initiative. Interestingly, however, this spike in investment did not offset the overall declines in trade between Indonesia and the PRC during these years (as seen in Figure 17). Moreover, official finance did not coincide with any noticeable changes in Indonesia’s quarterly GDP (see Figure 21), where the only significant recent shifts have resulted from the global disruptions during the Covid-19 pandemic.

Implications of the PRC’s Economic Slowdown for Indonesia
The PRC’s domestic economic slowdown could disrupt Indonesia’s access to PRC development financing. As of 2021, Indonesia was the sixth-largest recipient of PRC development finance among low- and middle-income countries, giving it a large exposure to slowdowns in these flows, particularly in the sectors of energy and mining. As noted in chapter 1, these flows will likely continue to become more targeted. Between 2018 and 2021, there has already been a noticeable slowdown of new projects in the energy sector. This may still reflect a residual impact of the Covid-19 pandemic, but might also be foreshadowing a move of Chinese development financing away from coal and toward critical minerals, particularly given that this negative trend is not observed in the industry, mining, and construction sector. Given the expectation that as long as the PRC runs a current account surplus there will be continuous flows of income to finance investment abroad, it is reasonable to expect that there will be some reallocation of the sectors of Chinese development financing rather than a drastic reduction in those investments, as discussed in chapter 1.
Still, Indonesia’s sustained decades of economic growth have come from domestic developments rather than any one international partner. Beijing’s growing investments in Indonesia, while they could unlock the potential for specific infrastructure projects or industries, did not on their own increase the country’s GDP, nor will a wind down of these projects alone swing it to the negative (see Figure 22).
Policy Options
The Indonesian economy has close linkages to the PRC economy not only because of geographic proximity, but also due to a series of strategic, economic, and geopolitical factors that make Indonesia attractive to the PRC. Indonesia’s geostrategically important location as a crossroads for major trade routes between the Indian Ocean and the Pacific Ocean; its burgeoning middle class, which potentially is a large market for Chinese consumer goods; and its riches of natural resources are all compelling factors for strong engagement from the PRC.
From the Indonesian side, engagement with the PRC economy is double-edged. It provides access to trade, investment, and financing but also exposes Indonesia to vulnerabilities. In particular, the Indonesian economy is substantially reliant on the PRC, which is the destination for nearly a quarter of its exports. While several factors mitigate Indonesia’s vulnerability to fluctuations in the PRC economy—such as the country’s critical minerals reserves, including the world’s largest reserves of nickel and copper as well as substantial reserves of bauxite and tin, and its relatively diverse economy—the following policy measures could help soften the impacts of a negative shock to the Chinese economy:
- Strengthen regional trade agreements.Seeking new agreements with regional partners such as Japan and South Korea, as well as with the EU, would diversify Indonesia’s export markets and reduce the risks from a Chinese economic downturn by offering alternative markets for semi-processed goods in countries that do not have appropriate infrastructure to import raw materials and do the initial processing locally.
- Diversify the targets for “old economy” commodities away from the PRC.Markets for coal and crude palm oil are highly concentrated in India and the PRC, which makes Indonesia highly vulnerable to fluctuations in demand. Exploring new markets such as Africa could mitigate that risk.
- Continue to seek agreements that favor domestic capacity building. Indonesia could push for investment regimes that finance construction of the necessary infrastructure for the country to move away from an over-reliance on exports of raw materials to the PRC and toward exports of semi-finished goods to other advanced economies in Asia. This is particularly imperative in the context of the energy transition, as global economies, including the PRC economy, slowly reduce their demand for raw materials such as coal and petroleum in favor of critical minerals. Yet, such a transition requires careful assessment of the quality of the mineral reserves to ensure that the restrictions will lead to greater investment rather than market loss. Although Indonesia’s critical minerals sector is already heavily influenced by the PRC, agreements such as the memorandum of understanding signed with the United Kingdom could mitigate Chinese influence.
- Prepare for rising demand for critical minerals. Although Indonesia is best known for its large reserves of nickel, copper, bauxite, and tin, it also actively mines other critical minerals such as gold, titanium, and cobalt.[67]Countries, including the PRC, will seek to import these and other critical minerals from Indonesia to fulfill the demand from their growing technology- intensive industries. Indonesia has already developed a partially successful strategy for nickel. Yet, as discussed in chapter 1, even a ban on exports of raw materials does not fully protect the country from some negative effects of Chinese engagement. While Indonesia initially had a positive experience with the PRC’s processing of nickel, the price fell as the Chinese plantswithin Indonesia overproduced. Based on this experience and the experience of other countries with critical minerals, Indonesia should develop a comprehensive plan for critical minerals. In particular, it should conduct an assessment of critical minerals reserves and value, ownership of mineral rights and mining companies, extraction and processing, trade, and governance.
- Reduce trade barriers.A movement away from exports of raw materials toward exports of manufacturing goods requires cheap inputs. Indonesia has substantially high non-tariff barriers, and targeted reforms are necessary to stimulate growth in its manufacturing sector.
Nigeria
Nigeria has great opportunities but also great challenges for economic growth. Rich in oil, natural gas, coal, and mineral resources, the country has yet to translate the wealth from these resources into an overall high level of well-being for the Nigerian people.[68] Oil continues to be the major source of revenue for government operations, but rather than lift Nigeria out of poverty, oil wealth has created a chronic state of dependence.[69] Instead of providing a basis for growth in other areas, the dominance of oil has discouraged development of other industries and led to dependence on imports of consumer goods, many of which are imported from the PRC.
The oil industry has primarily extracted oil and then shipped crude oil to other countries for processing. Until the Dangote refinery was brought online in January 2024, the limited and dated refining capacity in Nigeria fell far short of producing the refined petroleum products required to meet its own demand. Most refined petroleum products had to be imported from other countries. The operation of the Dangote refinery promises to change this and meet all of Nigeria’s domestic requirements while also providing a surplus for export.[70]
The high population growth in Nigeria poses one of its most pressing development issues. With a total fertility rate of over 5, the country has grown by 80% from 126 million in 2000 to 228 million in 2023.[71] As Nigeria’s population continues to grow at a high rate, this growth will tax resources to feed, house, educate, and create jobs for the growing population. Even the development of the oil industry, with all of its wealth, will not solve these problems.
Amid these challenges, how does Nigeria interact with the PRC? What role does the PRC play in a country like Nigeria? The two countries have long-standing diplomatic relations, having recognized each other in 1971.[72] During this time, they have maintained active trade relations, and development finance has been and continues to be one of the major ways Beijing engages Nigeria. When it was conceived in 2013, the Belt and Road Initiative did not focus on countries in Africa. This changed in September 2018 at the Forum on China-Africa Cooperation (FOCAC) when 22 African countries, including Nigeria, joined the initiative. Since then, Nigeria has received $5.7 billion in development finance from the PRC. Before joining BRI, however, it had already received $9.4 billion in development finance from the PRC starting in 2001—suggesting that joining BRI did not fundamentally change the scale of PRC development finance. A key area of Chinese development finance to Nigeria has been the energy sector, where the PRC has invested $4.8 billion since 2002—60% for natural gas projects. Another means of engagement has been people-to-people interactions, such as Nigerian officials attending the FOCAC summit. Just prior to the 2024 summit, President Bola Tinubu met with President Xi Jinping to discuss investment in Nigeria.[73]
The remainder of this case study focuses on trade and development financing as channels through which a Chinese economic slowdown could have an impact. We find that Nigeria is very dependent on Chinese imports and thus in a vulnerable position because of its continuous trade deficit. Furthermore, Chinese development financing has been growing over time since the early 2000s, while GDP growth has been declining, suggesting that at best there is not a positive correlation between both and at worst there is a negative correlation. The case study concludes with policy options for Nigeria to navigate a deceleration of the Chinese economy.
The PRC’s Trade with Nigeria
The story of trade between the PRC and Nigeria is one of dependence. While Chinese imports from Nigeria have generally increased over time, PRC exports to the country in 2023 were over eight times as large as PRC imports, putting Nigeria at a substantial trade deficit with the PRC (see Figure 23). In 2022, PRC exports were close to fourteen times as large as PRC imports. Exports from the PRC, however, have not continuously increased. Between 2014 and 2016, exports experienced a 38% drop. This corresponds to a recession in Nigeria that was prompted by a drop in oil prices.[74] Surprisingly, exports only declined slightly during the Covid-19 pandemic, followed by a large increase in 2021. That recovery was short-lived due to the recession of 2024.[75] This recession was reportedly caused by economic reforms, reducing subsidies for oil and allowing the currency to float. The reforms have led to high rates of inflation and limited the ability of Nigerians to buy goods from abroad, resulting in a marked decline of exports from the PRC to Nigeria.

Inexpensive Chinese imports have replaced local production in Nigeria, especially in the textile industry, which previously was a large employer of Nigerian labor. In 2021, textiles and clothing was the sector with the largest amount of exports from the PRC to Nigeria (see Table 4). Overall, from 1992 to 2022 consumer goods accounted for the largest share of total trade among the stages of production (raw materials, intermediate goods, consumer goods, and capital goods). Consumer goods, however, did not always dominate across this time period. In 2010, capital goods had the largest share. The largest sectors for Chinese exports in 2010 were mechanical and electrical, metals, and plastic or rubber. The dominance of capital goods in 2010 suggests that after 2010 exports of consumer goods accelerated to the point that they had the largest share across time. This suggests an increasing dependence of the Nigerian people on imported consumer goods, which crowds out potential local production.
Table 4
Top Nigeria-PRC sectors and stages by trade flow
“Exports” refers to PRC exports to Nigeria. “Imports” refers to PRC imports from Nigeria.
1992-2022 (Cumulative)
| Trade Flow | Top Stage | Top Sectors |
|---|---|---|
| Total Trade | Consumer goods |
|
| Exports | Consumer goods |
|
| Imports | Raw materials |
|
2010
| Trade Flow | Top Stage | Top Sectors |
|---|---|---|
| Total Trade | Capital goods |
|
| Exports | Capital goods |
|
| Imports | Raw materials |
|
2021
| Trade Flow | Top Stage | Top Sectors |
|---|---|---|
| Total Trade | Consumer goods |
|
| Exports | Capital goods |
|
| Imports | Raw materials |
|
Source: World Integrated Trade Solution (WITS) database.
Note: Imports refers to PRC imports from Nigeria, and exports refer to PRC exports to Nigeria. Stage refers to stages of production (capital goods, consumer goods, intermediate goods, or raw materials), and sector refers to the specific sector of the product.
What vulnerability does the current dominance of Chinese exports of consumer goods pose to Nigeria’s economy? In terms of GDP, Nigeria will struggle to develop its manufacturing sector to the degree that Chinese exports of consumer goods suppress local production. As noted in chapter 1, the PRC’s economic slowdown is unlikely to slow exports from the country given its large and growing capacity across the manufacturing sector, which more than suffices to cover both domestic production and exports. What is slowing exports is the devaluation of the Nigerian currency, which makes it harder for Nigerians to purchase Chinese goods—a dynamic that could continue to evolve as the PRC manages its currency with an eye toward potential economic friction with larger economies such as the United States and EU.
Across time, raw materials have held the largest share of PRC imports from Nigeria. Fuels and minerals consistently have accounted for the largest sector share. Fuels here represent petroleum products, the bulk of which has been crude oil—reflecting the fact that the PRC’s engagement with Nigeria is closely linked to the latter’s long-standing over-reliance on oil exports. While the PRC is a large importer of crude oil from Nigeria, European countries together import a much larger share of Nigerian crude oil than the PRC.[76] India and the United States also imported larger shares than the PRC. However, given the globalized nature of oil markets, particularly for refined products, which will be increasingly central to Nigeria’s exports going forward, developments in the Chinese economy likely will affect the prices that Nigerian exporters can charge—even if their primary customers are not in the PRC. China’s economic slowdown has reduced demand, which has in turn reduced global oil prices.[77] Given the importance of the Chinese economy globally and Nigeria’s own over-reliance on oil exports, the fluctuation of oil prices is likely the main channel through which the Nigerian economy is vulnerable to a domestic economic slowdown in the PRC.
The PRC’s Development Finance in Nigeria
Overall and sectoral perspectives. Development finance investments from the PRC to Nigeria began long before Nigeria entered BRI in 2018. Before then, the PRC had invested $9.4 billion, including close to $1 billion in 2002 alone. Since joining BRI in 2018, Nigeria has received an additional $5.7 billion in Chinese investments. How do these investments relate to the country’s GDP growth? Over time Chinese investment in Nigeria has generally increased, peaking at $3 billion in 2020 (see Figure 24). GDP growth has trended in the opposite direction,with a peak of 14.6% in 2002 and dips below zero in 2016 and 2020 (see Figure 25). On the surface, then, it does not seem that Chinese investment has contributed positively to GDP growth.
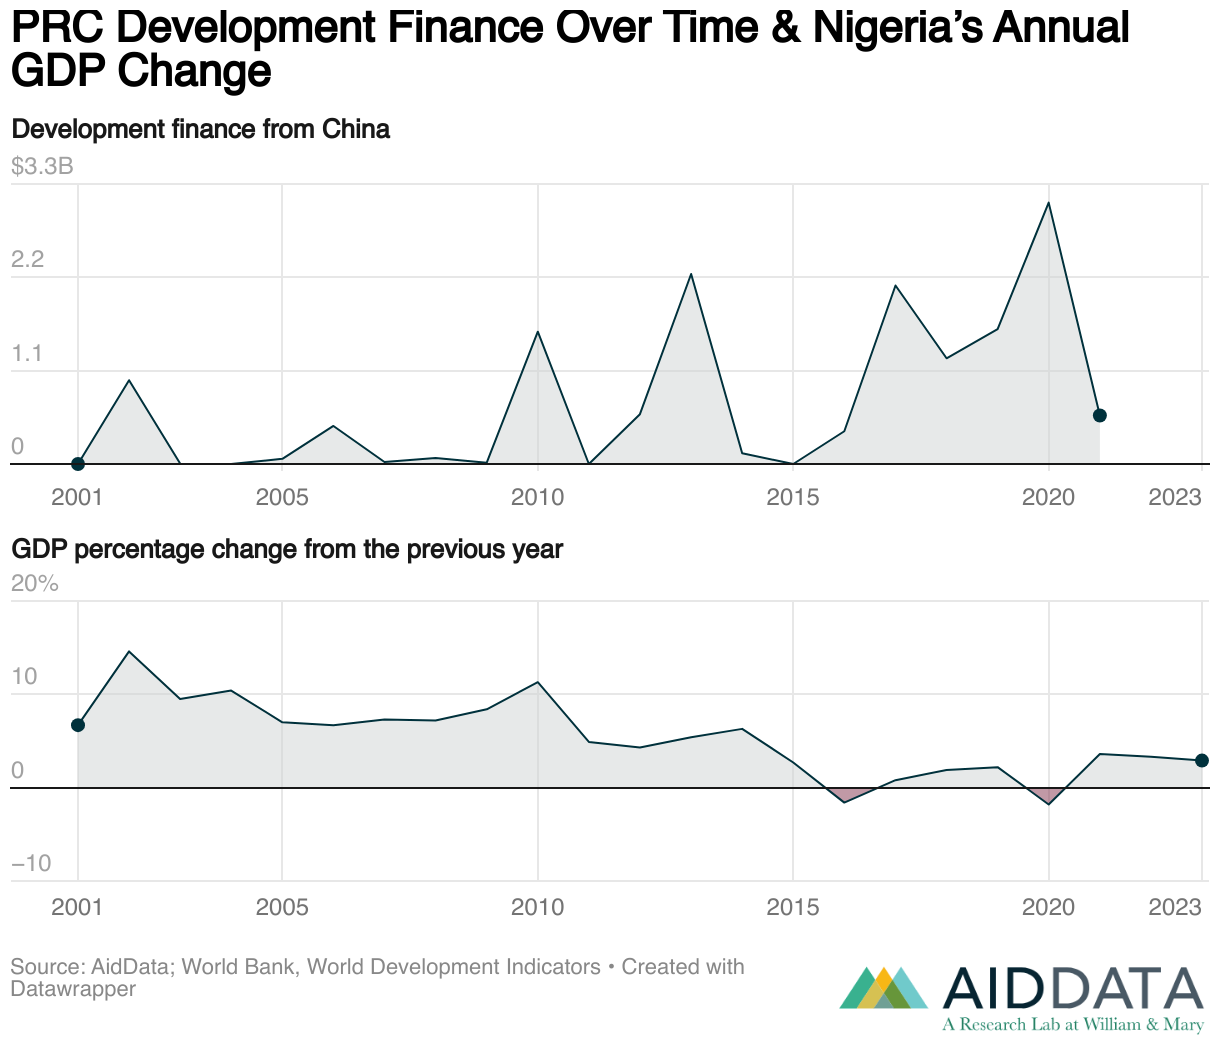
Ranking PRC development finance by sector reveals how investment can contribute to economic growth in Nigeria (see Figure 26). Transport and storage ranks highest, with railway and road projects contributing to economic growth through the movement of people and goods. A deepwater port improvement project can facilitate international trade. Unsurprisingly, energy ranks second. Investments in a natural gas pipeline and a liquified natural gas (LNG) project can spur growth by increasing natural gas exports. Telecommunications projects, ranked third, can enhance business communications, improving corporate functioning and increasing sales.

Temporal trends in investment and economic growth. An examination of trends in investments relative to economic growth reveals to what degree Chinese investment contributed to economic growth in Nigeria and could indicate how Chinese investment might stimulate future economic growth (see Figure 27). The PRC started investing in energy and communications in 2002. Investments in communications have continued at a relatively regular pace ever since, while energy did not see another investment until 2013. Investments in transport and storage did not begin until 2010, but rapidly exceeded energy and communications. Banking and financial services investments started in 2018. It is not clear whether this is an effect of BRI or the PRC responding to Nigeria’s 2016 financial crisis as a means to increase trade. The timing of the bulk of PRC investment does not correspond to the period when Nigeria’s growth was the highest, prior to 2010, but rather occurred when the country’s growth was slower.

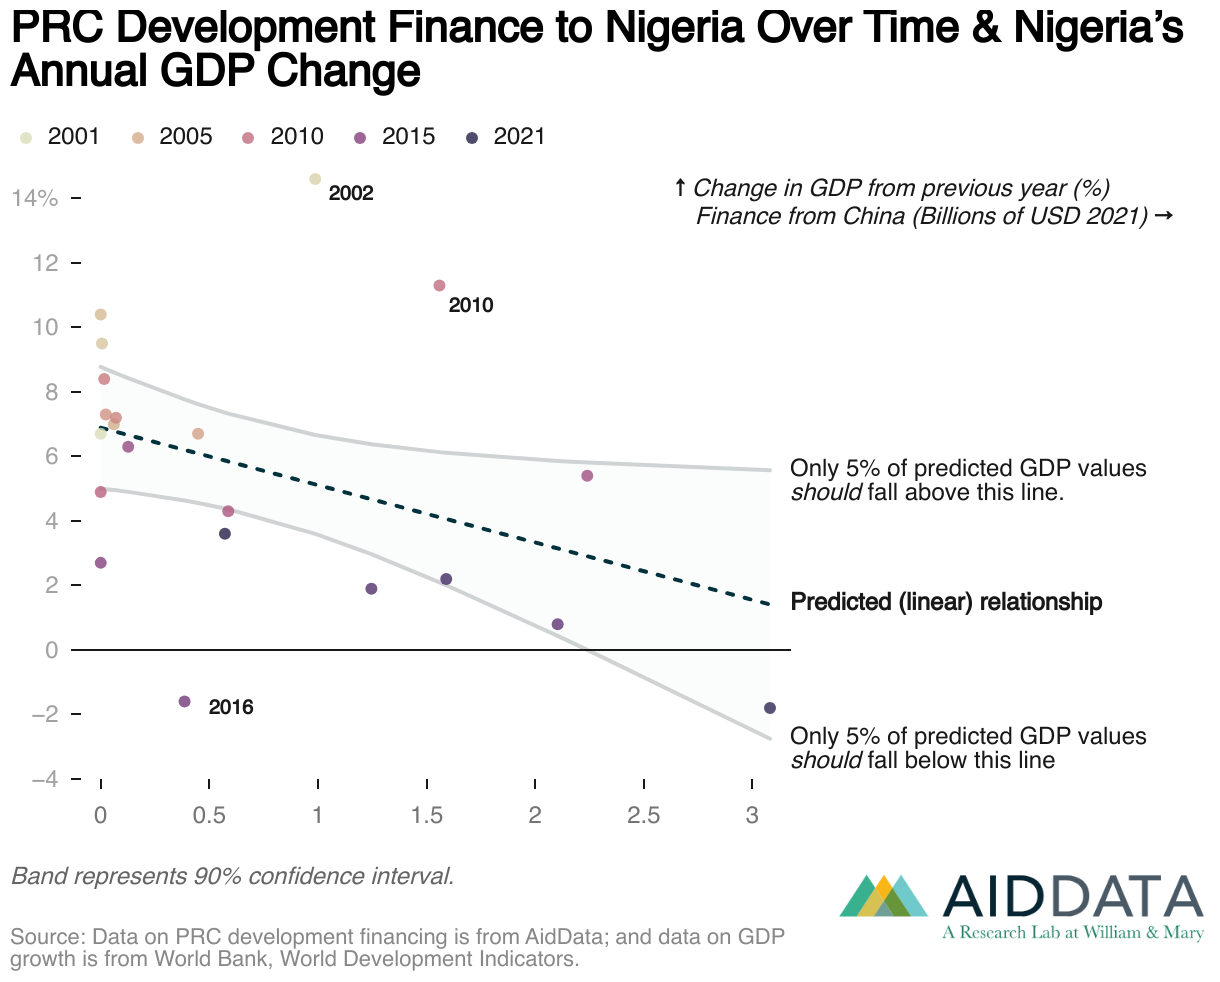
Using a simple regression model to assess the effect of Chinese development finance on Nigeria’s GDP growth, we found that Chinese development finance was negatively correlated with GDP growth (see Figure 28). That is, as development finance investment increased, GDP declined. However, this relationship was not statistically significant. What is evident, nonetheless, is that there is no clear causal relationship through which PRC development finance investments in Nigeria have promoted economic growth.
Policy Options
Nigeria finds itself in a precarious economic situation at present, and it is not clear that interactions with the PRC are helping the country. The data suggests that Chinese development financing either has no impact on GDP growth or could even have a negative impact, though the longer-term implications are difficult to assess. Nigeria has faced a growing trade deficit with the PRC, and the country’s population is also rapidly growing, which implies that GDP growth must reach a higher level to keep up. The opening of the Dangote refinery is a hopeful sign in terms of job creation and reduction in dependence on imports of refined oil. With this increased refining capacity, Nigeria is shifting from being primarily a commodity exporter to becoming an exporter of intermediate and final goods. Oil, however, will not create enough new jobs to meet the needs of the country’s growing population. The PRC’s economic interactions with Nigeria remain focused on this sector, while other industries, such as textiles, have difficulty competing domestically and internationally with the PRC and other countries.
The four major implications of the PRC’s economic slowdown for trade and investment that were presented in chapter 1 will affect Nigeria. First, the PRC’s strong manufacturing base will make it difficult for Nigeria to increase exports to the PRC. The country will have to seek ways to pay for Chinese goods other than balancing trade with the PRC. Second, protectionist efforts by Nigeria to reduce Chinese imports will be somewhat ineffective due to the PRC’s comparative advantage. Reducing the trade imbalance with the PRC will require other means. Third, the PRC’s shift from promoting housing and infrastructure development to technology-intensive industries will reduce demand for oil and increase demand for critical minerals. Nigeria’s trade with the PRC will shift in response to these changes in demand. Fourth, despite the PRC’s economic slowdown, Chinese outbound investment globally will remain relatively consistent due to its importance to the country’s strategic objectives. Given the PRC’s emphasis on critical mineral resources, Chinese development finance to Nigeria might even increase.
To move away from its current level of dependence on the PRC, Nigeria should consider the following policy options:
- Learn from the trade experience of other countries that liberalized trade.A number of commodity exporters have shifted their economies away from dependence on commodities and diversified their trading markets. Learning from the experience of those countries can help Nigeria develop its economy in ways that promote growth and make it more resilient to Chinese influence. The cases of Malaysia in the 1960s and India and Indonesia in the 1980s resemble Nigeria today. These countries were primarily commodity exporters with strict controls over trade. When they reformed policies to liberalize trade, FDI from a range of partners dramatically increased.[78]
- Diversify Nigerian trading markets and reduce debt to the PRC due to trade.Chinese exports to Nigeria far exceed Nigerian exports to the PRC. The implications from chapter 1 suggest that increasing Nigerian exports to the PRC and implementing protectionist policies to reduce Nigerian imports from the PRC will have a limited effect on this trade imbalance. Additional exports of refined oil to the PRC from the Dangote refinery will also not close this gap. To minimize its debt to the PRC, Nigeria should develop a strategy to diversify trading markets to pay for Chinese imports. The strategy would incorporate policies to expand oil and natural gas exports, increase regional trade, and allow the Nigerian currency (naira) to continue tofloat while implementing policies to reduce inflation. Nigeria already has diversified trading partners in petroleum. With greater refining capacity, it could further diversify those markets and increase exports of refined petroleum. Current expansion of its capacity to produce LNG will increase Nigerian exports of LNG to Europe and other markets, generating additional revenue to cover trade with the PRC. Increased trade with its partner countries in the Economic Community of West African States could become another means for Nigeria to promote an overall positive trade balance. Industries such as textiles that might not be competitive in the global market could be competitive in this regional market. The recent policy to let the naira float has led to reduced Chinese exports to Nigeria, which has slowed the growth of debt to the PRC.
- Prepare for rising demand for critical minerals. Due to the rise of technology-intensive industries, a number of countries will seek to import critical minerals from Nigeria. Nigeria needs a comprehensive plan for critical minerals, including an assessment of critical minerals reserves and value, ownership of mineral rights and mining companies, extraction and processing, trade, and governance. Nigeria should review its existing mining policies and regulations, specifically with respect to critical minerals. In preparation for development of the plan, the country should conduct an assessment of foreign engagement in Nigerian critical minerals, including by the PRC. Nigeria could also learn from the experience of other countries with the PRC’s efforts to control the critical minerals industry. The Indonesian strategy shows how even with a ban on exports of raw materials the results of Chinese engagement are mixed. While the PRC’s establishment of nickel processing in Indonesia was positive, the subsequent fall in the price of nickel as a result of overproduction at the Chinese plants counteracted the benefits.
- Review new Chinese development finance and FDI agreements for alignment with Nigerian interests.Based on the implications discussed in chapter 1 and the assessment of the situation in Nigeria in this case study, Chinese development finance and FDI could increase in Nigeria, particularly in critical minerals, even with the PRC’s economic slowdown. Making agreements with the PRC or Chinese companies involves risk. Nigeria can reduce that risk through a review of existing development finance and FDI agreements to develop guidance on what to avoid and how to make these agreements more favorable to Nigerian interests.
Paraguay
One of only two landlocked countries in South America, Paraguay occupies a unique space in the region. With a population of approximately 6.8 million and a projected 2025 GDP of $44.2 billion, it is dwarfed by neighbors like Brazil and Argentina.[79] In the past two decades, Paraguay has experienced consistent economic growth that helped significantly decrease the poverty rate from nearly half the population in 2003 to 17.6% in 2023.[80]
In addition to being geographically landlocked in South America, Paraguay is also diplomatically isolated, surrounded by countries that recognize the PRC over Taipei. As one of only twelve countries worldwide that do not recognize Beijing, and the largest of these countries by landmass, Paraguay faces a unique diplomatic situation. Nonetheless, President Santiago Peña has vowed to maintain its relations with Taiwan.[81] During a diplomatic meeting with Taiwanese president William Lai in November 2024, Foreign Minister Rubén Lezcano reaffirmed that “the relation[ship] between Paraguay and Taiwan is based on principles and values; democracy, freedom, [and] human rights.”[82] The December 2024 expulsion of a low-level PRC diplomat attending a UNESCO meeting in Asunción for allegedly encouraging lawmakers to reconsider ties to Taiwan reinforces this position.[83]
Paraguay’s lack of official recognition of the PRC, however, has not prevented economic engagement between the two countries. In both trade and development finance, the PRC’s presence in the country is evident to varying degrees. Paraguay has received nearly $76.2 million in PRC development finance since 2000,[84] and the PRC is the largest exporter to Paraguay.[85]
Paraguay’s economy has experienced significant fluctuations in recent decades, with periods of steady growth punctuated by contractions during the global financial crisis and domestic economic slowdowns (see Figure 29). The early 2010s saw a particularly sharp spike, followed by volatility in subsequent years. A decline in GDP growth in 2020 in part reflects the negative impact of the Covid-19 pandemic, though 2019 saw negative growth as well. The country’s post-pandemic recovery has similarly been characterized by substantial volatility. After rebounding in 2021, GDP growth subsided in 2022 and picked up again in 2023. The combination of substantial volatility in annual GDP growth rates in the past few decades and the small sample size (approximately 30 years) led to an unstable forecast model. However, this in itself is still informative in the sense that the volatile projection highlights the challenges Paraguay faces in achieving long-term economic stability amid external pressures and structural constraints.
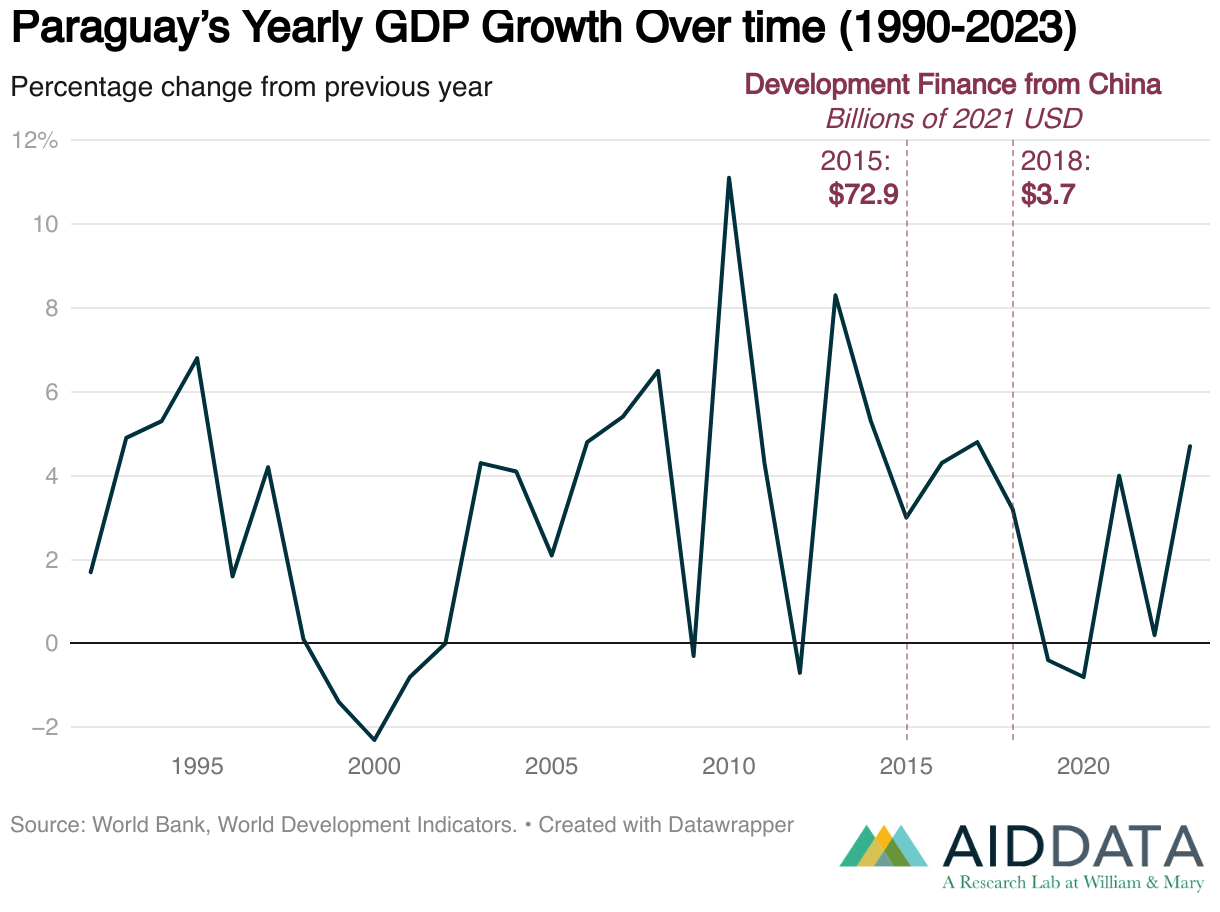
For the remainder of the case study, we examine two major economic channels linking the PRC to Paraguay: trade and development finance. While FDI also plays a role in Paraguay’s economy, it remains significantly lower than in other regional countries like Brazil.[86] As a result of that reality, as well as data limitations, our analysis focuses on trade and development finance as key mechanisms of economic engagement between Paraguay and the PRC.
The PRC’s Trade with Paraguay
Paraguay’s top trading partners are a hodgepodge of global and regional powers in the Americas, Europe, and Asia.[87] Although regional neighbors Brazil, Argentina, and the United States are top partners, Paraguay imports the most from the PRC, which accounts for around 30% of its total share.[88]Figure 30 illustrates the full trade relationship between Paraguay and the PRC. While the level of imports from Paraguay remains low throughout the sample, Chinese exports to Paraguay have grown significantly since the mid-2000s and continued to rise, with 2010 and 2021 being banner years in the overall trade relationship.
Paraguay relies heavily on imported machinery and electronics to sustain its agriculture-based economy, with the PRC serving as a key supplier (see Table 5). As of 2024, Paraguay is the world’s largest exporter of organic sugar, third-largest soy exporter, and eighth-largest beef exporter.[89] Given this dependence on food exports, its top imports from the PRC are machinery and electronics, which support agricultural production.
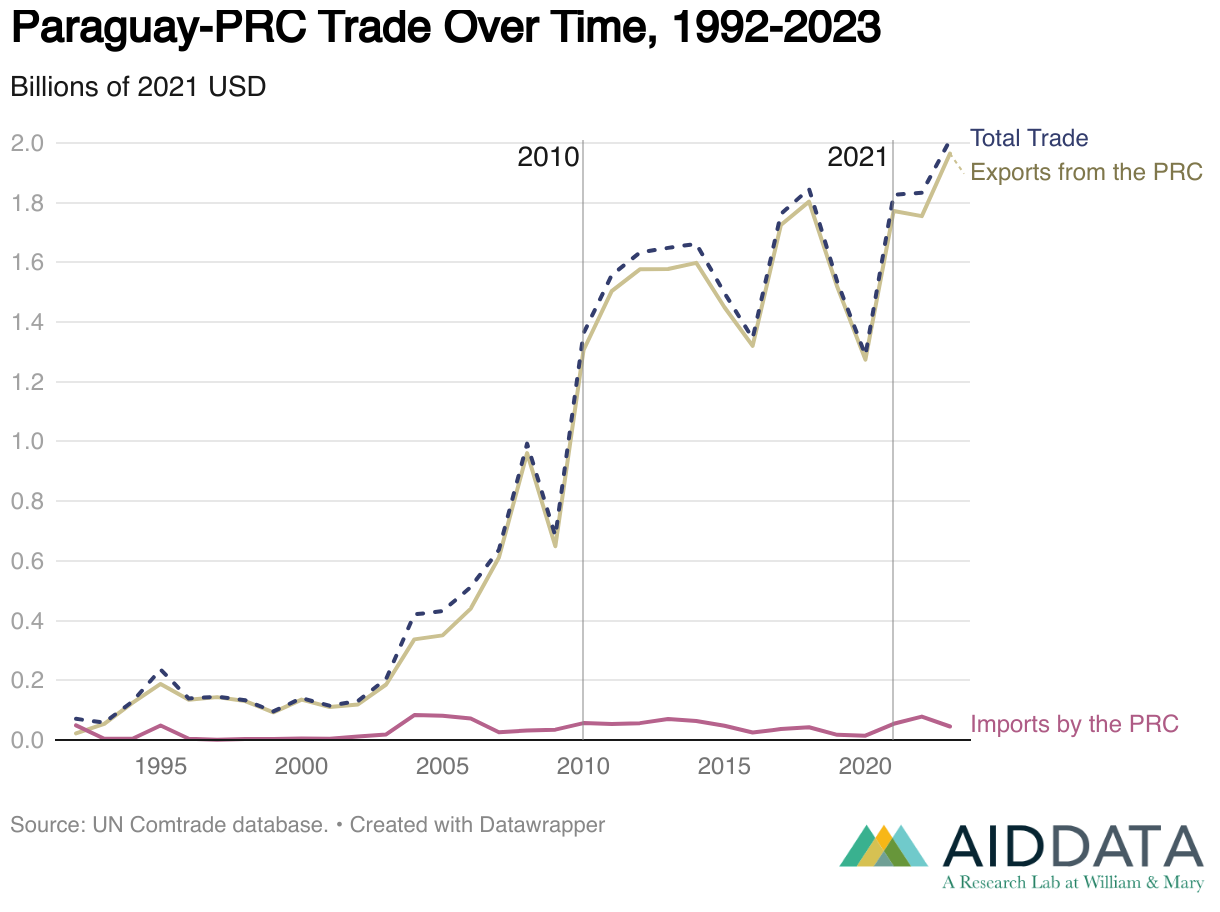
Table 5
Top Paraguay-PRC sectors and stages by trade flow
“Exports” refers to PRC exports to Paraguay. “Imports” refers to PRC imports from Paraguay.
1992-2022 (Cumulative)
| Trade Flow | Top Stage | Top Sectors |
|---|---|---|
| Total Trade | Capital goods |
|
| Exports | Capital goods |
|
| Imports | Raw materials |
|
2010
| Trade Flow | Top Stage | Top Sectors |
|---|---|---|
| Total Trade | Capital goods |
|
| Exports | Capital goods |
|
| Imports | Intermediate goods |
|
2021
| Trade Flow | Top Stage | Top Sectors |
|---|---|---|
| Total Trade | Capital goods |
|
| Exports | Capital goods |
|
| Imports | Intermediate goods |
|
Source: World Integrated Trade Solution (WITS) database.
Note: Imports refers to PRC imports from Paraguay, and exports refer to PRC exports to Paraguay. Stage refers to stages of production (capital goods, consumer goods, intermediate goods, or raw materials), and sector refers to the specific sector of the product.
As the PRC is expected to remain highly competitive in manufacturing (see chapter 1), and considering that the Paraguayan economy relies on mostly imports of agricultural machinery from the PRC, Paraguay would be relatively unaffected by the direct shocks of lower demand from a Chinese economic slowdown. Nevertheless, the potential indirect impact is significant, given that its main trading partner—Brazil—is more vulnerable to a PRC slowdown, as discussed in the Brazil case study.
The PRC’s Development Finance in Paraguay
Unlike nations that recognize the PRC and receive direct development financing, Paraguay’s engagement has largely occurred through indirect channels through ports in Uruguay and Argentina.[90] Surprisingly, there are still several PRC development finance projects in Paraguay (see Figure 29). These investments totaling $76.2 occurred in 2015 and 2018 and have primarily been in two sectors: (1) industry, mining, and construction, and (2) transport and storage.[91] All four projects were committed during former president Horacio Cartes’s administration and are co-financed through the Inter-American Development Bank with the China Co-financing Fund for Latin America and the Caribbean as one of the implementing agencies.
Policy Options
Paraguay’s minimal economic ties to the PRC limit its exposure to the ripple effects of a Chinese economic slowdown. The choice to maintain recognition of Taiwan, even while the vast majority of Latin American and Caribbean countries recognize the PRC, largely insulates Paraguay from a negative economic shock, which is a significant benefit of its diplomatic stance. Other countries across both the global South and North have taken steps to reduce their reliance on the PRC. One example is the Supply Chain Resilience Initiative, which is a partnership between India, Japan, and Australia aimed at addressing vulnerabilities caused by overdependence on the PRC in global supply chains. Paraguay has largely avoided the need to take these measures. While by percentage its main source of imports is the PRC, the overall volume is relatively small, making these goods more easily substitutable.
As noted above, the indirect impact of a slowdown in the Chinese economy is a more significant concern. Given Brazil’s deep trade relationship with the PRC, any contraction in Chinese demand could weaken the Brazilian economy. This not only would reduce its demand for Paraguayan exports like soy and beef but could lower the prices of those commodities, since they are also the main exports from Brazil. The vulnerabilities of its neighbor, therefore, pose a greater risk for Paraguay, due to the close economic ties between the two countries. To mitigate the indirect threat of a Chinese economic slowdown, Paraguay should consider the following policy options:
- Diversify trade beyond Brazil and Argentina.Paraguay should expand trade partnerships with other regional and global markets, moving beyond its neighbors and main trade partners Brazil and Argentina, which are still substantially vulnerable to the Chinese economy. Strengthening export agreements and seeking new buyers for key agricultural products would help insulate the country’s economy from downturns in trade between the PRC and Paraguay’s main trade partners.
- Strengthen agro-industrial integration.Paraguay should promote vertical integration and value creation for agricultural products that it already exports, such as soybeans and corn. Moving exports away from raw products and toward higher-value-derived products can have multiple benefits, including higher value addition and increased revenues from exports, job creation, and reduced dependence on raw commodity prices.
[1] In 2023, at a BRICS conference in Johannesburg, Brazilian president Luiz Inácio Lula da Silva called for the BRICS nations to consider a common currency to shield them from fluctuations in the U.S. dollar. See Rachel Savage, “Explainer: What Is a BRICS Currency and Is the U.S. Dollar in Trouble?” Reuters, August 24, 2023, https://www.reuters.com/markets/currencies/what-is-brics-currency-is-us-dollar-
trouble-2024-12-17. While no serious plans are in place, this proposal reflects the group’s growing unease with their economies’ dependence on the U.S. dollar. The BRICS originally comprised Brazil, Russia, India, China, and South Africa, but the grouping has expanded to include Egypt, Ethiopia, Indonesia, Iran, and the United Arab Emirates.
[2] World Bank, World Development Indicators, https://databank.worldbank.org/source/world-development-indicators.
[3] Ibid. The Brazilian government predicts a 2.5% increase in GDP for 2025. “Brazil’s Government Forecasts 2.6% GDP Growth in 2025, Inflation to Hit 3.3%,” Ayres. M, August 30, 2024, https://www.reuters.com/world/americas/brazils-government-forecasts-26-gdp-growth-2025-inflation-hit-33-2024-08-31. The population should continue to rise until at least 2040. See Luiz Bello, “Brazil’s Population Will Stop Growing in 2041,” Agência de Notícias IBGE, August 22, 2024, https://agenciadenoticias.ibge.gov.br/en/agencia-news/2184-news-agency/news/41065-populacao-do-pais-vai-parar-de-crescer-em-2041.
[4] The Human Development Index measures a country’s overall development by examining life expectancy at birth, mean years of schooling, expected years of schooling, and gross national income per capita. UN Development Programme, Human Development Report 2023–24: Breaking the Gridlock—Reimagining Cooperation in a Polarized World (New York: UNDP, 2024), https://hdr.undp.org/system/files/documents/global-report-document/hdr2023-24reporten.pdf.
[5] Thomas J. Shattuck, “The Race to Zero?: China’s Poaching of Taiwan’s Diplomatic Allies,” Orbis 64, no. 2 (2020): 337.
[6] Rhys Jenkins, “China and Brazil: Economic Impacts of a Growing Relationship,” Journal of Current Chinese Affairs 41, no. 1 (2012): 22.
[7] Harold Trinkunas argues that the BRICS essentially formalized the already existing cooperation between Brazil and China. See Harold Trinkunas, “Testing the Limits of China and Brazil’s Partnership,” Brookings Institution, July 20, 2020, https://www.brookings.edu/articles/ testing-the-limits-of-china-and-brazils-partnership.
[8] Celso Amorim, President Lula’s special presidential adviser on international affairs, told media that Brazil wishes to strengthen its economic relationship with China but is more interested in “synergies” than signing a sweeping agreement. Cobus van Staden, “Brazil’s BRI Rejection a Setback for China,” China-Global South Project, October 30, 2024, https://chinaglobalsouth.com/2024/10/30/brazils-bri-rejection-a- setback-for-china.
[9] Jorge Heine, “Brazil’s Non-Signing on to China’s BRI: Much Ado About Nothing?” China-Global South Project, November 11, 2024, https:// chinaglobalsouth.com/analysis/brazils-non-signing-on-to-chinas-bri-much-ado-about-nothing.
[10] Our calculations use a post-estimation impulse response function to project, based on AidData’s model, that a two-period shock would occur following a PRC economic slowdown, with stabilization beginning in the third year.
[11] Tulio Cariello, “Chinese Investments in Brazil 2023: New Trends in Green Energy and Sustainable Partnerships,” China-Brazil Business Council, 2024, https://www.cebc.org.br/download/14517/?tmstv=1733322992.
[12]UN Comtrade database, https://comtradeplus.un.org; and World Integrated Trade Solution (WITS) database, https://wits.worldbank.org.
[13] Observatory of Economic Complexity (OEC), “Brazil,” https://oec.world/en/profile/country/bra.
[14]WITS database.
[15]We selected the years 2010 and 2021 for two reasons: first, they are two of the four banner years in Figure 2 and bookend this set of years; second, they illustrate how the top sectors evolved over a decade of rapid expansion in trade relations.
[16]In 2023, Brazil was the world’s second-largest exporter of iron ore, shipping approximately $34 billion worth of the material. China alone imported $20.6 billion from Brazil that same year. OEC, “Brazil.”
[17] Samantha Custer et al., “Tracking Chinese Development Finance: An Application of AidData’s TUFF 3.0 Methodology,” AidData, William & Mary, 2023, https://www.aiddata.org/data/aiddatas-global-chinese-development-finance-dataset-version-3-0; and Axel Dreher, Banking on Beijing: The Aims and Impacts of China’s Overseas Development Program (Cambridge: Cambridge University Press, 2022).
[18] We consider two types of PRC state-directed development finance: official development assistance (ODA), which are grants and no- or low- interest loans; and other official flows (OOF), which are loans and other debt instruments approaching market rates. A vague category exists when the data generators cannot clearly differentiate between ODA and OOF.
[19]Custer et al., “Tracking Chinese Development Finance.”
[20] Ibid. Values for specific projects are in 2021 constant U.S. dollars.
[21] Ibid.
[22] Custer et al., “Tracking Chinese Development Finance.”
[23] Ibid. CTG Brazil is a subsidiary of China Three Gorges Corporation.
[24] Ibid.
[25] Custer et al., “Tracking Chinese Development Finance.”
[26] Chapter 1 of this report details the factors contributing to the PRC’s debt-to-GDP buildup and Beijing’s subsequent efforts to stem it.
[27]“China’s HNA Group to Buy 23.7% in Azul Brazilian Airlines for $450 Million,” Reuters, November 24, 2025, https://www.reuters.com/ article/business/environment/chinas-hna-group-to-buy-237-pct-in-azul-brazilian-airlines-for-450-mln-idUSB9N13E007; and “China’s HNA Buys Odebrecht Stake in Rio Airport for $19 Million,” Reuters, July 13, 2017, https://www.reuters.com/article/world/americas/chinas- hna-buys-odebrecht-stake-in-rio-airport-for-19-million-idUSKBN19Y2LH.
[28]“HNA Group Trims Debt Nearly 11 Pct, or $11.6 Bln, in First Half,” Reuters, September 1, 2018, https://www.reuters.com/article/us-china- hna-debt/hna-group-trims-debt-nearly-11-percent-or-11-6-billion-in-first-half-idUSKCN1LH36A.
[29]“Hainan Airlines Sells Remaining Stake in Brazil’s Azul for $306 million,” Reuters, August 10, 2018, https://www.reuters.com/article/us- hainan-airlines-azul-stake/hainan-airlines-sells-remaining-stake-in-brazils-azul-for-306-million-idUSKBN1KV0UX.
[30]“China’s BYD Starts Construction on Manufacturing Complex in Brazil,” Reuters, March 6, 2024, https://www.reuters.com/business/autos- transportation/chinas-byd-starts-construction-manufacturing-complex-brazil-2024-03-06; and Annabelle Liang, “Brazil Shuts BYD Factory Site over ‘Slavery’ Conditions,” BBC News, December 15, 2024, https://www.bbc.com/news/articles/c8xj9jp57r2o.
[31]Naiara Galarraga Gortázar, “BYD in Brazil: From the Company’s Triumphant Arrival to a Scandal Involving ‘Slavery-Like’ Working Conditions,” El País (English edition), January 11, 2025, https://english.elpais.com/international/2025-01-11/byd-in-brazil-from-the- companys-triumphant-arrival-to-a-scandal-involving-slavery-like-working-conditions.html.
[32] World Bank, World Development Indicators, https://data.worldbank.org/indicator/SP.POP.TOTL.
[33] The 2021 FDI statistic from Deutsche Bundesbank (2024) of 99.4 billion euros was converted to U.S. dollars with the average 2021 exchange rate from the European Central Bank.
[34] In 2023 the population of China was 1.4 billion, whereas the population of Germany was only 83.8 million.
[35] Sebastian Biba, “Germany’s Triangular Relations with the United States and China in the Era of the Zeitenwende,” German Politics 33, no. 3 (2024): 435–62.
[36]Andreas Baur and Lisandra Flach, “Zeitenwende in German-Chinese Trade Relations? Evidence from German Firms,” ifo Institute, EconPol Policy Brief, no. 57, April 2024. https://www.ifo.de/en/econpol/publications/2024/working-paper/zeitenwende-german-chinese-trade- relations-evidence-german-firm.
[37] See, for example, Kirsty Huges, “European Politics and the Euro Crisis: Ten Failures,” Friends of Europe, Policy Paper, November 2011, https://www.friendsofeurope.org/wp/wp-content/uploads/2019/07/European-Politics-and-the-Euro-Crisis-Ten-Failures.pdf.
[38] See, for example, Maria Martinez, “Germany in Deep Economic Crisis, BDI Industrial Lobby Group Says,” Reuters, January 28, 2025, https://www.reuters.com/markets/europe/germany-is-deep-economic-crisis-says-bdi-industrial-lobby-2025-01-28; and Jumana Saleheen, “Germany’s Economic Woes Beyond the Energy Crisis,” Vanguard, December 24, 2024, https://corporate.vanguard.com/content/ corporatesite/us/en/corp/vemo/germany-economic-woes-go-beyond-energy-crisis.html.
[39] In addition to Germany’s GDP growth, our vector autoregressive model incorporates data on the PRC’s GDP growth, interest rates, inflation, and shocks due to tariffs and the Covid-19 pandemic. Achim Truger, “Austerity in the Euro Area: The Sad State of Economic Policy in Germany and the EU,” European Journal of Economics and Economic Policies: Intervention 10, no. 2 (2013): 158–74.
[40]WITS database.
[41]“German Carmakers Most Exposed to Chinese Counter-Tariffs,” Reuters, June 13, 2024, https://www.reuters.com/business/autos- transportation/european-carmakers-exposed-any-chinese-retaliation-eu-tariffs-2024-06-13; and “Share of Adidas Retail Sales by Region Worldwide in 2024,” Statista, https://www.statista.com/statistics/531733/share-of-adidas-retail-sales-by-region.
[42]In foreign portfolio investment the investor invests in a portfolio of stocks, bonds, and other securities without having a role in the management of the foreign businesses in the portfolio.
[43]Deutsche Bundesbank database, available at https://www.bundesbank.de/dynamic/action/en/statistics/time-series-databases/time-series-databases/745582/745582?listId=www_sesbop_aw3_2_2c1 &dateSelect=2022.
[44] To simplify the discussion here and below, the term FDI refers to FDI and FPI combined.
[45] Cora Jungbluth, “Profits of German Investors in China—a First Empirical Stocktaking,” Bertelsmann Stiftung, 2023, https://www. bertelsmann-stiftung.de/en/publications/publication/did/profits-of-german-investors-in-china-a-first-empirical-stocktaking.
[46] The stock of FDI could also be seen as a measure of the potential effect on GDP, but this assumes that those holding on to the investment will participate in corporate decision-making in a manner to influence the profitability of the investment. Instead, the change in the stock reflects the change (increase or decrease) in the working capital for the company receiving the investment, which can directly contribute to the success of the business.
[47]Baur and Flach, “Zeitenwende in German-Chinese Trade Relations?”
[48] “Indonesia and China: How Trade Became a Path to Poverty Reduction,” Center for Indonesian Policy Studies, February 10, 2025, https:// www.cips-indonesia.org/post/indonesia-and-china-how-trade-became-a-path-to-poverty-reduction.
[49]Rizal Sukma, “Indonesia-China Relations: The Politics of Re-engagement,” Asian Survey 49, no. 4 (2009): 591–608.
[50] This excludes Hong Kong. See BPS-Statistics Indonesia, “Investment Realization Foreign Investment by Country (Million US$), 2024,” https://www.bps.go.id/en/statistics-table/2/MTg0MyMy/realisasi-investasi-penanaman-modal-luar-negeri-menurut-negara.html.
[51] UN Comtrade database.
[52]OEC, “Indonesia,” https://oec.world/en/profile/country/idn.
[53] WITS database.
[54] Gracelin Baskaran, “Diversifying Investment in Indonesia’s Mining Sector,” Center for Strategic and International Studies, July 11, 2024, https://www.csis.org/analysis/diversifying-investment-indonesias-mining-sector
[55]OEC, “Indonesia.”
[56]OEC, “Indonesia.”
[57] UN Comtrade database.
[58] These years have been selected for two reasons: first, they are two of the banner years identified in Figure 17 and bookend this set of years; second, they illustrate how the top sectors evolved over a decade of rapid expansion in Indonesia-PRC trade relations.
[59] International Monetary Fund, “Indonesia: Selected Issues,” IMF Staff Country Report, August 7, 2024.
[60]Custer et al., “Tracking Chinese Development Finance.”
[61]Ibid.
[62]Bradley C. Parks et al., “Belt and Road Reboot: Beijing’s Bid to De-risk Its Global Infrastructure Initiative,” AidData, William & Mary, November 2023, https://www.aiddata.org/publications/belt-and-road-reboot.
[63] Custer et al., “Tracking Chinese Development Finance.”
[64]These are copper, cobalt, nickel, lithium, and rare earth element extraction and processing. Katherine Walsh et al. “Tracking China’s Transition Mineral Financing: Methodology and Approach, Version 1.0,” AidData, William & Mary, February 2025, https://www.aiddata. org/publications/tracking-chinas-transition-mineral-financing-methodology-and-approach-version-1-0.
[65] Custer et al., “Tracking Chinese Development Finance.”
[66] Ibid.
[67]Jaewon Chung, “The Mineral Industry of Indonesia,” in “Minerals Yearbook 2020–2021: Indonesia,” U.S. Geological Survey, January 2025, https://pubs.usgs.gov/myb/vol3/2020-21/myb3-2020-21-indonesia.pdf.
[68]Eugene N. Nweke and Emmanuel Obona Elem, “Oil Wealth Dependence and Poverty in Nigeria,” South East Political Science Review 1, no. 1 (2017): 37–48; and Eric Kehinde Ogunleye, “Natural Resource Abundance in Nigeria: From Dependence to Development,” Resources Policy 33, no. 3 (2008): 168–74.
[69]Nafi Chinery and Tengi George-Ikoli, “Ending Nigeria’s Oil Dependency: Not If, but When…and How,” Natural Resource Governance Institute, March 2022, https://resourcegovernance.org/articles/ending-nigerias-oil-dependency-not-if-whenand-how.
[70]Kelly Norways, “Refiners Brace for Margin Pain as Nigeria’s Dangote Refinery Scales Up,” S&P Global, November 22, 2024, https://www. spglobal.com/commodity-insights/en/news-research/latest-news/crude-oil/112224-feature-refiners-brace-for-margin-pain-as-nigerias- dangote-refinery-scales-up.
[71]World Bank, World Development Indicators, https://data.worldbank.org/indicator/SP.POP.TOTL.
[72]Steven F. Jackson, “Two Distant Giants: China and Nigeria Perceive Each Other,” Journal of European, Middle Eastern, and African Affairs 1, no. 32 (2019): 40–74, https://www.airuniversity.af.edu/portals/10/jemeaa/journals/volume-01_issue-2/jemeaa_01_2_jackson.pdf.
[73]Felix Onuah and Liz Lee, “China Pledges to Encourage Investment in Nigeria,” Reuters, September 3, 2024, https://www.reuters.com/world/ nigeria-china-sign-economic-nuclear-energy-pact-2024-09-03.
[74] Chijioke Ohuocha and Ulf Laessing, “Nigeria’s Economy Shrinks in 2016 for First Time in 25 Years,” Reuters, February 28, 2017, https:// www.reuters.com/article/business/finance/nigerias-economy-shrinks-in-2016-for-first-time-in-25-years-idUSKBN1670U6.
[75]Ruth Maclean and Ismail Auwal, “Nigeria Confronts Its Worst Economic Crisis in a Generation,” New York Times, June 11, 2024, https:// www.nytimes.com/2024/06/11/world/africa/nigeria-economy-strike.html.
[76]OEC, “Nigeria,” https://oec.world/en/profile/country/nga.
[77]Ole Hansen, “Chinese Economic Woes Drag Down Crude Oil and Copper,” Saxo, September 3, 2024, https://www.home.saxo/content/ articles/commodities/chinese-economic-woes-drag-down-crude-oil-and-copper-03092024.
[78]Jiaxiong Yao and Yang Liu, “Nigeria: Selected Issues—Diversification of Nigerian Economy,” IMF Country Reports, February 8, 2021, 16–37, https://www.elibrary.imf.org/view/journals/002/2021/034/002.2021.issue-034-en.xml?rskey=d5YE7Q&result=8.
[79] World Bank, World Development Indicators.
[80] Ibid.
[81] “New Paraguay President Stresses South American Country’s Ties with Taiwan at Swearing-In Ceremony,” Associated Press, August 15, 2023, https://apnews.com/article/paraguay-taiwan-pena-lai-f9ee99e365bff96d6efe543bb4bd1db0.
[82]Firstpost, “Paraguay Deports Chinese Envoy over ‘Taiwan’ and ‘Interference,’” YouTube, video, December 6, 2024, https://www.youtube. com/watch?v=B_guslO_G7U.
[83]Daniela Desantis, “Paraguay Expels Chinese Envoy over Taiwan ‘Interference,’” Reuters, December 6, 2024, https://www.reuters.com/world/ americas/paraguay-expels-chinese-envoy-over-interference-domestic-affairs-2024-12-05.
[84] Custer et al., “Tracking Chinese Development Finance.”
[85] UN Comtrade database.
[86] In 2023, Paraguay recorded $240.7 million in FDI inflows, compared with Brazil’s $64.23 billion. World Bank, World Development Indicators.
[87] According to the WITS database, as of 2022, its top five export partners are Brazil, Argentina, Chile, Russia, and the United States. Its top five import partners are the PRC, Brazil, the United States, Argentina, and Singapore.
[88] WITS database.
[89] U.S. International Trade Administration, “Paraguay: Agricultural Sectors,” March 5, 2024, https://www.trade.gov/country-commercial- guides/paraguay-agricultural-sectors.
[90] Gabriel Cohen, “The South American Election That Has Taiwan Scrambling,” Diplomat, January 18, 2023, https://thediplomat.com/2023/01/ the-south-american-election-that-has-taiwan-scrambling.
[91] Custer et al., “Tracking Chinese Development Finance.”