Standing Firm? Measuring Resilience to Malign Foreign Influence in European & Eurasian Media
Vera Choo and Jonathan A. Solis
May 2023
[Skip to Table of Contents] [Skip to Chapter 1]Executive Summary
In order to address a gap in the literature on media resilience in developing countries, AidData, in partnership with USAID, developed a taxonomy and index to quantify media resilience in 17 European & Eurasian countries from 2010 to 2020. Countries include Albania, Armenia, Azerbaijan, Belarus, Bosnia and Herzegovina, Georgia, Kazakhstan, Kosovo, the Kyrgyz Republic, Moldova, Montenegro, North Macedonia, Serbia, Tajikistan, Turkmenistan, Ukraine, and Uzbekistan. These countries are consequential battlegrounds for influence [1] in that they share a communist history [2] and none are currently members of the European Union. Capturing both an aggregate metric of media resilience, along with some disaggregation, will help USAID and others identify particular strengths and weaknesses within different facets of a country’s media system that may help or hinder its ability to withstand (and manage) external malign influence. Disaggregation could also help inform in-country programming to strengthen media resilience, by identifying weaknesses.
The authors define media resilience as the extent to which a country’s consumers and producers of media are able to responsibly identify and respond to externally influenced content. In other words, a media system’s resilience is measured by how it manages its response to externally influenced narratives in the media. The Media Resilience to Malign Influence (MRMI) index features an overall score and scores of its constituent parts that correspond with three components of media resilience: content consumers, content producers, and the institutional environment in which they exist. The dataset allows analysts and policy makers the ability to see developments and changes in media resilience over time.
Key Features of the Dataset
- An overall index score and disaggregated scores for three subcomponents of the index: (i) Content Consumers, (ii) Content Producers, and (iii) the Institutional Environment.
- An index featuring 54 unique indicators with yearly coverage for the period 2010-2020.
- Measures on a 0 (lower resilience) to 100 (higher resilience) continuum.
Key Findings
- Uzbekistan has made the greatest strides: it scored the second lowest in media resilience among countries in 2010, before jumping to middle of the pack by 2020.
- Armenia also has made impressive gains: it scored among the low end of countries in 2010 but garnered the highest MRMI score by 2020.
- Serbia saw the greatest decline over the decade, with a nine-point drop from 2010 to 2020.
- The greatest impediment to resilience against malign foreign influence across countries is the institutional environment in which these media systems operate.
- In more authoritarian regimes like Belarus, Kazakhstan, Uzbekistan, and Turkmenistan, what resilience these media systems do possess seems to come from the citizens themselves.
Key Takeaways
- Media resilience is generally increasing across the region.
- Media-savvy citizens can be a gateway to increases in resilience, even in autocracies.
- There is no one silver bullet when it comes to overall resilience: the relative strength of different components of media systems varies by country.
2. Conceptualizing Media Resilience
1.1 Media Resilience to Malign Influence (MRMI) Index
3. Operationalizing Media Resilience
4. Quantifying Media Resilience
4.2 An 11-Year Snapshot of Media Resilience
4.3 Unpacking the Strengths and Weaknesses of a Country’s Media System
4.4 Examining the Trajectory of Media Resilience Over Time
4.5 Year-on-Year Trends in E&E Resilience to Malign Influence
Takeaway #1: Media resilience is generally increasing across the region
Takeaway #2: Media-savvy citizens can facilitate increases in resilience, even in autocracies
2. Index Variables and Dataset Completeness
3. Completeness by Various Dataset Attributes
5. MRMI Index by World Bank Income Classification
6. MRMI Index Components and Typical Change
7. MRMI Index Snapshots and Change Over Time by Component
8. Detailed Description of Variables Used in Index
Acknowledgements
The authors would like to thank Samantha Custer, Emily Dumont, Lincoln Zaleski, Rodney Knight, and various USAID personnel for their contributions and feedback throughout the writing of this report. John Custer, Parker Kim, and Sarina Patterson contributed editing, formatting, and supporting visuals. The authors would also like to thank Kritika Jothishankar for excellent research assistance. This research was made possible with funding from the Europe & Eurasia (E&E) Bureau through a USAID/DDI/ITR Higher Education Solutions Network (HESN) cooperative agreement (AID-A-12-00096). The findings and conclusions of this country report are those of the authors alone and do not necessarily reflect the views of our funders and partners.
Citation
Choo, V. and Solis, J. (2023). Standing Firm? Measuring Resilience to Malign Foreign Influence in European & Eurasian Media. Williamsburg, VA: AidData at William and Mary.
1. Introduction
A strong and independent media bolsters democracy and increases government accountability to citizens, civil society, and other stakeholders. In practice, this requires that journalists and media outlets have the freedom and capacity to report effectively without fear of censorship or reprisal. However, the openness of media systems creates unanticipated challenges, as countries must mitigate their increasing vulnerability to political capture, malign influence, and a global trend of "waning information integrity" (Ravitsky, 2018). As a case in point, authoritarian regimes like Russia and China may target open media systems to promote pro-Kremlin or pro-China views precisely because they are free and open (Walker, 2018; DiResta et al., 2019).
External actors use diverse methods to influence reporting in target countries. These may include securing ownership stakes or joint content development deals with domestic media outlets, facilitating exchanges and training for individual journalists, or expanding their international broadcasting efforts. As part of a broader project with USAID’s Europe & Eurasia (E&E) Bureau, [3] AidData (a research lab at William & Mary’s Global Research Institute) developed a suite of data and analysis to help policymakers, funders, and scholars better understand the mechanisms through which external actors affect the domestic media landscape, the intensity of these efforts, and the resilience of countries to this influence throughout the region.
In this technical report, we debut a new media resilience index developed to quantify and monitor the ability of E&E countries to responsibly manage external influence in their media markets. The index, titled Media Resilience to Malign Influence (MRMI), has been designed to enable USAID and others to assess changes in media resilience in a single country over time, as well as comparatively vis-à-vis others in the region.
This version was developed for 17 E&E countries over the period of 2010-2020, but with the ability to seamlessly scale to additional countries, regions, and years in future. The 17 countries include: Albania, Armenia, Azerbaijan, Belarus, Bosnia and Herzegovina, Georgia, Kazakhstan, the Kyrgyz Republic, Kosovo, Moldova, Montenegro, North Macedonia, Serbia, Tajikistan, Turkmenistan, Ukraine, and Uzbekistan. These countries are consequential battlegrounds for influence [4] in that they share a communist history [5] and none are currently members of the European Union.
By focusing on the malign influence of actors beyond a country’s borders, the MRMI Index differs from more traditional datasets that quantify media freedom. As Whitten-Woodring and Van Belle (2017) argue, a country has a free media when its journalists are able to criticize the government openly. Freedom House’s Freedom of the Press Index also considers three domestic factors in its index: the legal, political, and economic conditions in a country (Freedom House, 2018). While external actors may play a role to some extent, media freedom as a concept remains centered on journalists, outlets, and institutions in the country. Media freedom is also closely associated with mass democracy within a country (Stier, 2015). Another distinction is that media freedom is usually seen as government infringement on media, though other powerful interests like criminal gangs, terrorist groups, or business interests can also have substantial effects. However, malign foreign influence, as we conceptualize it, includes a component of manipulation that does not necessarily violate civil liberties but still compromises the well-being of a media system.
In this technical report, we present results from the construction and application of the MRMI Index to 17 E&E countries for the period of 2010-2020, including a brief description of the theory, data, and methods for producing these results. Our intention is to highlight key findings while exhibiting the dataset’s capabilities. We invite analysts and policy makers to analyze the full range of figures and tables in the Appendix or to delve into the dataset for results on specific countries. Though created with the E&E region in mind, the report also intends to stimulate conversation with, and feedback from, US government (USG) stakeholders and analysts, as these approaches may be scaled to additional countries and regions in the future.
The report first lays out how we define and conceptualize media resilience. This allows us to orient and guide our data collection efforts. The next section details our media resilience taxonomy, the data we collected based on the taxonomy, and how we constructed the index. Finally, we provide the highlights of key findings, results, and takeaways before concluding the report.
2. Conceptualizing Media Resilience
What does it mean to be resilient? Resilience as a concept exists in a number of disciplines and areas of study. It typically refers to the process through which a complex system persists by dealing with internal and external change. For example, resilience encompasses the ability to create stability in the face of high-risk environments (Bernard, 2004), the capacity to absorb or resist disturbance (Folke et al., 2010, p. 1), as well as the aptitude to reorganize and return to equilibrium ( Holling, 1996, pp. 32-3 3). In this respect, being resilient does not require avoiding risk, but rather having the ability to adapt and evolve in response to it. In the remainder of this section, we apply this understanding of resilience to how we think about the ability of a country’s media system to be resilient in the face of malign foreign influence.
1.1 Media Resilience to Malign Influence (MRMI) Index
In the context of the Media Resilience to Malign Influence (MRMI) index, we define media resilience as the extent to which a country’s consumers and producers of media are able to responsibly identify and respond to externally influenced content. In other words, a media system’s resilience is measured by how it manages its response to externally influenced narratives in the media. In this respect, we see the MRMI Index providing an important value addition alongside traditional media freedom measures which focus primarily on domestic rather than external threats.
The extent to which a country’s media system is able to withstand malign influence (in the form of media capture or disinformation) [6] is a function of supply (journalists and media firms that produce media content) and demand (citizens that consume this content), mediated by the broader institutional and societal environment. Therefore, we envision a resilient media system as one in which the government, citizens, and media firms and journalists alike are invested in keeping information flows healthy and vibrant. [7] We also recognize that shocks to the media system (e.g., wars, natural disasters, terrorist attacks, public health crises, and cyberattacks) could affect a country’s ability to remain resilient against media capture and disinformation.
Now that we have laid out the parameters for how we conceptualize media resilience, we next turn to how we operationalize these concepts into measurable indicators to construct the MRMI Index in practice for 17 E&E countries for the period of 2010-2020.
3. Operationalizing Media Resilience
A fundamental premise of the MRMI Index is that media resilience is best measured along a continuum rather than as a binary condition (i.e., resilient versus not resilient). This is particularly important in capturing subtle shifts, as media systems may see their resilience to foreign influence improve or degrade over time in response to domestic conditions or external threats. With this in mind, in the MRMI Index we employ a continuum of 0 (least resilient) to 100 (most resilient) to indicate the vulnerability of a country’s media system to foreign media capture and disinformation.
Moreover, we recognize that there are multiple factors that may contribute to the resilience of a country’s media system. Therefore, it is important to capture both an aggregate metric of resilience overall, along with some disaggregation to help USAID and other actors identify particular strengths and weaknesses within different facets of a country’s media system that may help or hinder its ability to withstand and manage external malign influence. Disaggregation could also help inform in-country programming to strengthen media resilience, by identifying weaknesses.
In this section, we briefly describe how we operationalize measuring media resilience, from concepts and indicators to data and methods, to produce the MRMI Index.
3.1 Taxonomy
As stated previously, the extent to which a country’s media system is resilient to malign influence (in the form of media capture or disinformation) is a function of supply (journalists and media firms that produce media content both traditional and digital), and demand (citizens that consume this content), mediated by the broader political and societal environment. In Figure 1 below, we further break down these three components—Content Producers, Content Consumers, and the Institutional Environment—into nine distinct domains with three domains corresponding to each component. These domains break down further into 29 elements that we can use to measure the resilience of a country’s media system, listed in the Appendix to preserve readability. The Content Consumers component includes three domains and 11 elements, the Content Producers component has three domains and 11 elements, and the Institutional Environment component contains three domains and seven elements.
Figure 1. Media Resilience to Malign Influence (MRMI) Taxonomy
This taxonomy thus serves as a theoretical guide to collect proxy indicators to measure each element, domain, and component that ultimately comprise the full index. Appendix Table SA1 provides a list of all 29 elements that correspond with each domain, as well as each element’s description to guide data collection.
3.2 Data
In operationalizing the concepts in the above taxonomy, we collected existing data and supplemented this information with original research as needed. The resulting 58 indicators either directly measure or serve as reasonable proxies for the elements identified in the taxonomy of media resilience. [8] Twenty-five indicators correspond to content consumers as contributing to media resilience (or lack thereof), 10 indicators relate to content producers, and 23 relate to capturing facets of the institutional environment. See Appendix section Variables Used in Index for a more detailed description of data sources and variable attributes.
Although we found either direct or proxy data for most elements in the taxonomy, we found no data for four elements in three domains in two components. [9] This, however, did not prevent us from finding adequate data for all domains. We note that of the 29 elements in the taxonomy, we were able to find data for about 86% of them (25 total), a vast majority of elements that makes us comfortable moving forward with index creation.
3.3 Index Creation
In constructing the index for the 17 E&E countries between 2010-2020, we first had to overcome gaps in coverage in existing data sources (i.e., missing observations by country or year). Although many variables that we collected contain data for all 187 potential observations (11 years for 17 countries), some missingness does occur. Figure SA1 in the Appendix provides a snapshot of how complete our data collection was across the entire dataset, including by dataset attributes like component, [10] country, [11] year, [12] subregion, [13] while Table SA2 in the Appendix displays completeness by country-year observations. [14] This information allows researchers to assess the quality of the index for their own use cases. Of the 187 possible observations for the 17 countries between 2010 and 2020, 91.41% were complete in the source data.
To overcome this missing data challenge, we employ a three-tiered imputation strategy to fill in missing observations:
- Tier 1 - Carryforward: For variables where the data changes slowly over time, such as the World Bank’s Gini Coefficient or the UN’s Education Index, we carryforward available data in order to fill in missing values. [15]
- Tier 2 - Average of neighboring values: For variables where missing observations are driven by the timing of releases by data generators, such as the UN’s E-Government and E-Participation indices released every other year, we use the average of available neighboring values to impute missing observations.
- Tier 3 - Multiple imputation: For the remaining missing data, we use a Bayesian procedure which uses the distribution of observed data (the available, non-missing values) to fill missing data based on multiple estimates for missing values to “reflect the uncertainty around the true value” (UCLA Statistical Consulting Group, n.d.). [16]
Once we complete the imputation process, we rescale the data to ensure that all variables increase to mirror attributes that would increase media resilience. For instance, Varieties of Democracy’s Political Polarization measure codes higher scores on its scale as an increase in political polarization. We therefore reverse this scaling so that higher scores indicate less political polarization. Next, we standardize the variables so that they all range from 0 to 100. [17] It is important to keep in mind that any particular score on the 0 to 100 scale simply indicates an observation's value relative to another and has no normative implications on countries beyond our sample. [18]
After standardizing the data, we group the variables by element and take their average to generate separate variables that represent a measure of each element with available data. From here, we group these elements by domain, and take the average to generate nine different new variables that represent new domain measures. From here, we group these domains into our components and take their average to generate three separate variables that correspond to each component of the media resilience index. Finally, we take these averages to get the total MRMI Index score. [19]
After the data collection, imputation, and synthesis phases, we generate data for 17 E&E countries between 2010 and 2020 totaling 187 country-year observations. The resulting MRMI dataset includes an overall MRMI score alongside three component scores for each country. The scale is 0 to 100, with increasing scores indicating greater levels of media resilience.
4. Quantifying Media Resilience
How resilient are the media systems of countries in the Europe and Eurasia (E&E) region to external malign influence? In this section, we present the results of the Media Resilience to Malign Influence (MRMI) index for 17 E&E countries between 2010-2020. The 17 countries featured in the index are as follows: Albania, Armenia, Azerbaijan, Belarus, Bosnia and Herzegovina, Georgia, Kazakhstan, Kosovo, the Kyrgyz Republic, Moldova, Montenegro, North Macedonia, Serbia, Tajikistan, Turkmenistan, Ukraine, and Uzbekistan. In evaluating the results, we first examine media resilience on average for all 17 countries over the 11-year period, before breaking this down to look at the resilience of different components of a country’s media system, as well as the trajectory of media resilience over time. We note that all results reflect the country overall, and do not necessarily reflect the situation in a subnational unit or breakaway zone.
4.1 Key Findings
- Uzbekistan has made the greatest strides: it scored the second lowest among countries in media resilience in 2010, before jumping to middle of the pack by 2020.
- Armenia also has made impressive gains: it scored among the low end of countries in 2010 but garnered the highest MRMI score by 2020.
- Serbia saw the greatest decline over the decade, with a nine-point drop from 2010 to 2020.
- The greatest impediment to resilience against malign foreign influence across countries is the institutional environment in which these media systems operate.
- In more authoritarian regimes like Belarus, Kazakhstan, Uzbekistan, and Turkmenistan, what resilience these media systems do possess seems to come from the citizens themselves.
4.2 An 11-Year Snapshot of Media Resilience
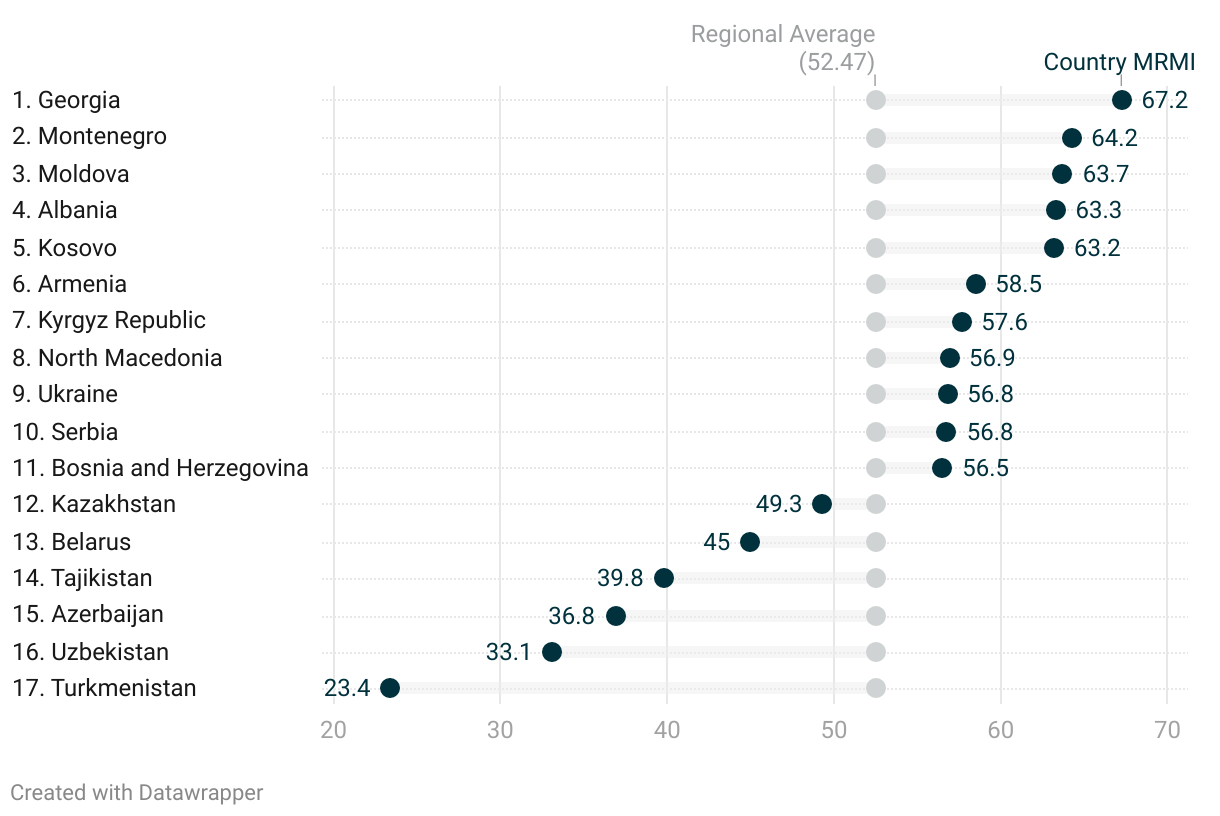
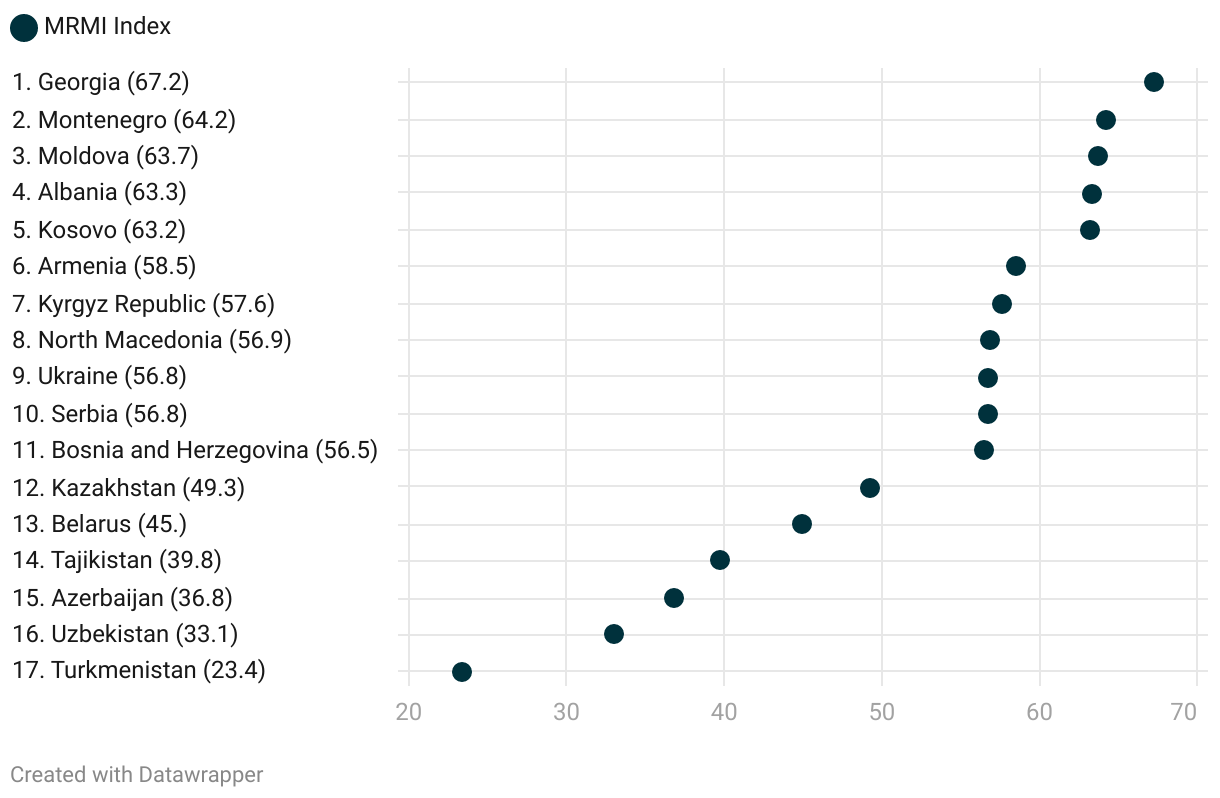
Figure 2 presents the 11-year average MRMI Index score for each country, with the average across all 17 countries represented by a dark blue dashed line. The figure indicates the countries cluster into three different buckets. The first are countries with the highest average media resilience scores of above 60 (on a scale of 0 to 100), the second are countries in the middle of the pack that score between 50 and 60, and the third are countries with lower media resilience levels below 50. [20]
Georgia appears best poised to curb foreign influence. Its 11-year MRMI Index average (67.24) is the highest among all 17 countries. This strong performance is consistent with IREX findings that Georgia possesses strong information quality, including content that is sufficiently funded and resourced, and covers a variety of topics (IREX, 2021a). Georgia’s content producers have become more diverse in recent years (UNDP, 2020), and the media system is considered one of the most professional (IREX, 2019b) and least corrupt (Coppedge et al., 2020) in the region.
Closely following Georgia, Montenegro has the next highest 11-year average media resilience score (64.23). In July 2020, the Montenegrin Parliament passed legislation to increase media ownership transparency, bringing the Balkan country up to date with the European Union’s legal framework. [21] However, this legislative framework is typically not enforced (IREX, 2021b). Though media literacy is still lacking among citizens and some attempts from Serbia and Russia to influence the country’s media persist, IREX reports that diverse channels exist for the flow of information (IREX, 2021b).
Figure 2. Average Media Resilience Index Score in 17 E&E Countries, 2010-2020
Sorted by Regional Rank
Grouped by Subregion
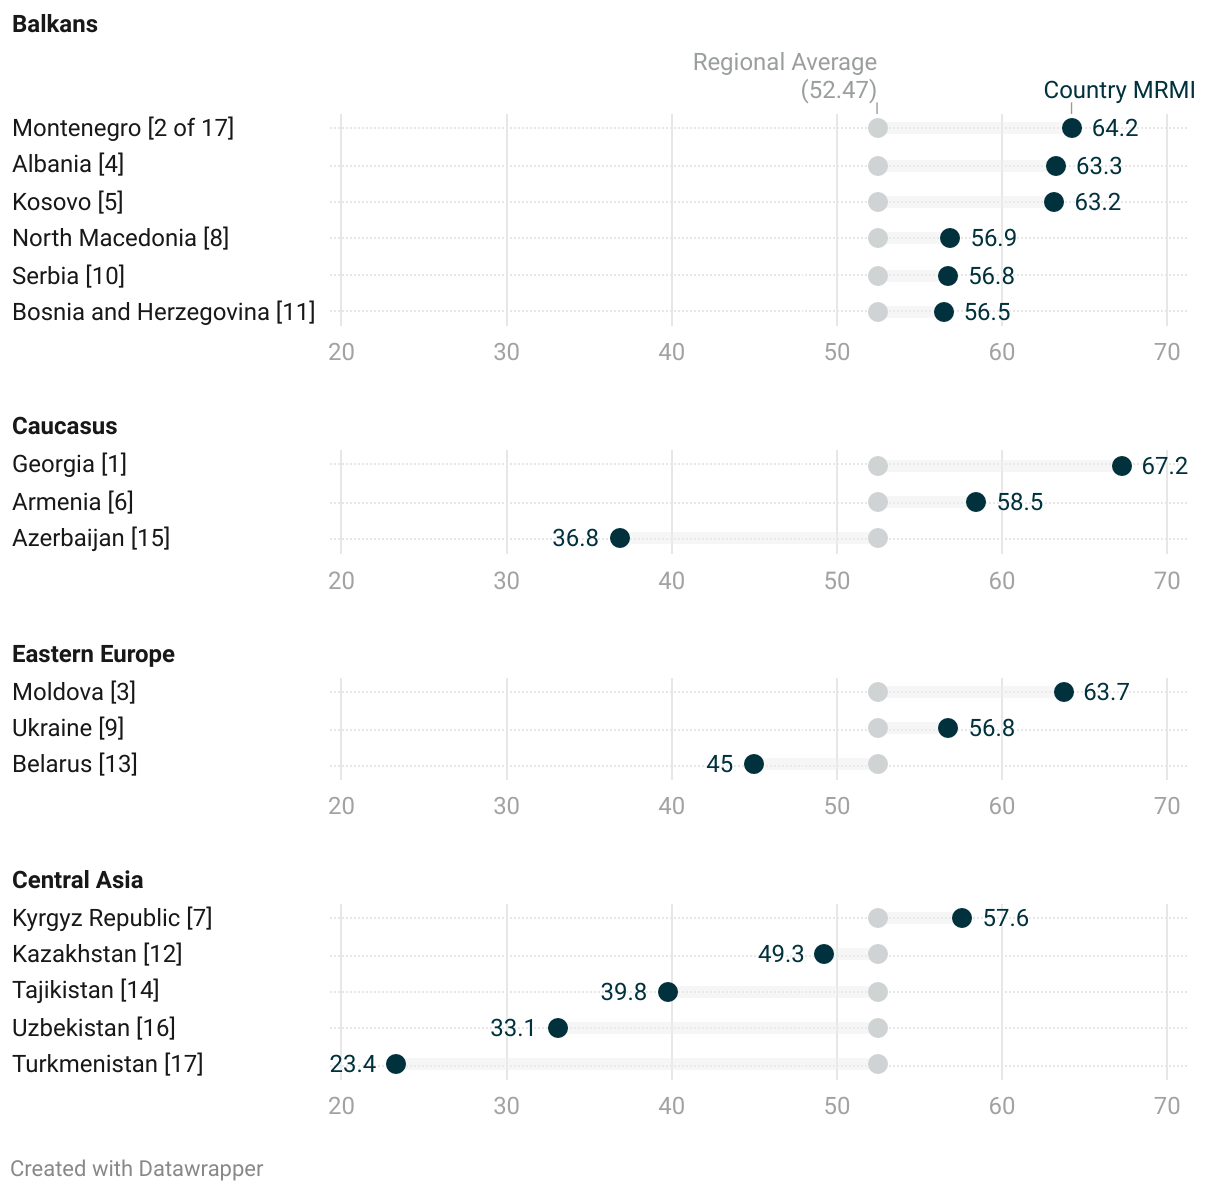
Also among the top countries, Moldova’s strong MRMI performance (63.71) may reflect the country’s response to foreign propaganda, such as enacting amendments to its Broadcasting Code—“the so-called ‘media propaganda’ law that effectively bans the rebroadcasting of Russian television programs on news, analysis, politics, and military issues in Moldova” (Radio Free Europe, 2018). [22] This legislation was preceded by a 2015 law that required media companies to publicly disclose their owners in order to increase transparency (Rosca, 2017). Although these laws are not without controversy, [23] they do have the potential to curb foreign influence and increase transparency. This can enable increased scrutiny of the provenance of media content in Moldova in such a way that safeguards against blind consumption of externally influenced media narratives.
Several countries from the former Yugoslavia, including Bosnia and Herzegovina, North Macedonia, and Serbia, fall somewhere in the middle of the pack—they beat the average but score below 60. Media ownership information in these countries is generally transparent, though “secret networks of ownership” sometimes exist behind officially listed names (Hodžić and Petković, 2020). This lack of full transparency may make it easier for compromised content producers to conceal avatar content (see footnote 7 above) from foreign actors posing as domestic content, thus preventing these countries from achieving higher media resilience scores. Rounding out the middle bucket are several former Soviet countries, including Armenia, the Kyrgyz Republic, and Ukraine.
All countries with below-average 11-year scores hail from the former Soviet Union, including Kazakhstan, Belarus, Tajikistan, Uzbekistan, and Turkmenistan. These countries are also the most autocratic countries in our sample and were consistently rated as “not free” by Freedom House’s Freedom in the World index in all sample years (Freedom House, n.d.). [24] This poor performance is likely exacerbated by government-imposed constraints on journalists in these countries in the form of punitive fines, jail terms, arbitrary arrests, and other forms of harassment which may degrade the overall capacity of content producers. Belarus imposed its own version of a media propaganda law to curb external influence with changes to its Law on Mass Media in 2018 to impede the operations of partly or fully owned foreign media in the country. However, in practice, President Alexander Lukashenko has utilized this legislation primarily as a means to further constrain local content producers, such as harassing freelance correspondents filing for foreign news outlets or arbitrarily denying registration to media outlets for failing to comply with excessive requirements.
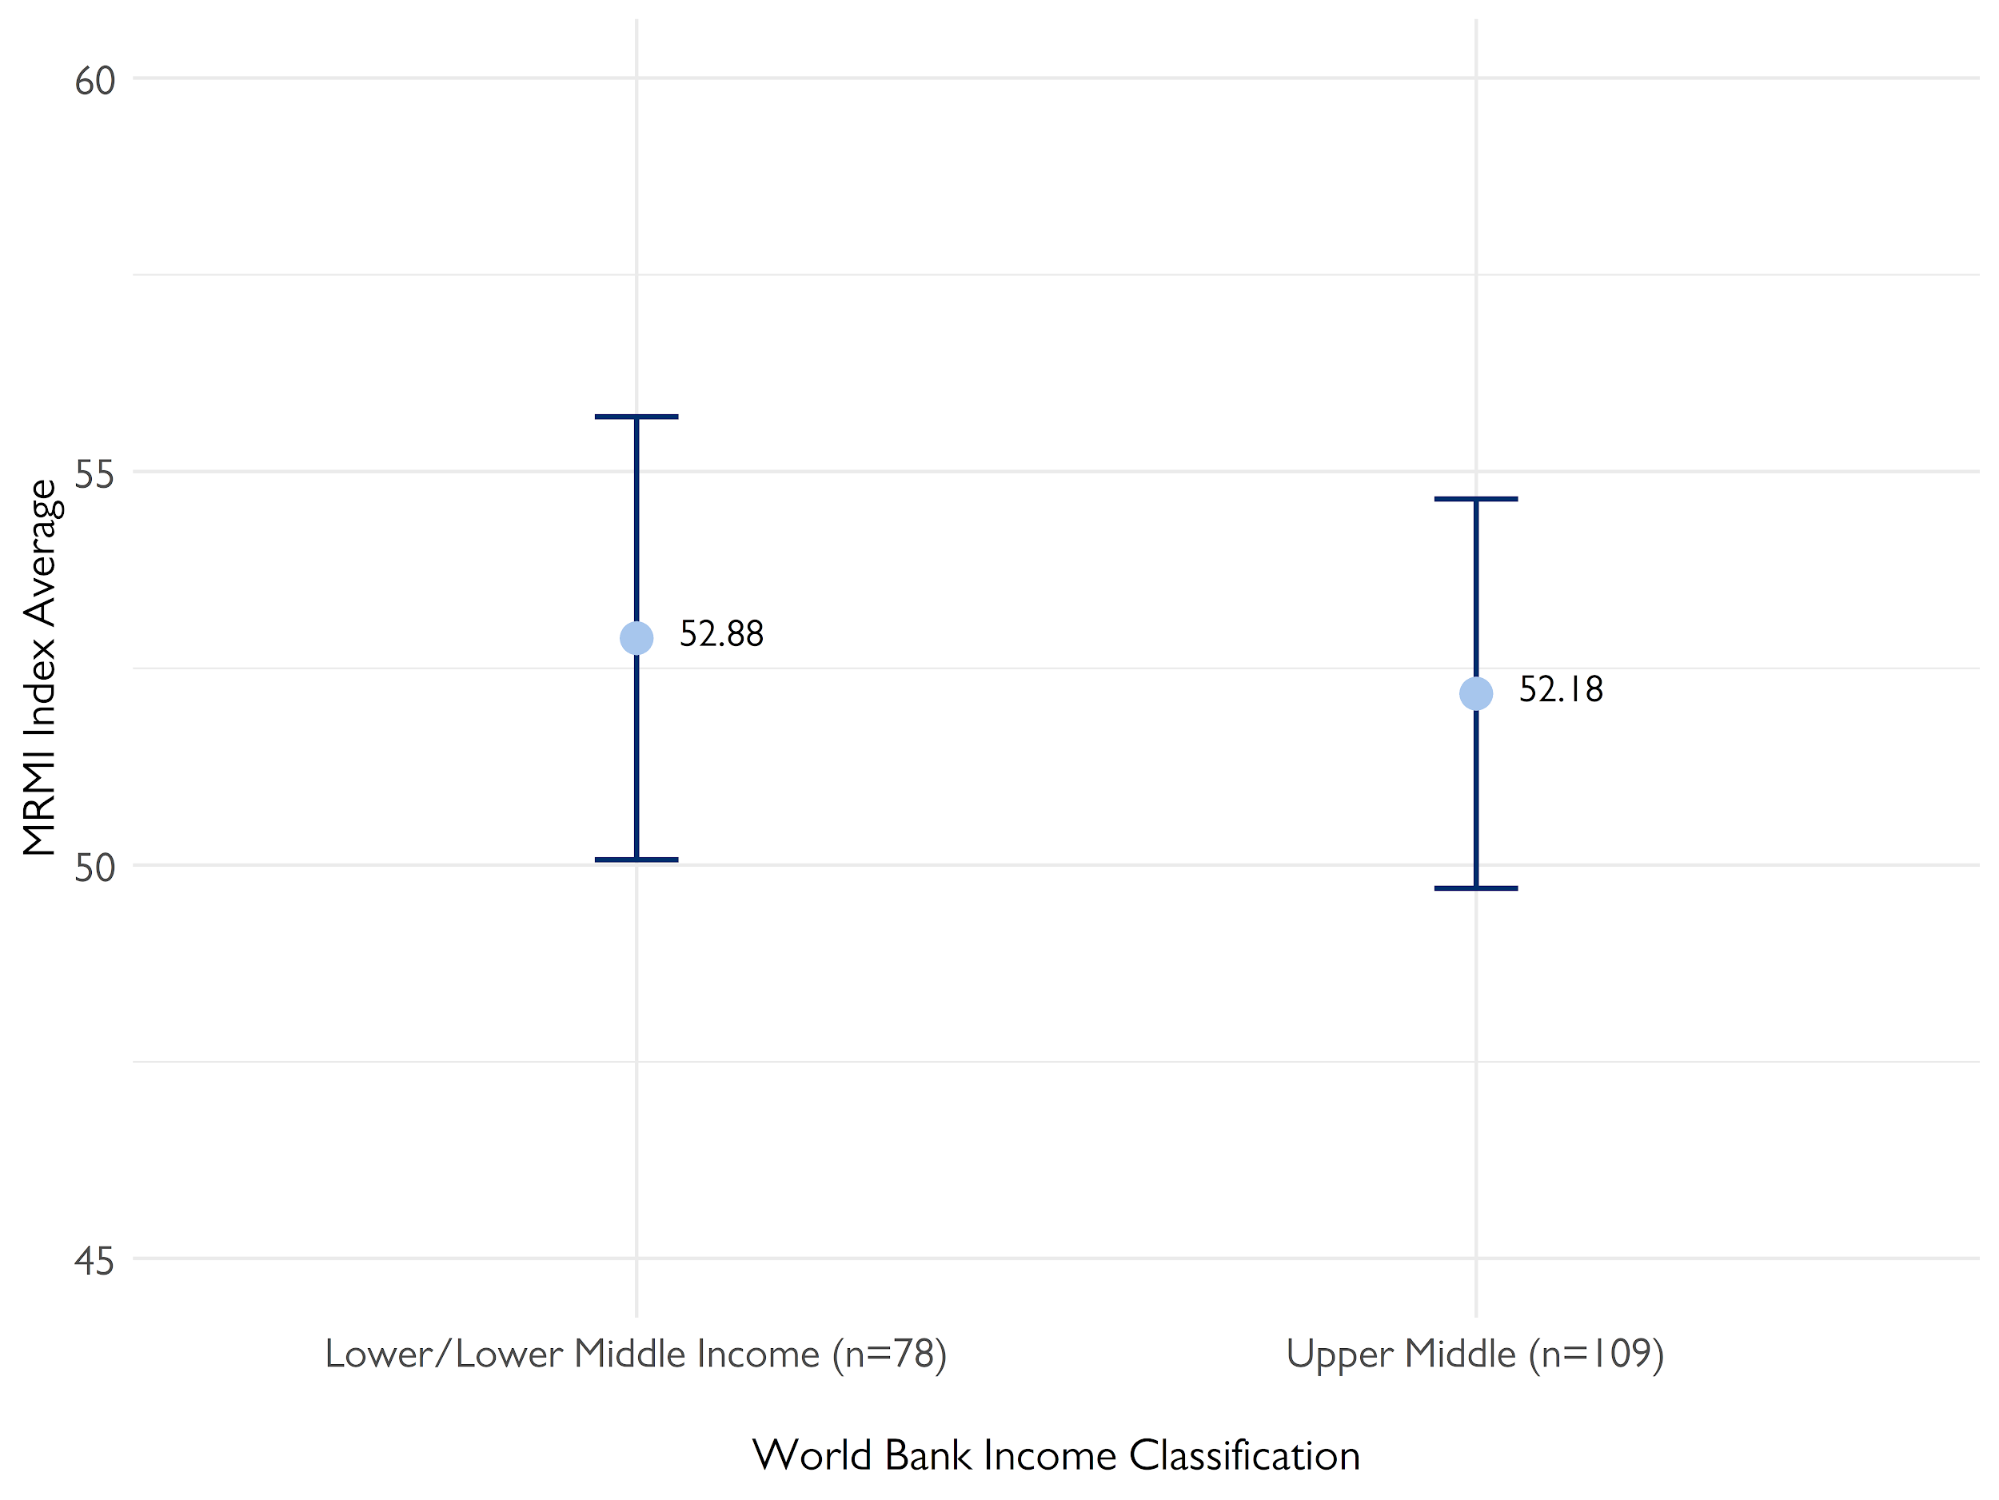
Strikingly, it does not appear that countries with greater financial resources necessarily have more resilient media systems than their less-wealthy peers. As Figure SA2 in the Appendix indicates, World Bank-classified upper middle income countries perform slightly worse than their counterparts with a lower-ranking income classification. [25] Two countries with top-scoring media systems, Moldova and Georgia, were both classified as lower middle income for the majority of the time period, while the lowest performing country, Turkmenistan, was upper middle income for the entirety of it. [26] In addition, GDP per capita and MRMI scores essentially have a correlation of 0. [27] These findings suggest a country need not increase its wealth to improve its media resilience, though this preliminary observation perhaps merits further investigation.
The 11-year average gives us an initial snapshot of media resilience across the E&E region; however, this aggregate metric obscures helpful information on the strengths and weaknesses of each country’s media system. To remedy this blindspot, we disaggregate each country’s media resilience score into three components of a resilient media system: content producers (supply-side), content consumers (demand-side), and institutional environment (the prevailing laws and norms). We provide these analyses in the next section.
4.3 Unpacking the Strengths and Weaknesses of a Country’s Media System
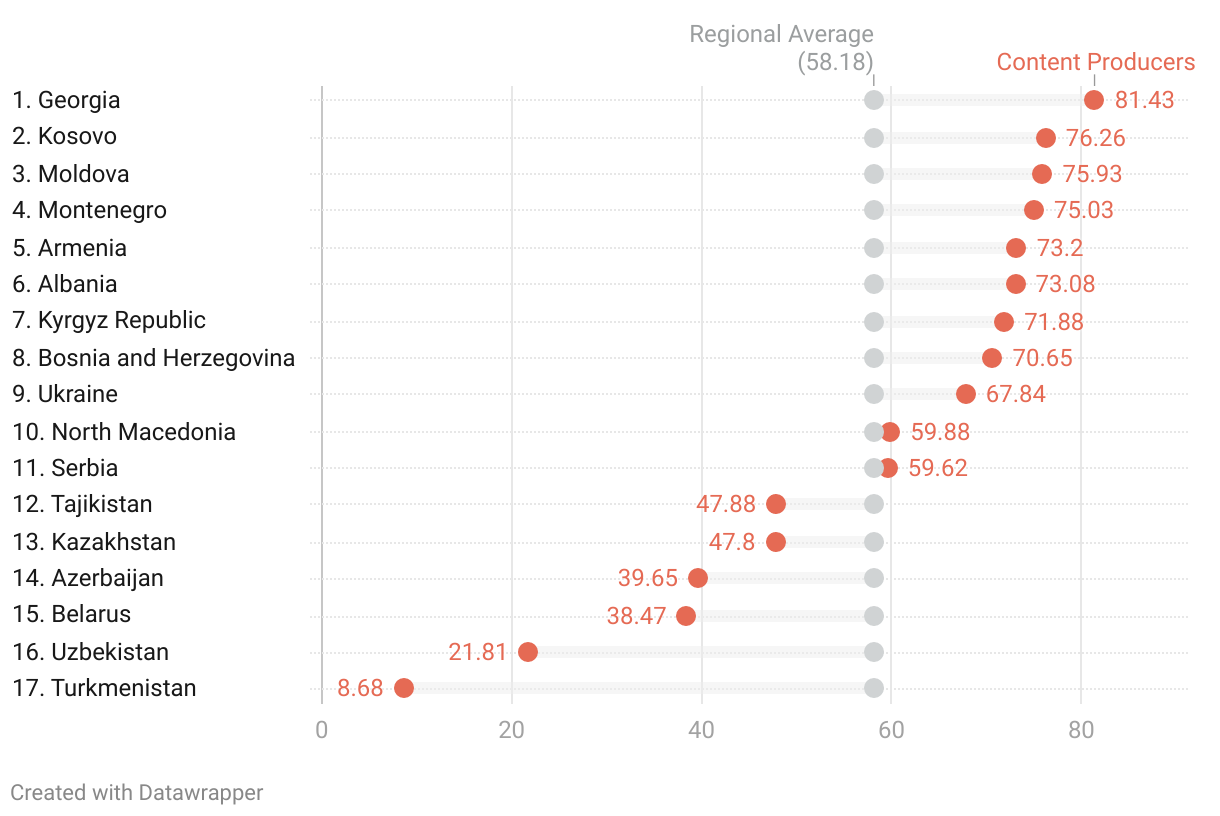
Figure 3 below shows a breakdown of Azerbaijan, Georgia, Kosovo, and Uzbekistan's average performance over the 11-year period on three aspects of media resilience: content consumers, content producers, and the institutional environment. [28] The aggregate MRMI Index score (the darkest symbol) is a simple average of these three components. Figure 3 also shows the variation among components, measured using standard deviation where higher values indicate greater variation among a country’s three component averages. Georgia carries the most component variation among the 17 countries with a standard deviation of about 12.7, while Azerbaijan shows the least with about 1.9. The standard deviations’ range of the remaining countries falls between Georgia and Azerbaijan. [29]
Georgia stands out as having the most variation among the three components of a resilient media system—it has one of the highest content producer scores and yet is on the lower end of content consumer scores across the 17 countries. Uzbekistan stands out as having higher content consumer scores than other components. In practice, this suggests that what resilience the Uzbek media system possesses comes largely from their citizens' ability to identify disinformation and scrutinize content, rather than from the less reliable and professional media outlets under strict government control that serve them. We find a similar pattern in Belarus, Kazakhstan, and Turkmenistan, as well (See Figures SA3a-b in the Appendix). Comparatively, Azerbaijan, as seen in Figure 3, is much more even in its performance across the three components of media resilience. Other countries with a similar performance that is not shown in the figure above include Serbia and North Macedonia
Figure 3. Average Scores for Overall MRMI and Three Components in Four E&E Countries (2010-2020)
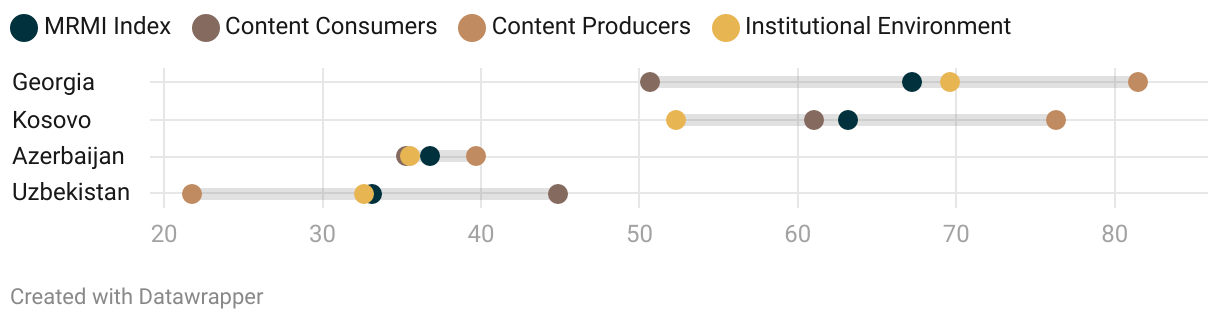
The institutional environment in which media systems exist appears to be a consistent Achilles heel in impeding each country’s 11-year average MRMI scores. The institutional environment is never the highest-scoring component; instead, it is often the lowest, as seen with Kosovo in Figure 3. [30] Systemic corruption remained a persistent problem in Kosovo throughout the time period of analysis (Open Data Kosovo, 2019). [31] Government corruption comes with a host of societal problems, like a lack of government responsiveness and accountability (Adsera et al., 2003; Charron and Lapuente, 2018). These data suggest that media resilience is not exempt from corruption problems, which could hamper government willingness to correct and prevent malign foreign influence in the media. As previously discussed, authoritarian control can also serve as an impediment to creating a resilient institutional environment, if it allows authorities to selectively target opposition voices and/or degrade the capacity or diversity of professional media.
The 11-year scores provide a sense of how the 17 E&E countries have fared on average with regard to media resilience over the last decade, but it does not let us examine the trajectory of these countries over time. In the next section, we compare media resilience scores from the start of the period (2010) to the end (2020), to better pinpoint whether and how countries are heading in the right direction and where the most work remains to be done.
4.4 Examining the Trajectory of Media Resilience Over Time
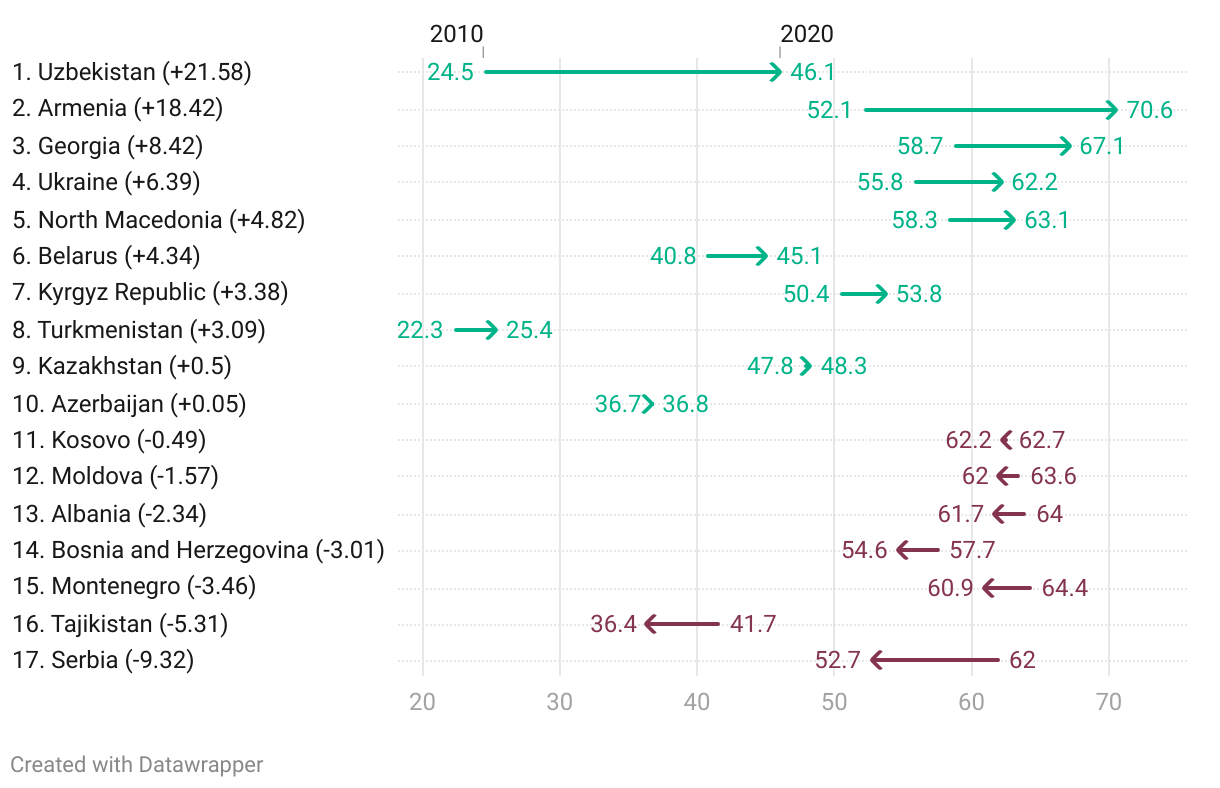
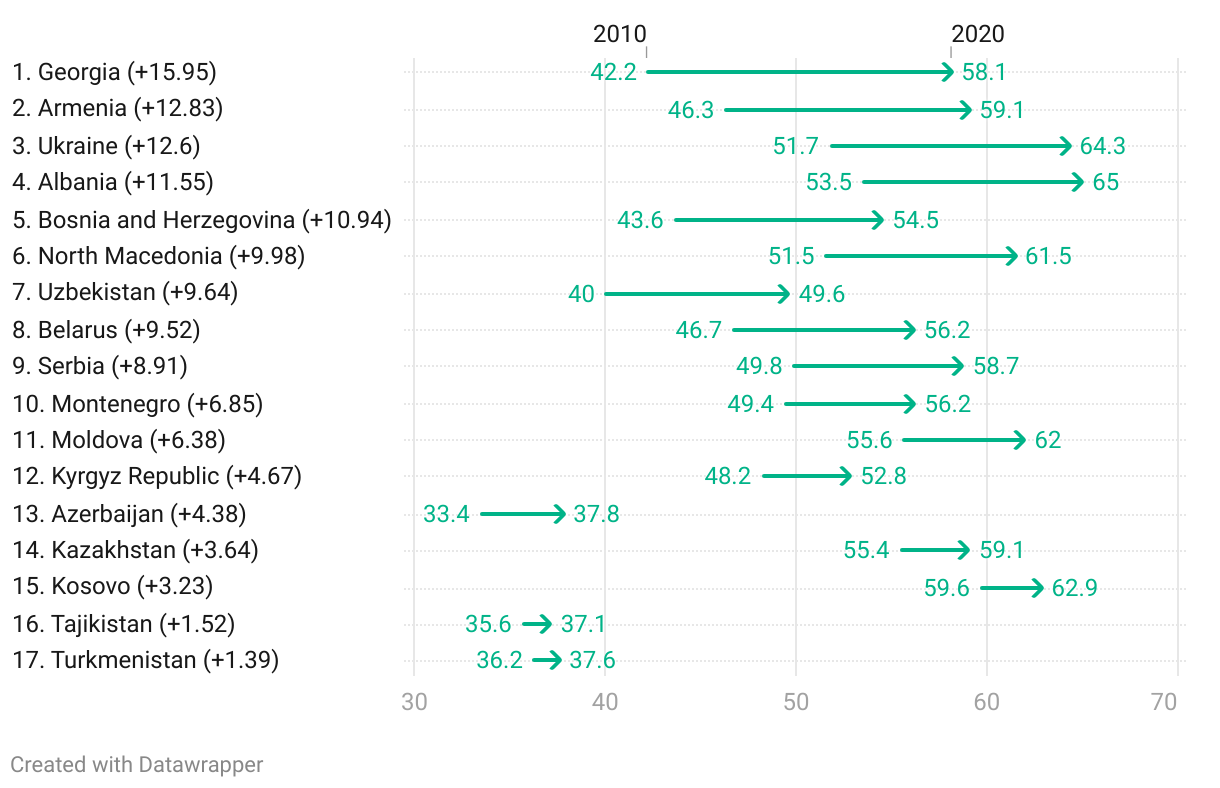
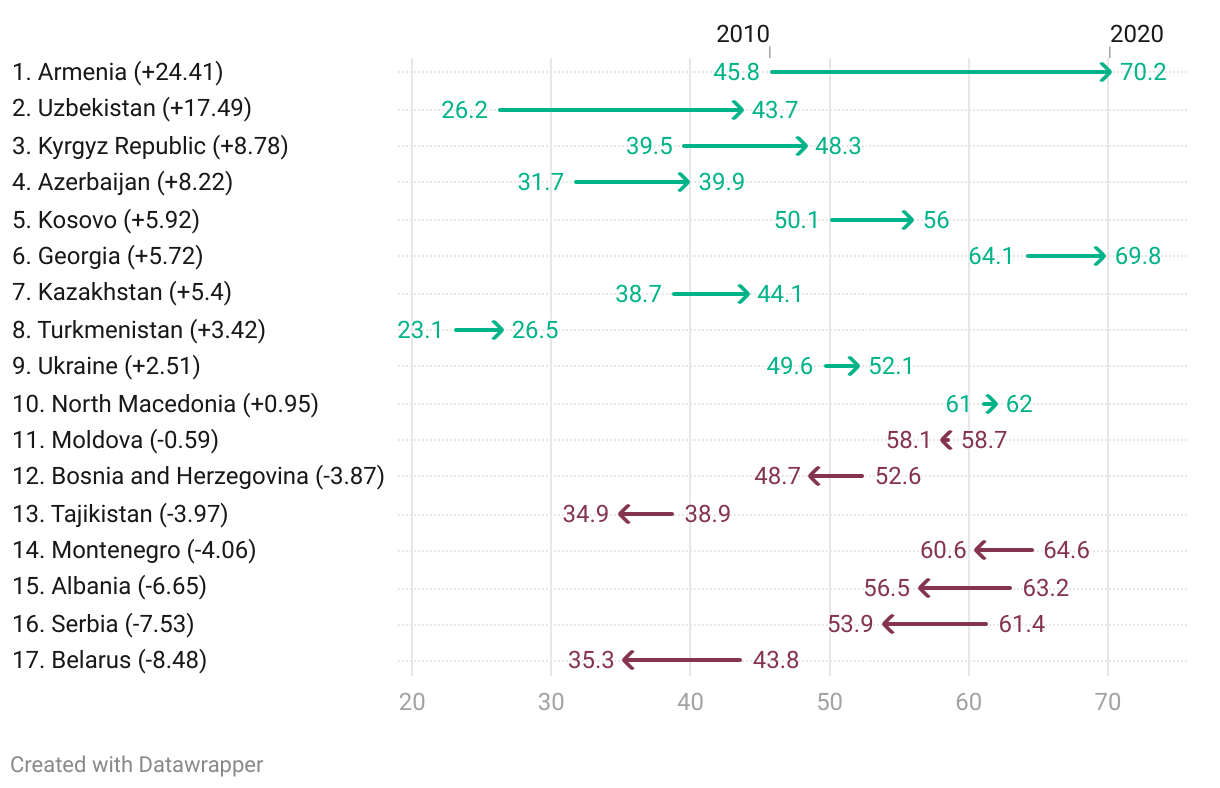
As shown in Figure 4a below, Uzbekistan won the award for most improved during the last decade: it increased its media resilience score by 21.58 points between 2010 and 2020 (from 24.51 to 46.09). During this time, the death of long-time dictator Islam Karamov brought country-wide reforms, including in the media sector, which we discuss further in the next section. Closely following Uzbekistan with the second largest increase in media resilience is Armenia. Perhaps the most significant event that occurred during this time is the # MerzhirSerzhin revolution, a popular protest that ousted then-Prime Minister Serzh Sargsyan following his controversial election to a third term in office, which was made possible by a change to Armenia’s constitution. The protest ushered in Armenian journalist and newspaper editor Nikol Pashinyan to replace Sargsyan as Prime Minister. We discuss this development further in the next section as well.
While most countries improved during the time period, seven saw their overall levels of media resilience decline, namely, Moldova, Albania, Kosovo, Bosnia and Herzegovina, Montenegro, Tajikistan, and Serbia. In particular, Serbia saw the greatest decline in its index score by 9.32 points (from 62.02 in 2010 to 52.7 in 2020). To see one of the region’s most resilient media systems sink to the bottom in just a decade serves as a reminder that media resilience is a continuous effort rather than a once and done proposition. In 2017, Aleksandar Vučić became president and has been accused of curtailing freedoms in the country and overseeing greater autocratization in Serbia (Tannenberg et al., 2019), though Serbia’s democratic institutions have steadily deteriorated since 2012 when the ruling Serbian Progressive Party came to power (Csaky, 2020). This new institutional environment could be the main culprit in Serbia’s dramatic MRMI score reduction and we encourage further research to better understand this decline.
Figure 4a. Change from 2010 to 2020 in Media Resilience in 17 E&E Countries
Sorted by Regional Rank
Grouped by Subregion
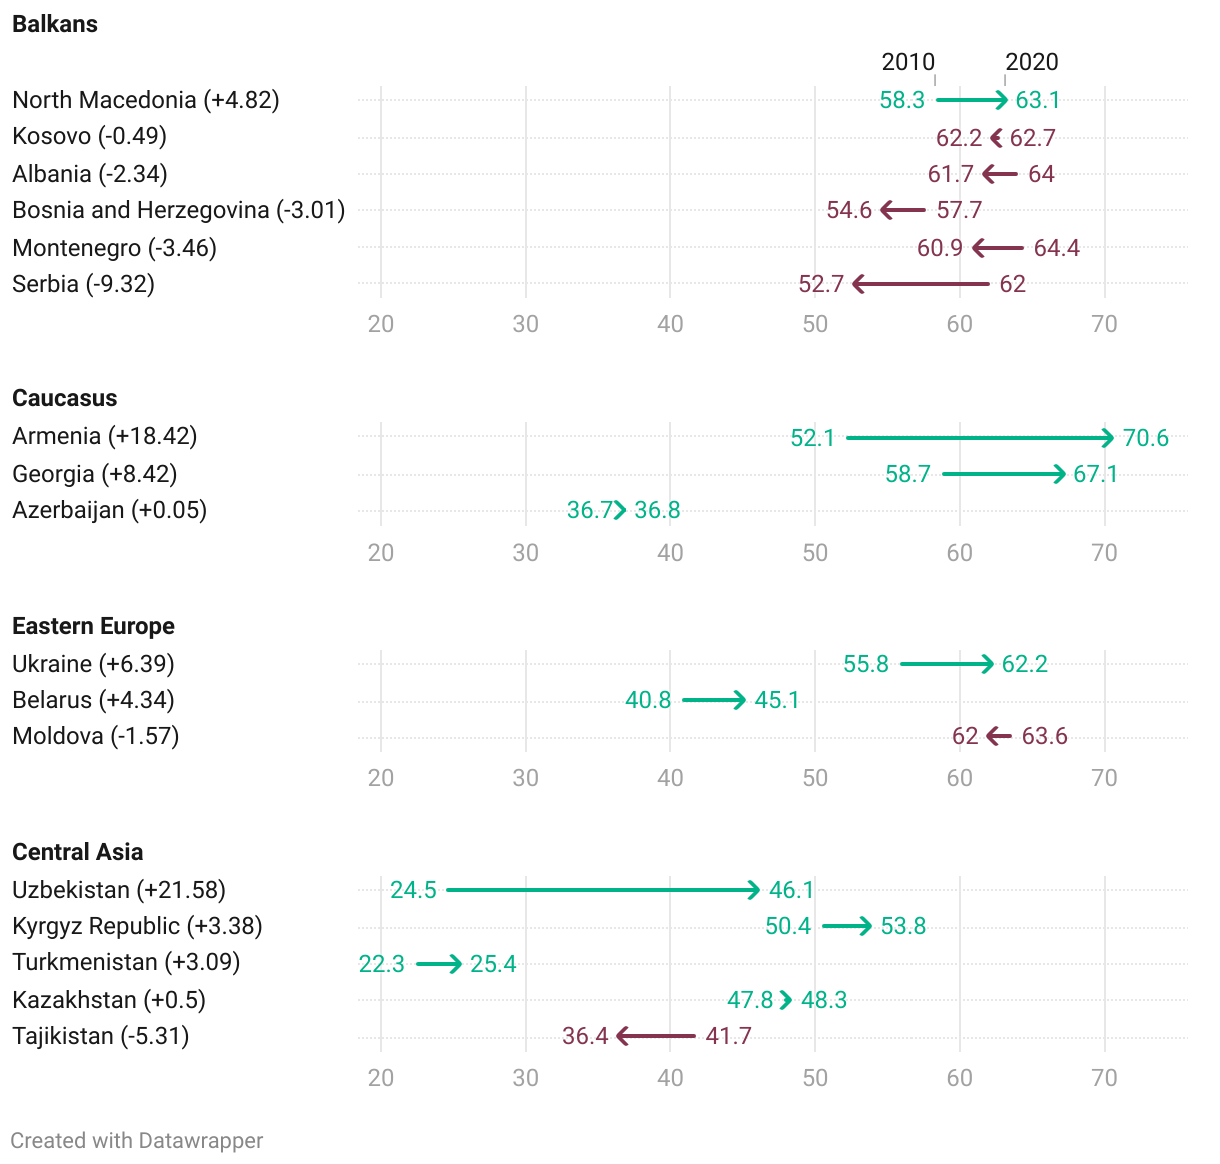
Surprisingly, we find that media resilience can improve even in an authoritarian setting. Uzbekistan aside, Belarus saw the sixth-largest score increase, with a 4.35 point change in media resilience from 40.75 in 2010 to 45.09 in 2020. Nonetheless, it is important to underscore that these gains were achieved over the last decade, and it remains to be seen how the brutal crackdowns by the Lukashenko government during the 2020 presidential election cycle will affect the country’s future performance. As described above, Serbia serves as something of a cautionary tale for how improvements in a country’s resilience can easily be degraded by changes in the government’s policy. Potential explanations for Belarus' score improvement between 2010 and 2020 will be further discussed in the section below.
Kosovo, which broke away from Serbia and only declared independence in 2008, demonstrated a negligible negative score change between 2010 and 2020 that effectively amounts to no change, evidencing a good level of stability. Although Kosovo was de facto governed by a United Nations administration for much of the 2000s and is now independent, Serbia continues to lay claim to Kosovo, citing Serbian cultural and religious history in the region. Kosovo’s self-declaration of independence remains controversial, with only 98 United Nations member states recognizing its independence. Both Serbia and Russia do not recognize Kosovo’s independence. Given the contention around Kosovo and those wishing to control its domestic politics, it is remarkable that the country has maintained its level of media resilience over a turbulent first decade of independence.
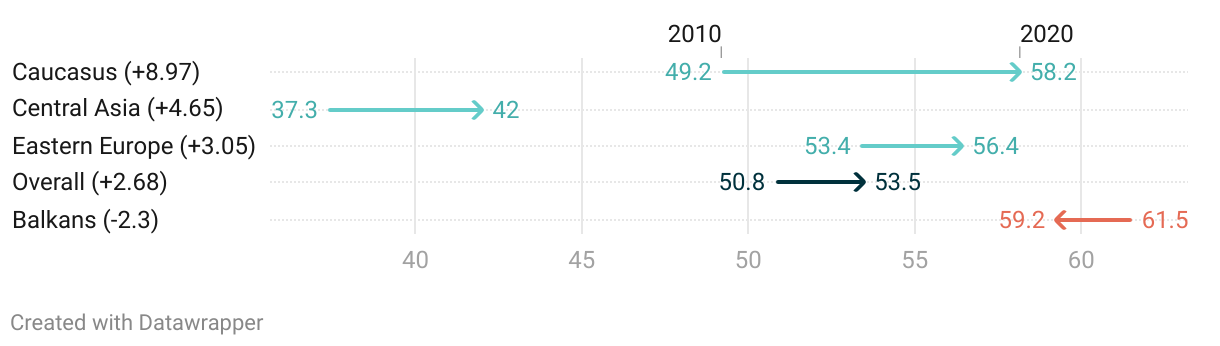
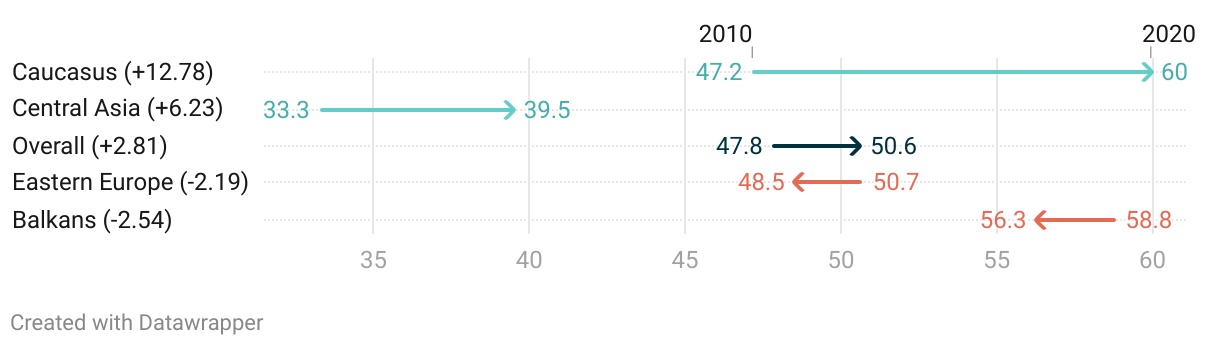
In looking at the region as a whole in Figure 4b, it experienced a modest increase in MRMI scores. The average of all countries rises 2.7 points, with the Caucasus subregion mainly driving this increase. Central Asia and Eastern Europe should not be counted out either, as these subregions also saw increases over the sample period. The Balkans is the only subregion that saw losses in its media resilience, where four of the five countries with the largest overall decline—including the worst in Serbia—appear.
Figure 4b. Change from 2010 to 2020 in Media Resilience Overall and Among Subregions
While the figures we have presented in this section thus far provide valuable data on largely static measures of media resilience, the next section shows the full MRMI Index and component scores in all years from 2010 to 2020. These data allow us to both confirm some results that we have found thus far and discover new ones.
4.5 Year-on-Year Trends in E&E Resilience to Malign Influence
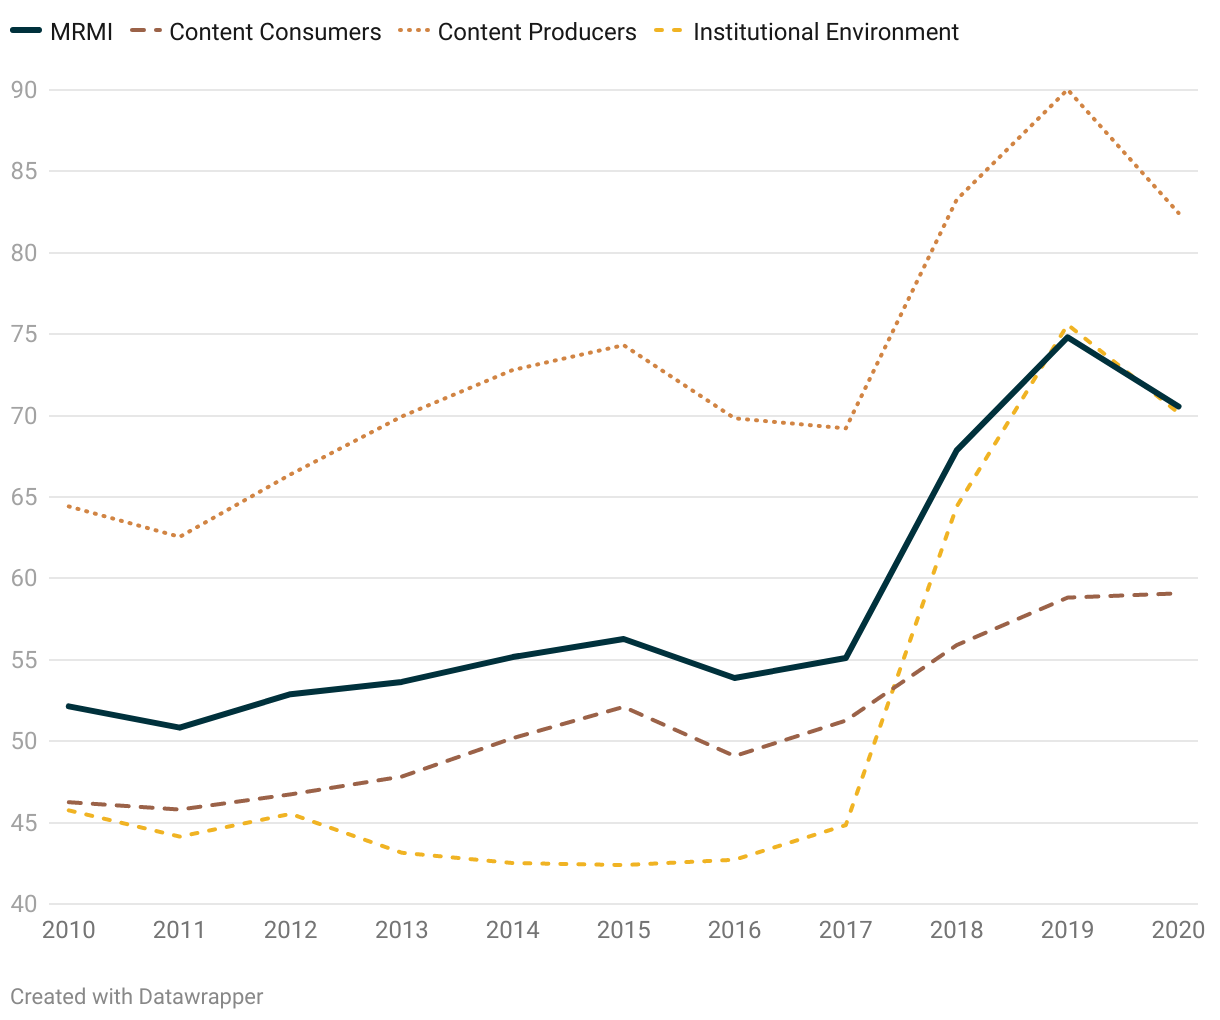
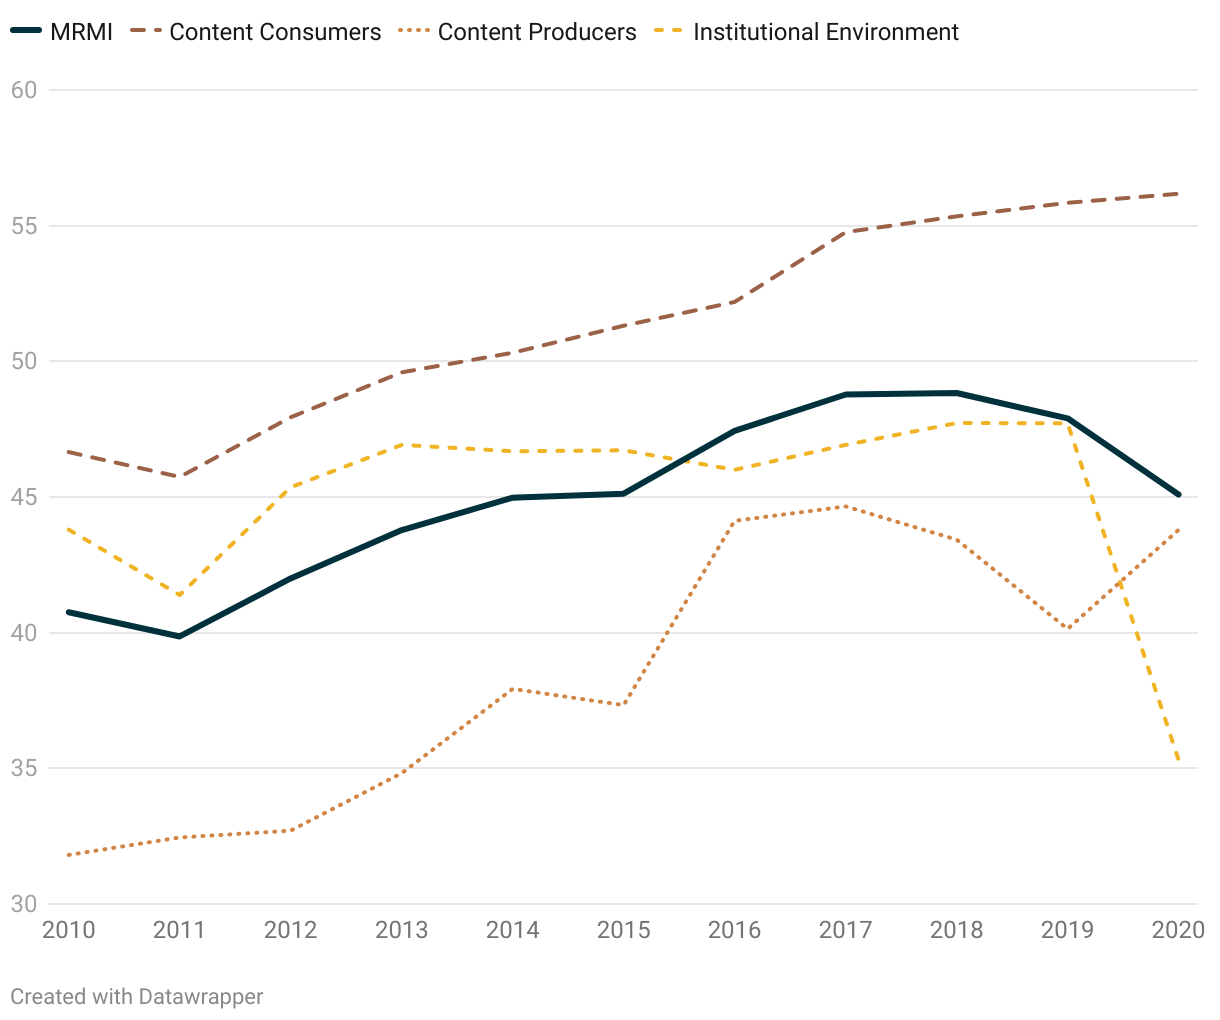
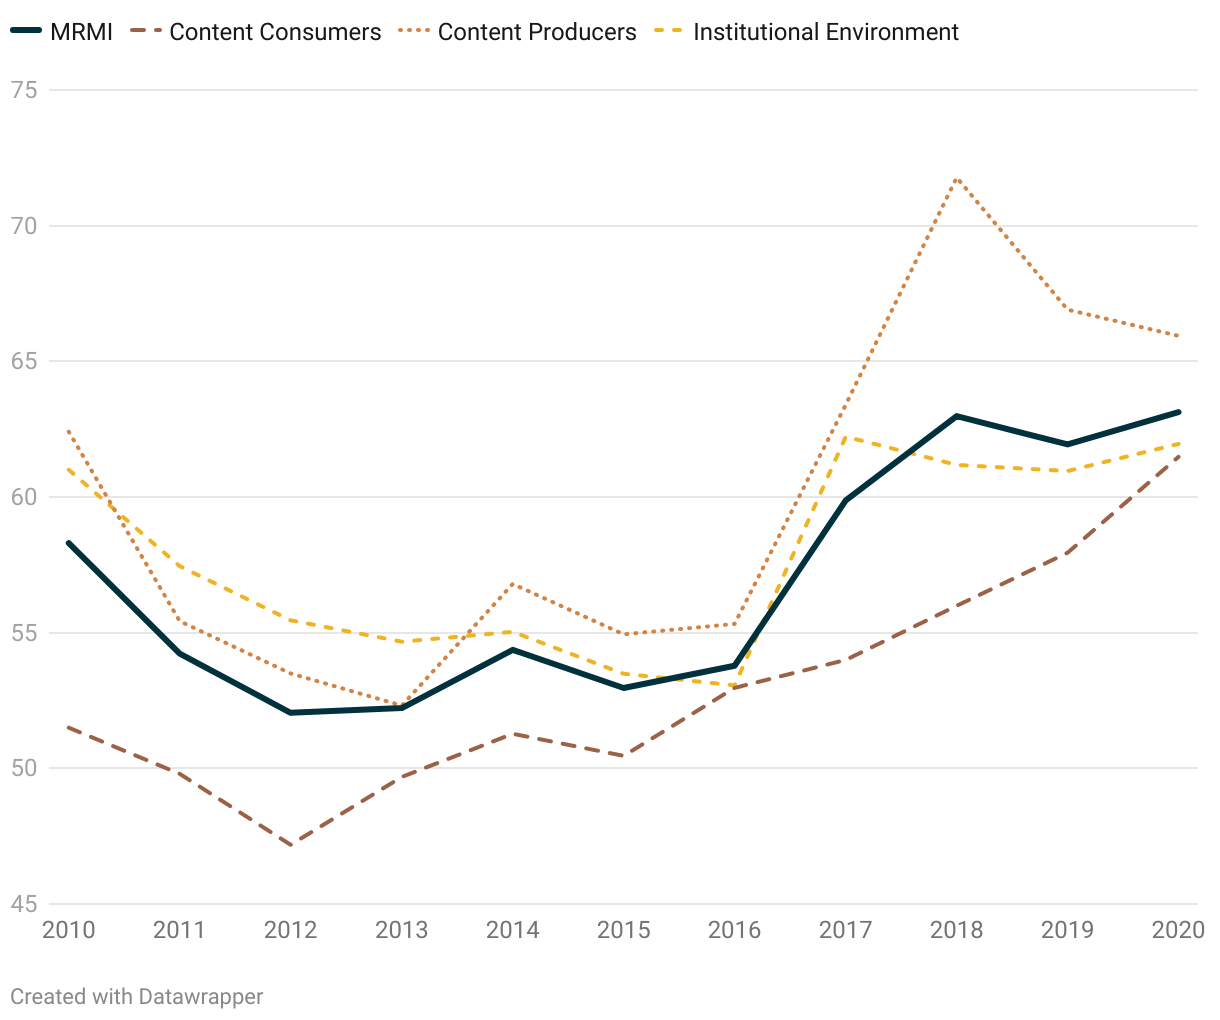
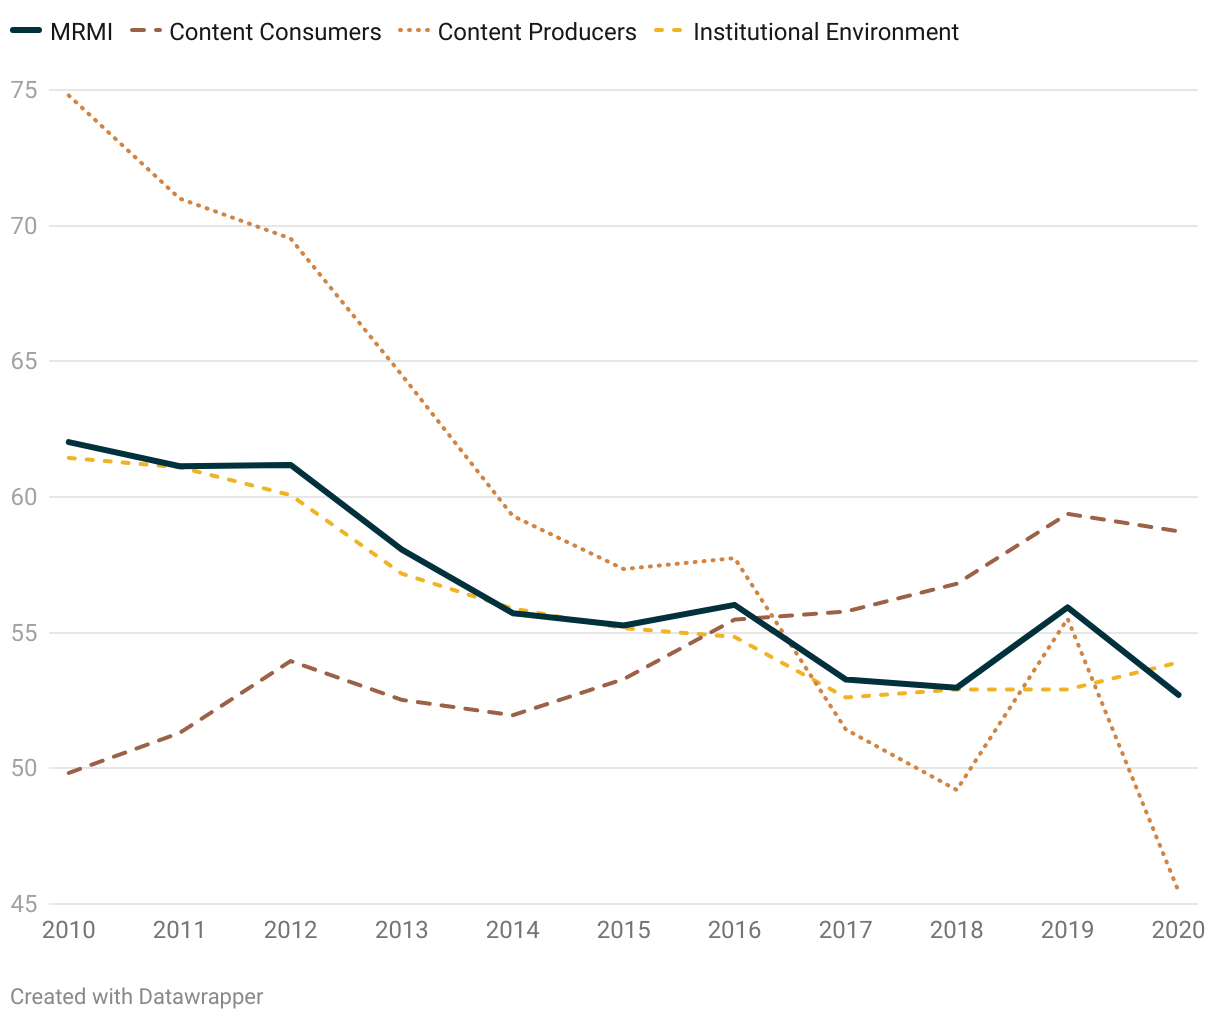
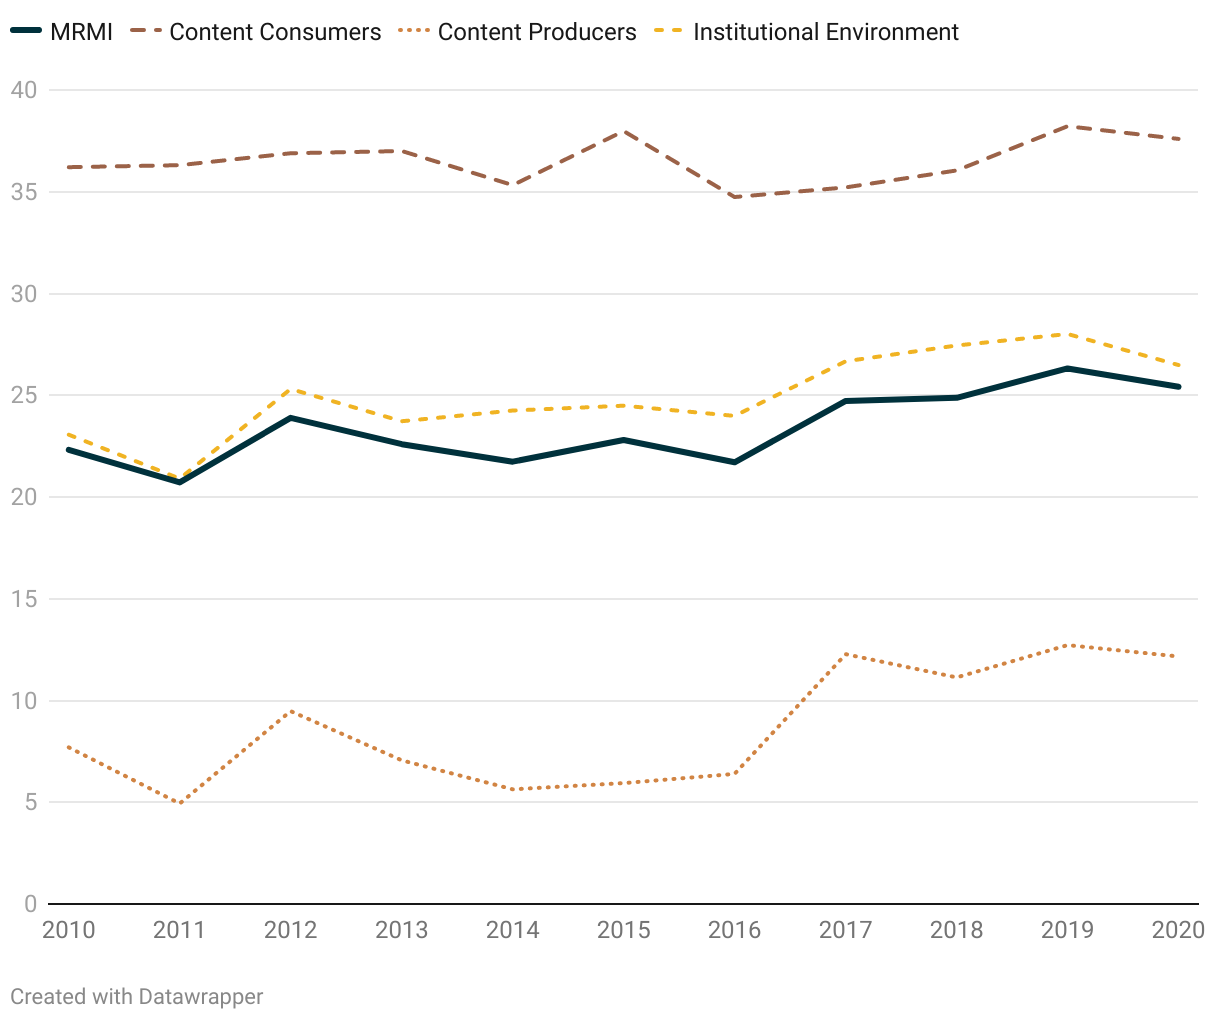
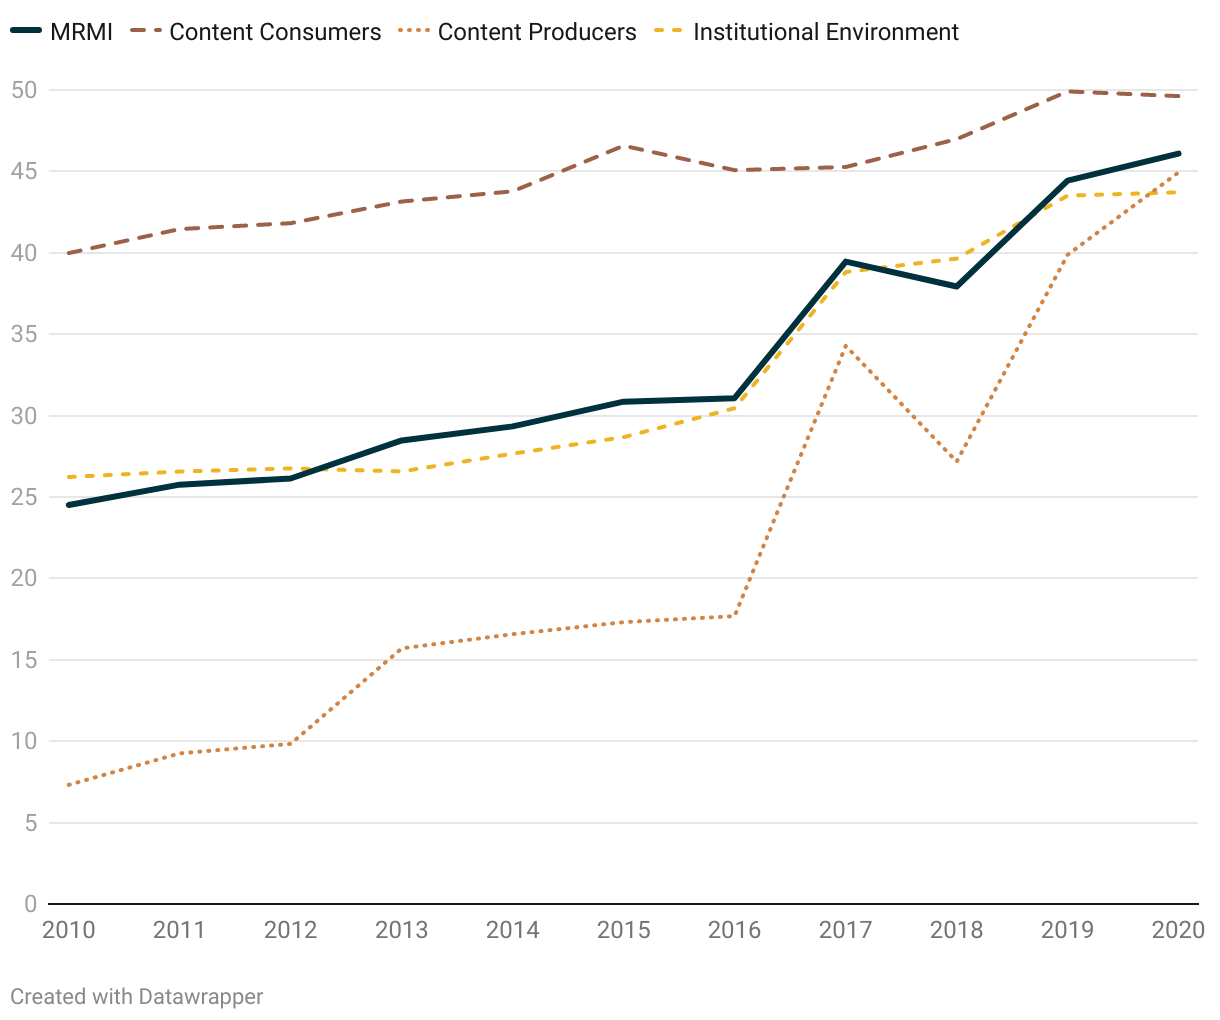
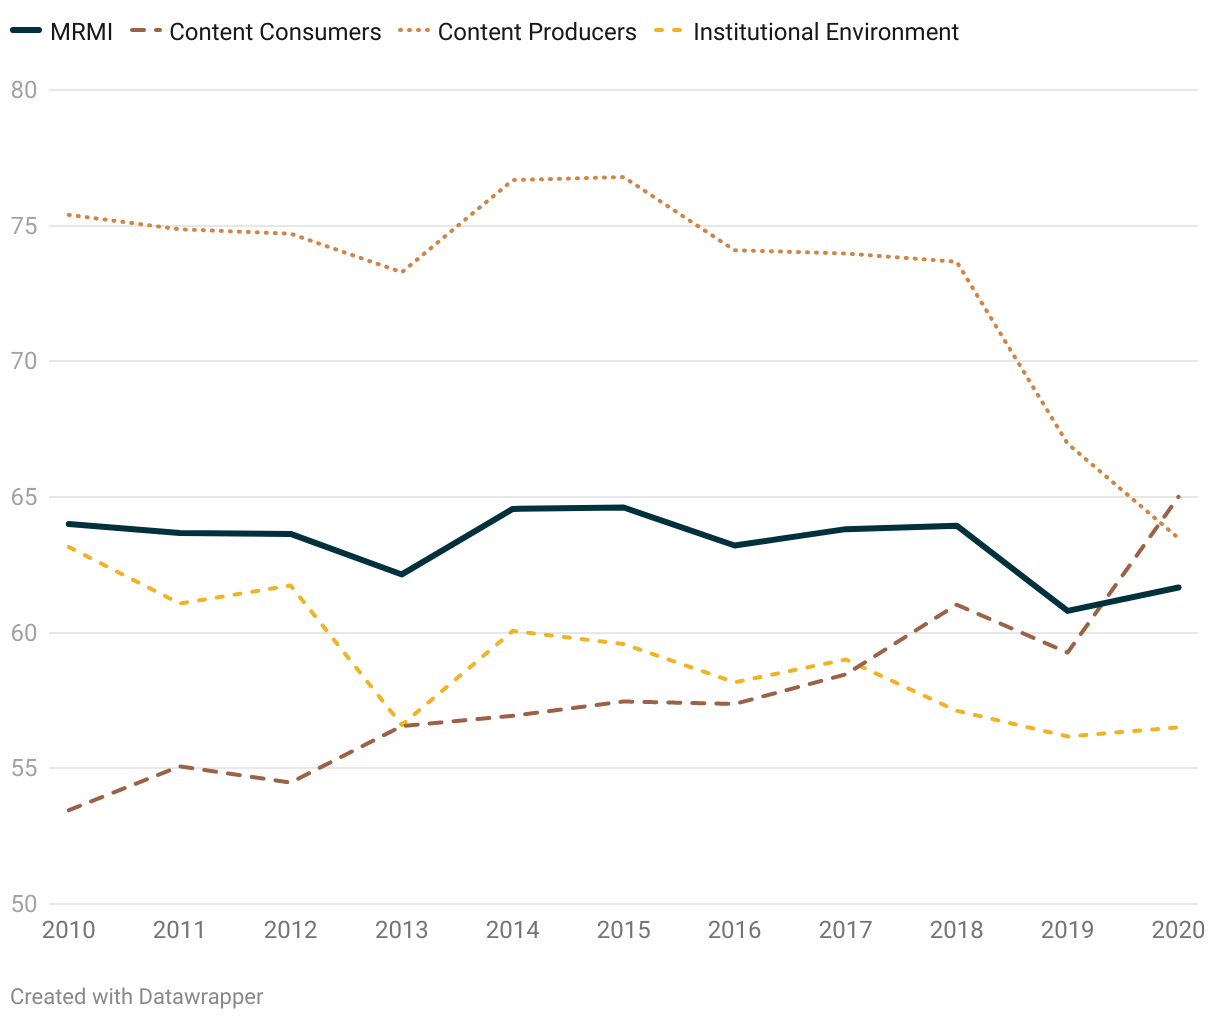
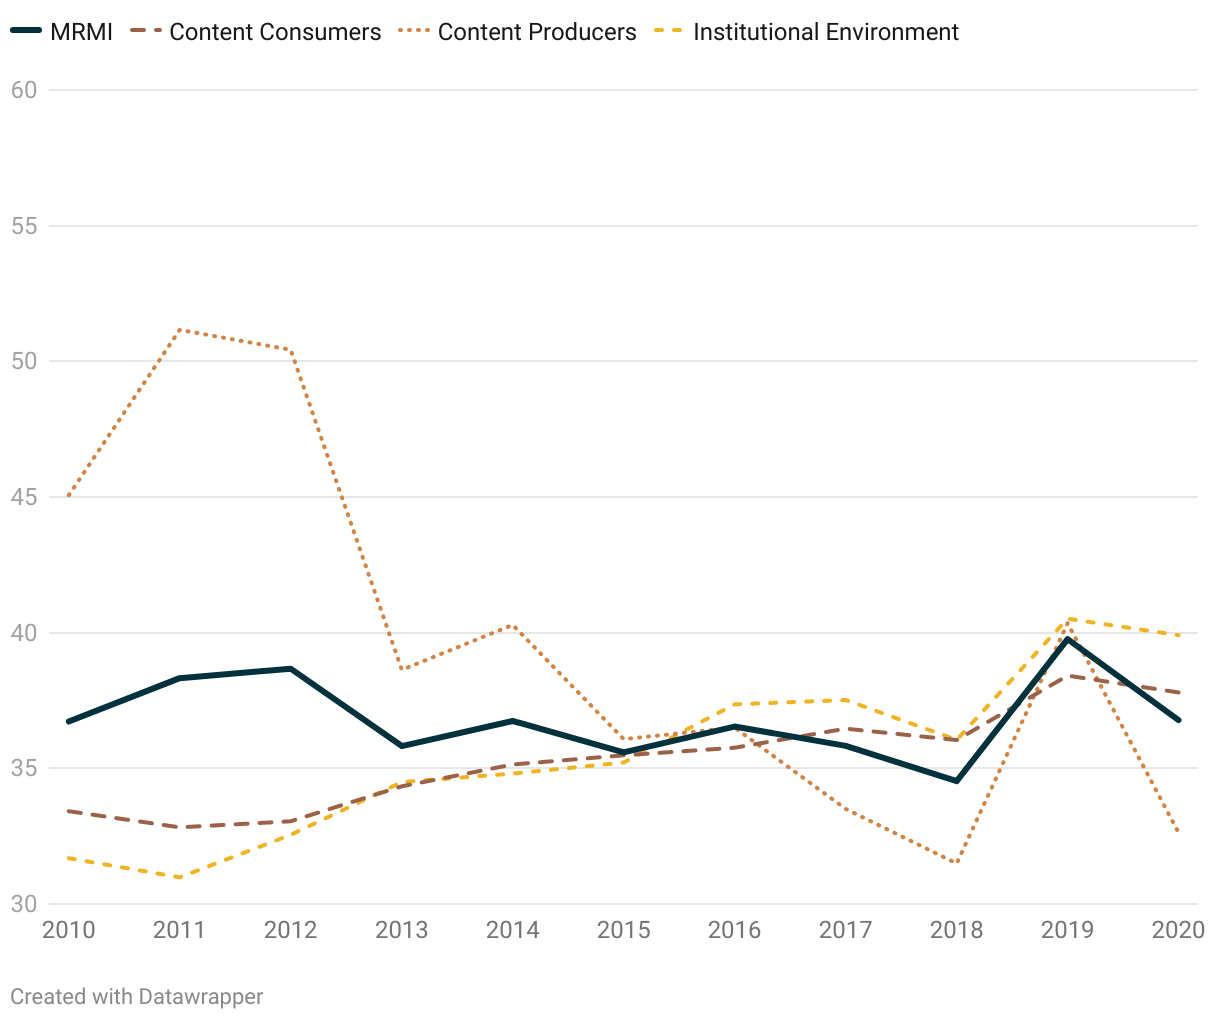
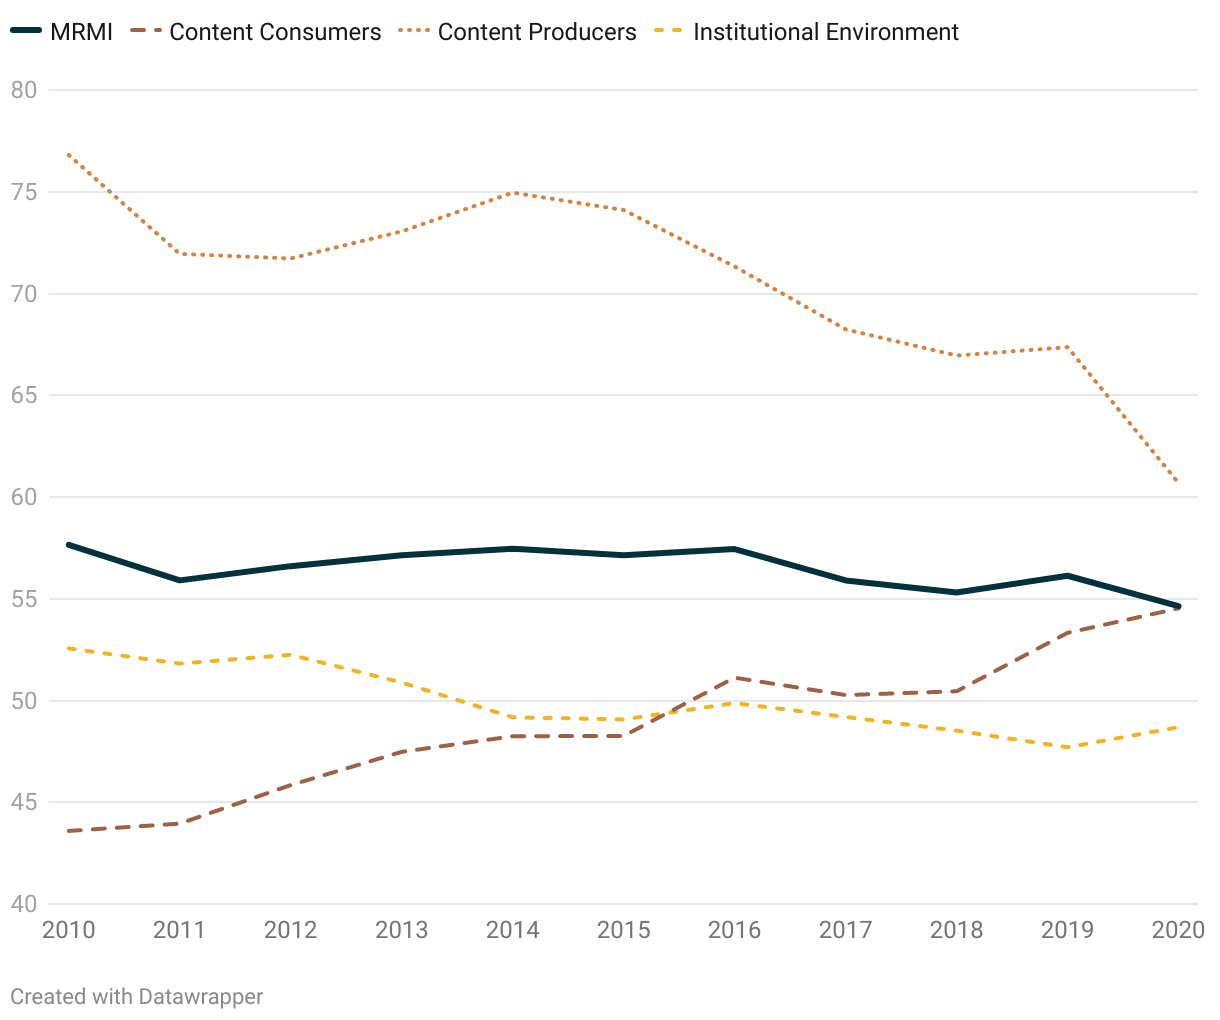
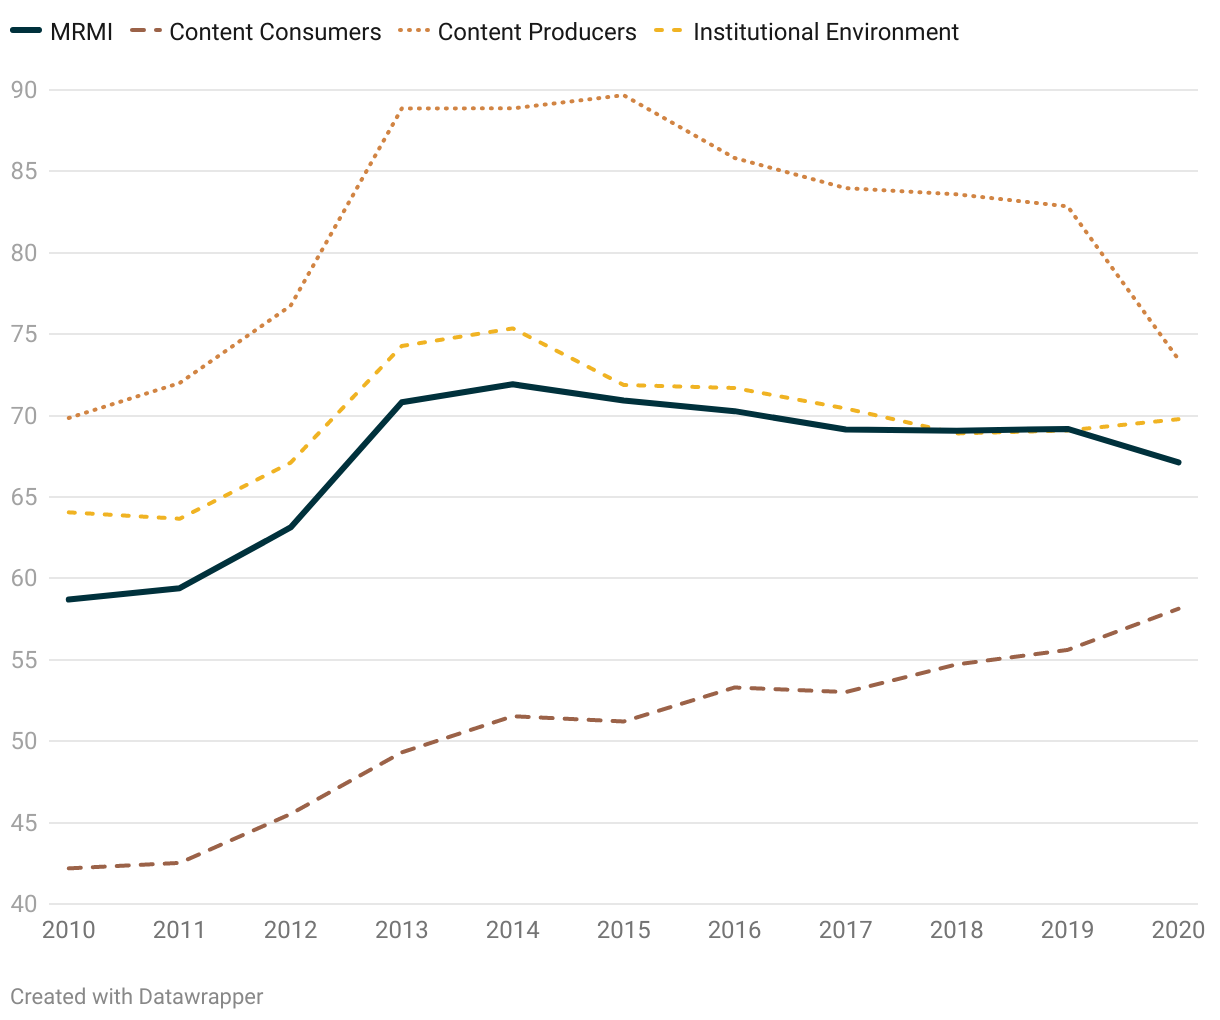
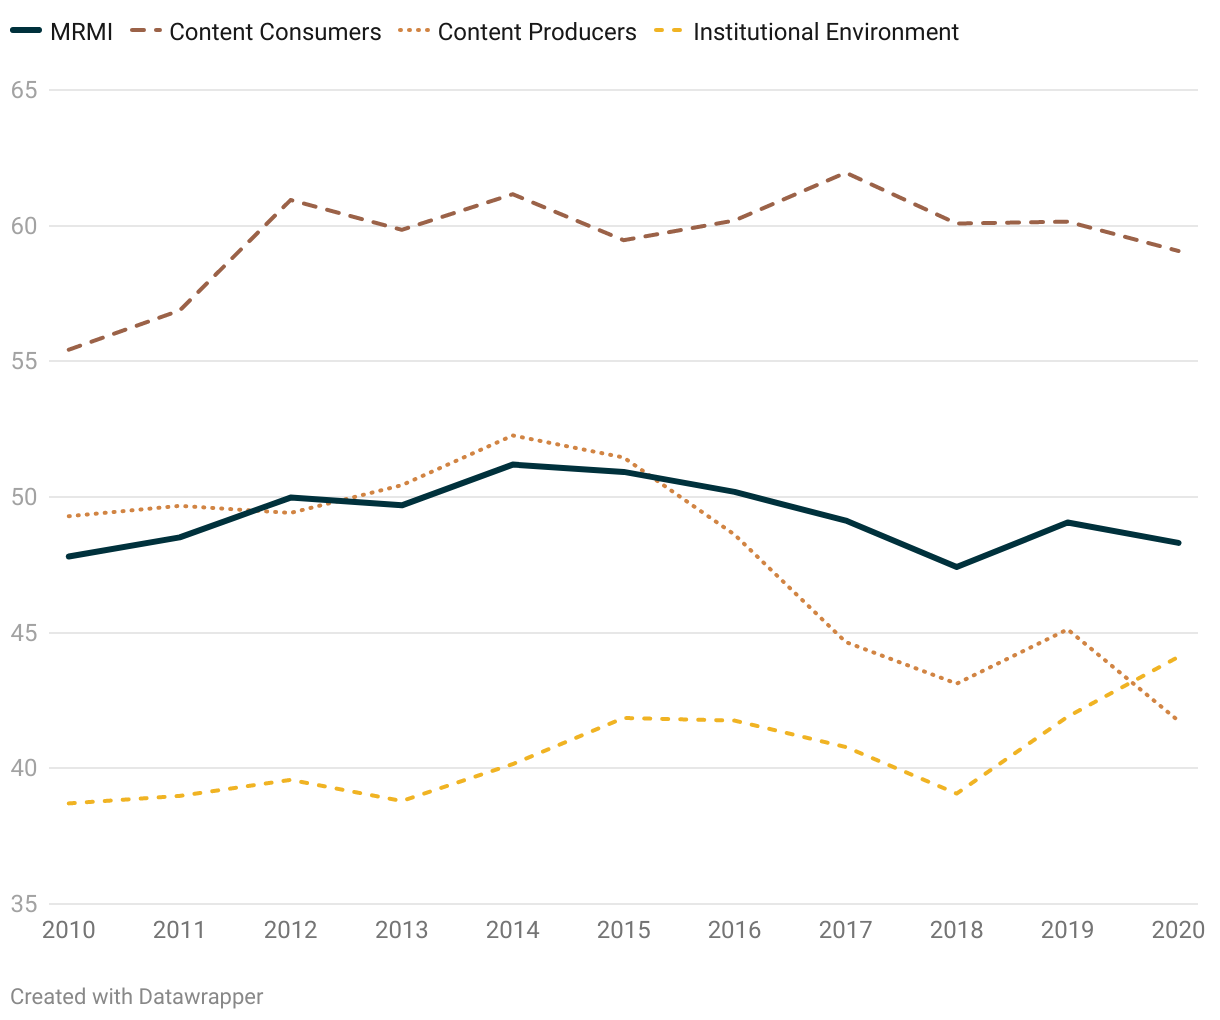
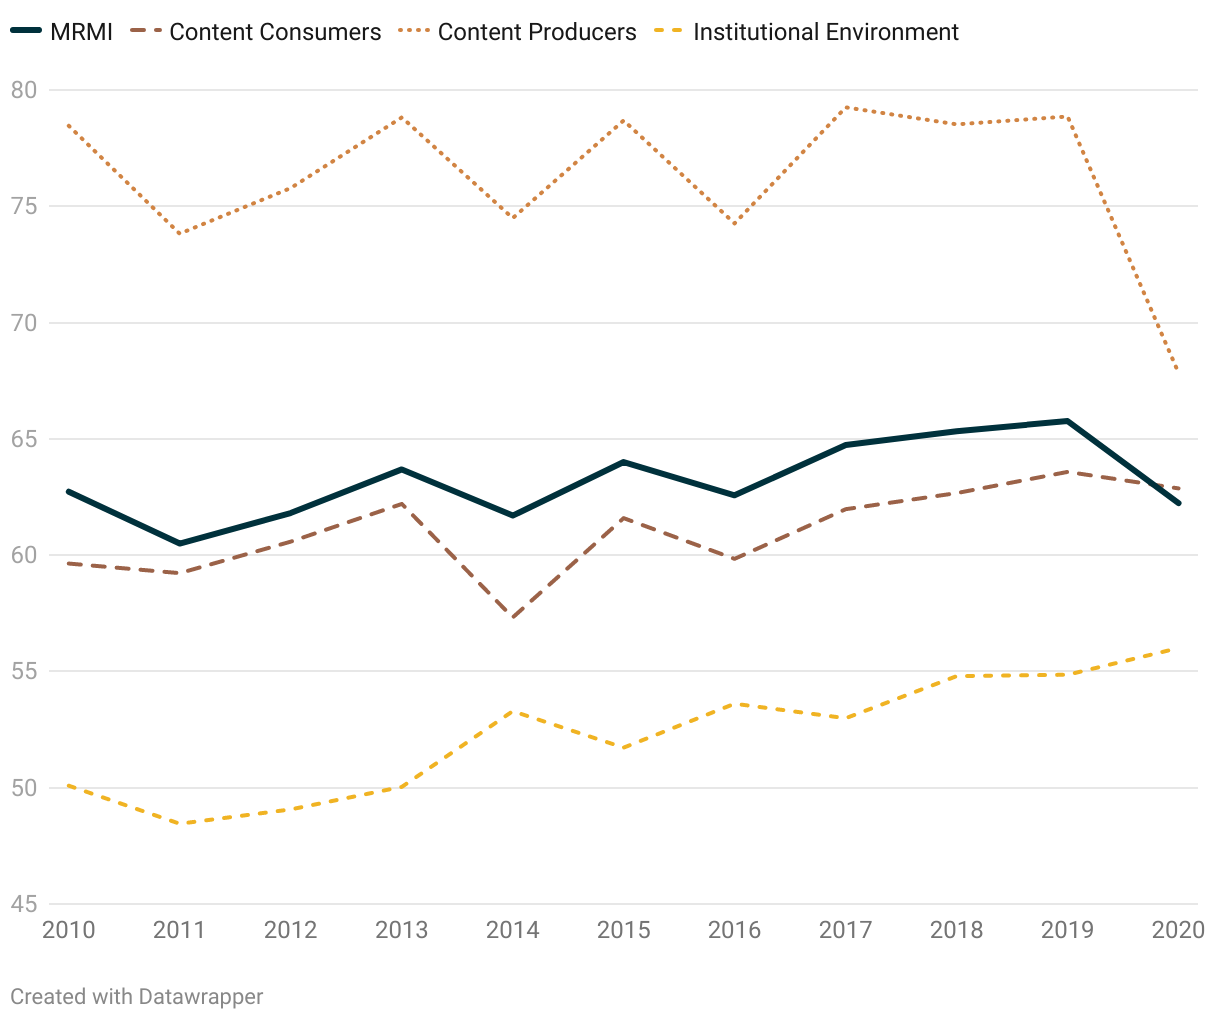
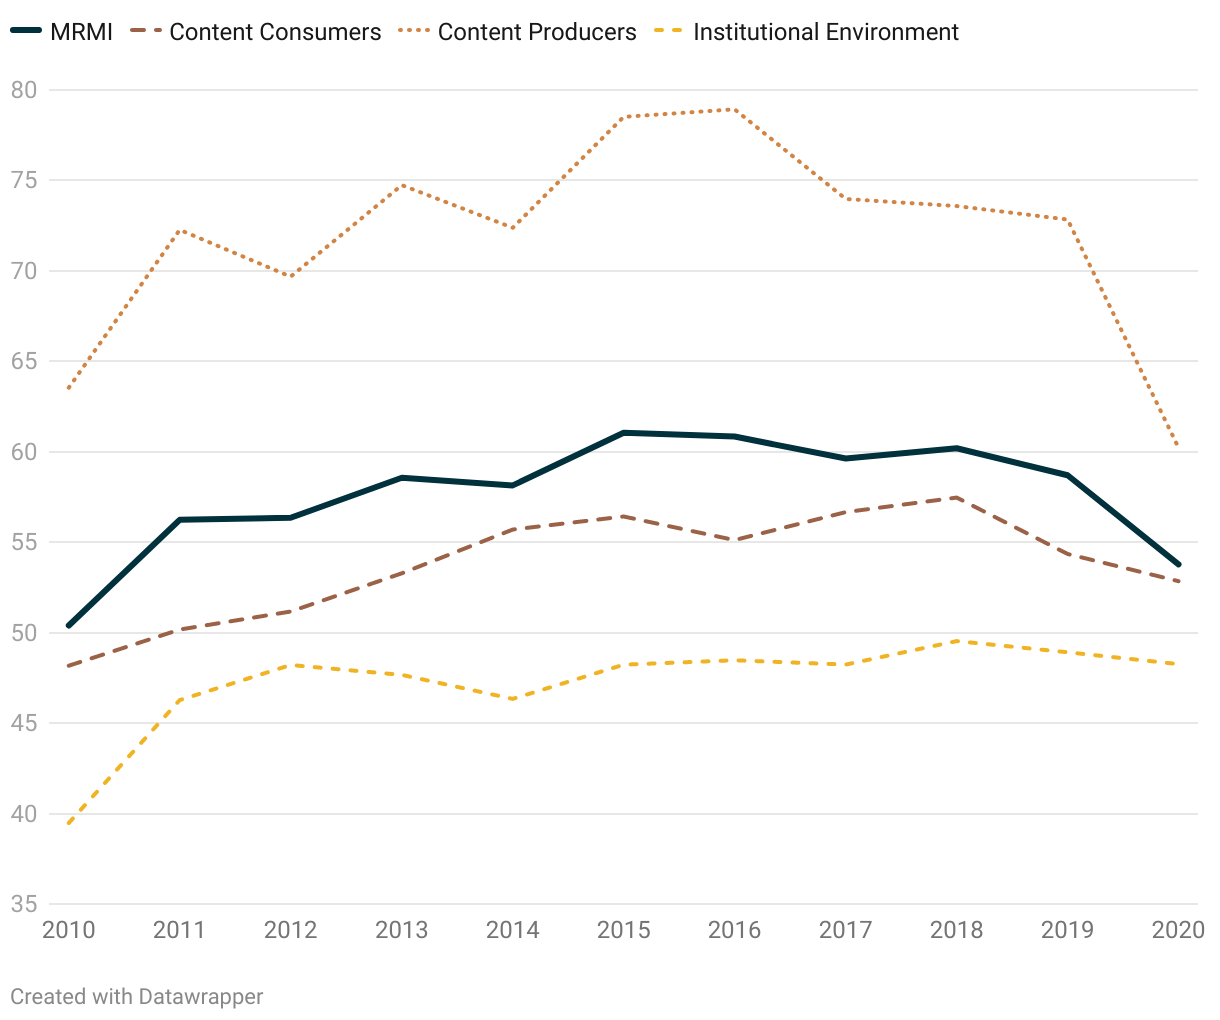
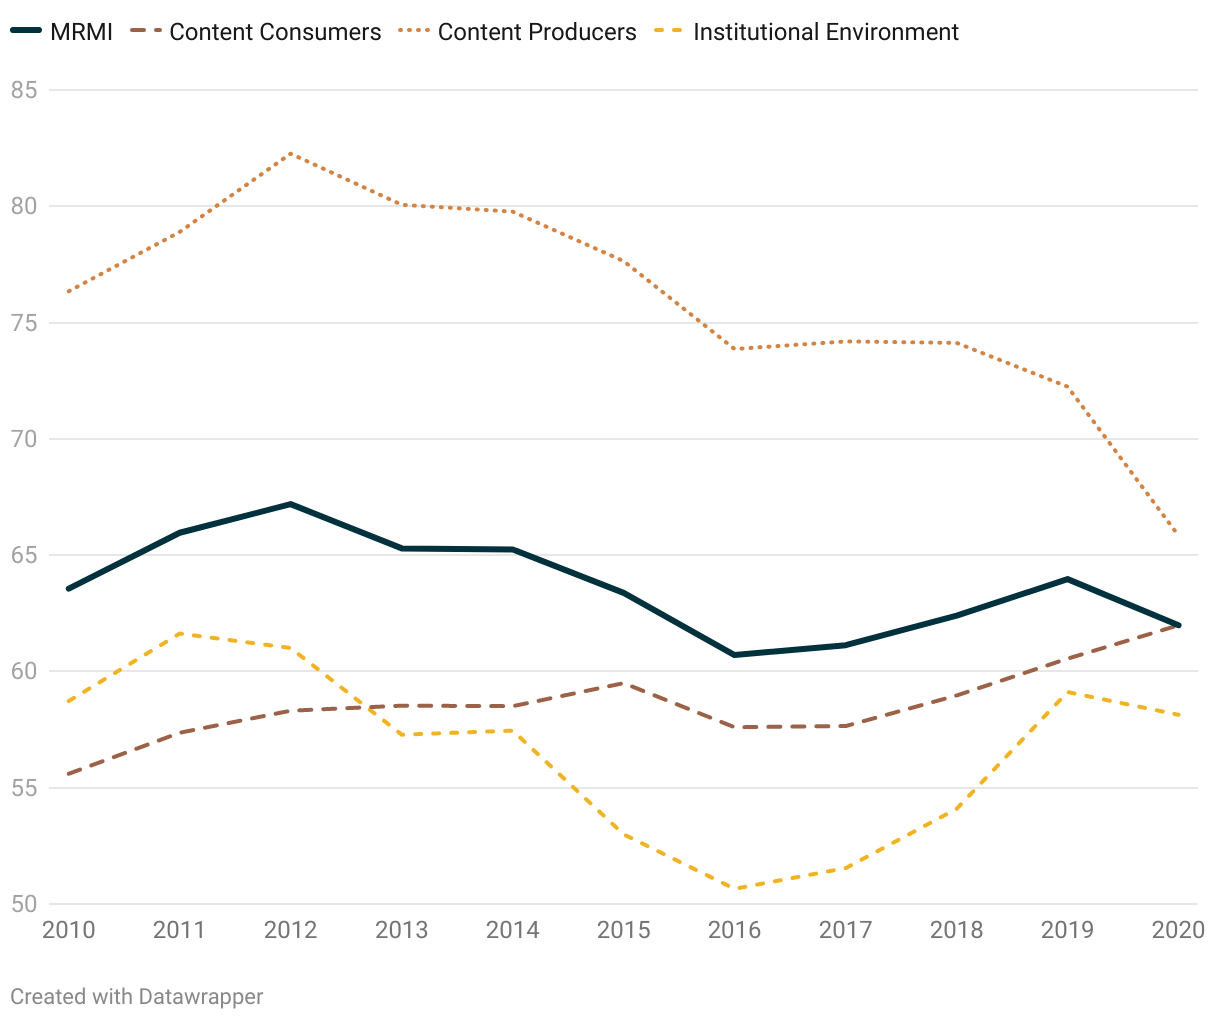
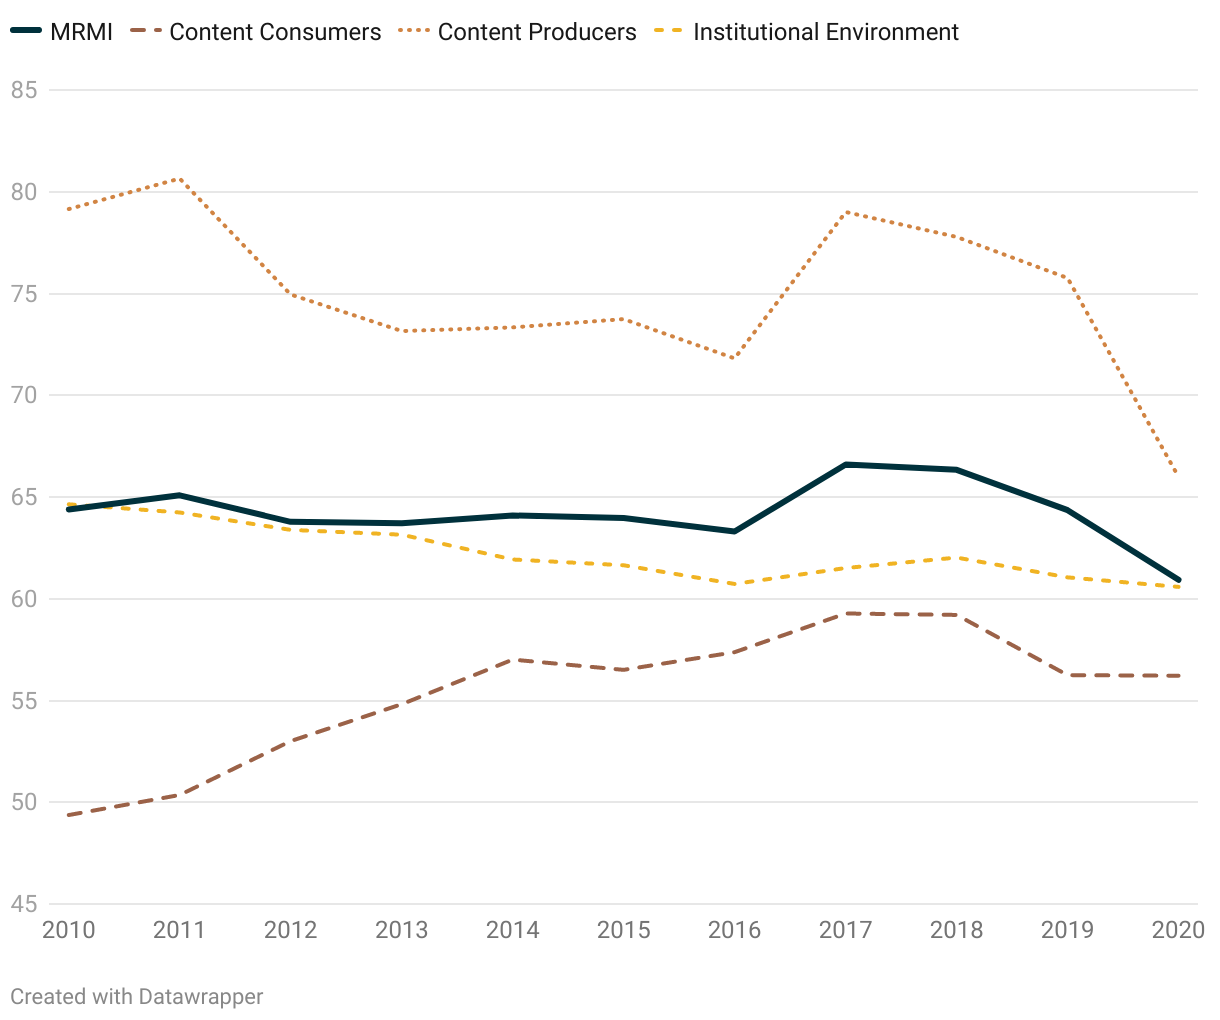
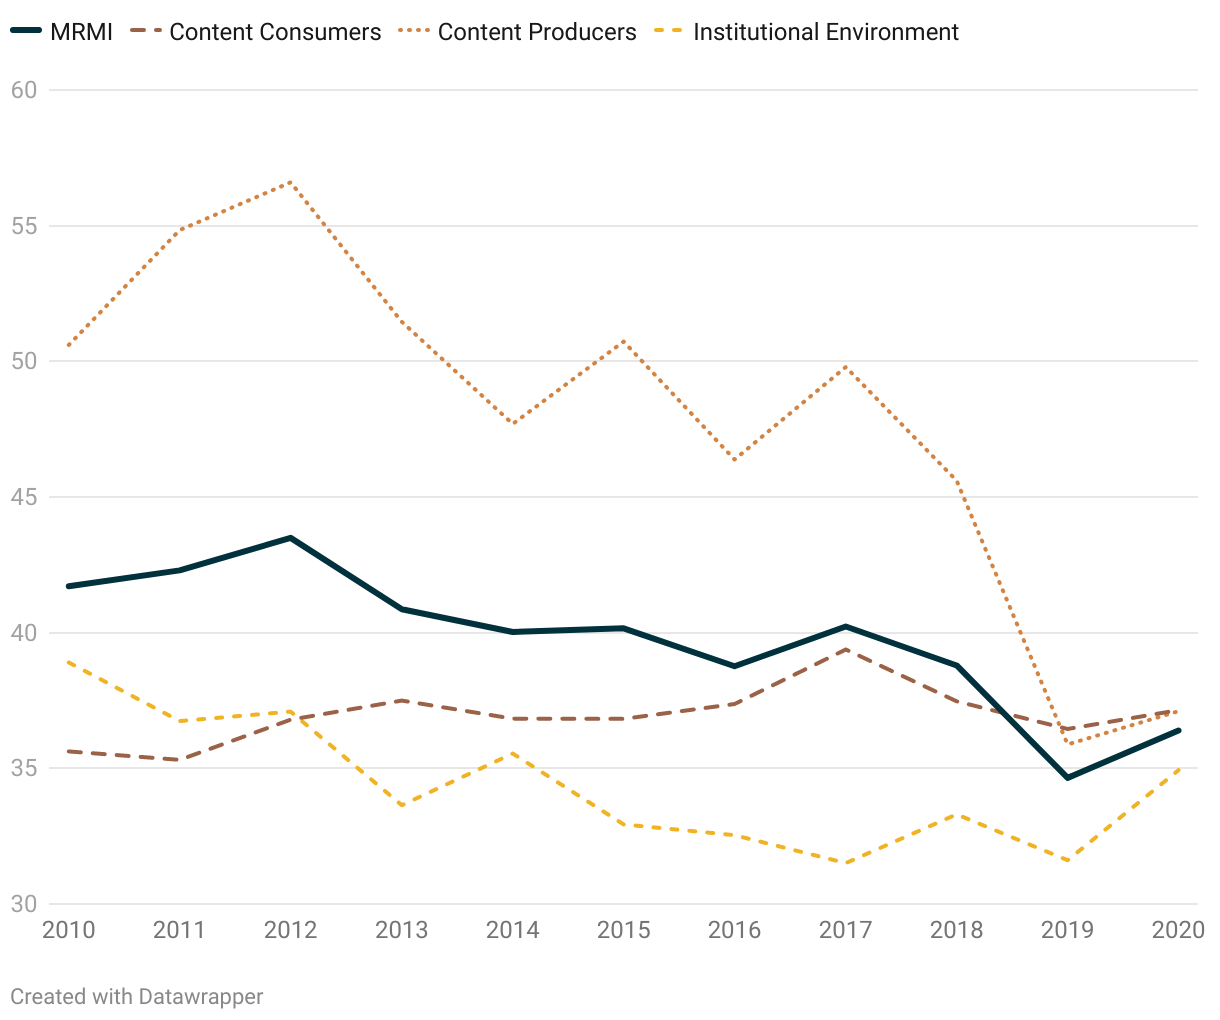
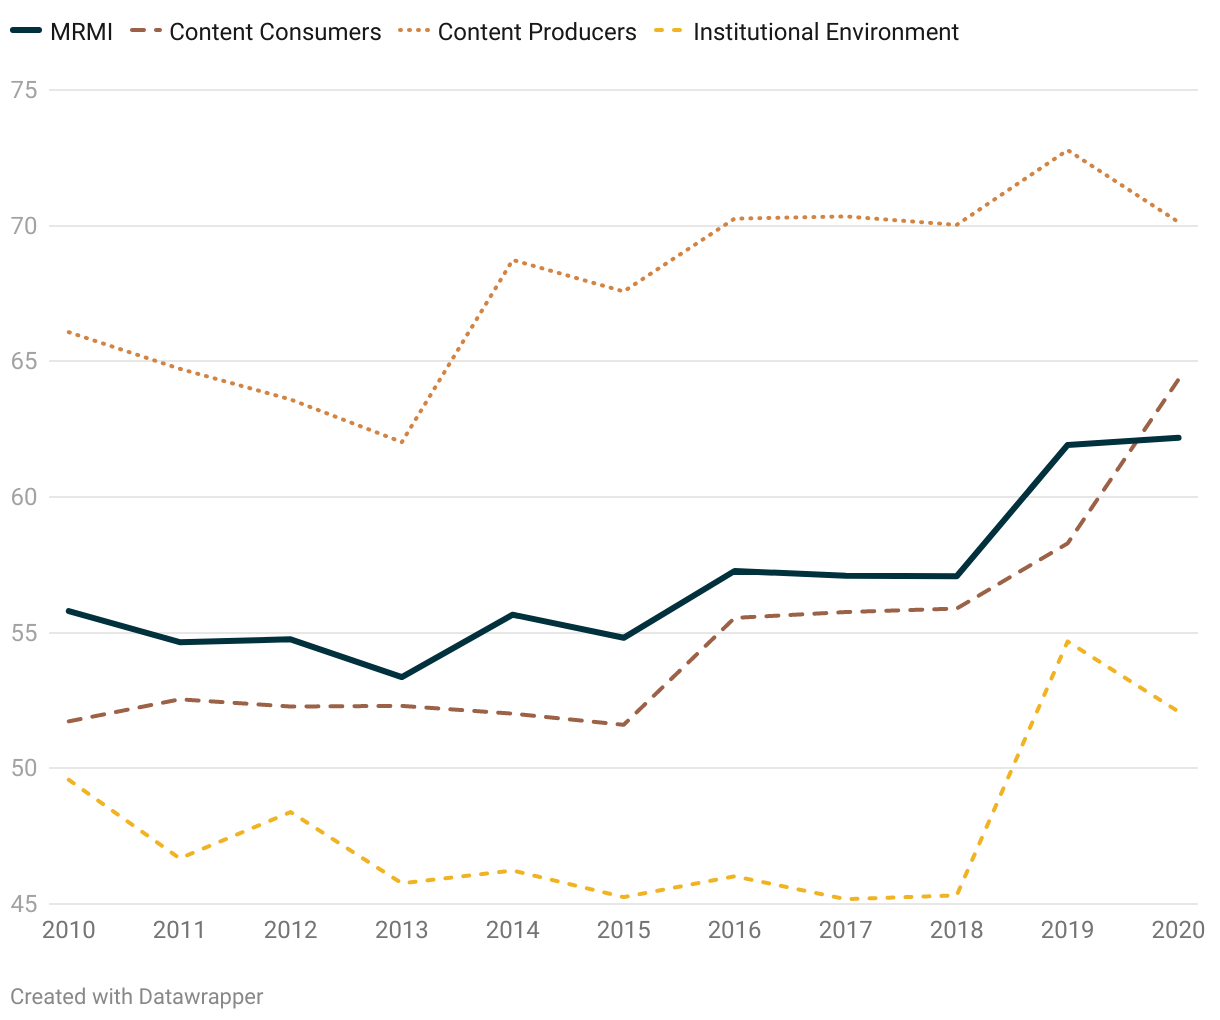
In Figure 5, we break down the MRMI Index by country and year using a sample of six countries to better understand some of the changes in media resilience described above. Along with providing a variation of subregions, these cases are illustrative of broader trends that we discuss below. This allows us to see dynamic change—rises, dips, and oscillations that average scores mask—in both a country’s full MRMI score, as well as its constituent parts, over time. We present a similar figure for all 17 E&E countries in the Appendix.
Figure 5 allows us to see variation both between and within countries among the three components. For example, while Uzbekistan’s components trend upwards, the country’s overall situation remains worse than in Serbia—a country that trends down over time. We find large variations among component scores in Armenia and Turkmenistan, while North Macedonia displays little variation among components across the sample.
Uzbekistan, the most-improved country in the sample, charted substantial gains in its overall MRMI score, following country-wide reforms pursued by Shavkat Mirziyoyev who took office after the death of long-time Uzbek leader Islam Karimov in 2016. The reforms included allowing the media to cover previously sensitive topics (IREX, 2018), freeing long-held journalists from prison (IREX, 2019d), and the establishment of a new 24-hour television station that covered the opposition party (Bowyer, 2018) and was allowed to criticize the government on occasion. One expert from IREX’s Media Sustainability report described the Uzbek press as “Snow White waking up from a long sleep” (IREX, 2019e). While experts remain cautious about media reforms, as Uzbekistan remains an autocracy, its improved MRMI score reflects these changes.
Another greatly improved country is Armenia, which charted substantial gains in its overall MRMI score in a relatively short time period following popular demonstrations by the Armenian people and the 2018 election of Nikol Pashinyan (a former journalist) as Prime Minister. This Velvet Revolution was notable for being absent of Russian intervention, and the protests focused largely on domestic issues rather than geopolitical ones that could invite external influence (A. O., 2018). Though Armenia today remains a strategic ally of Russia, this rejection of the post-Soviet oligarchy was an indication that Armenia sought greater self-determination and less outside influence within its borders. Given the general rejection of outside interference, it stands to reason we would see a push to remove or reduce this external influence from Armenia's media system. The MRMI and component scores seem to reflect these political and societal shifts.
Figure 5. Media Resilience Index and Components Trends in Six E&E Countries, 2010-2020
Armenia
Belarus
North Macedonia
Serbia
Turkmenistan
Uzbekistan
The sixth most improved country in the sample, Belarus, charted its biggest gains in its content producer score. [32] Not only did Belarus begin and end the period with the highest scores in this area, its performance also steadily improved in relation to others in the sample. Freedom House (2017) describes two changes that may have contributed to this improvement: Belarusian authorities lessened “outright pressure on independent media,” and state-owned media began “inviting nongovernmental experts, opposition politicians, and independent journalists to talk shows, bringing alternative opinions into the discussion.” Comparatively, Belarus’ content producers component score dropped to second place by the end of the period, as the country’s institutional environment deteriorated in 2020, likely due to the year’s unrest.
It appears that the nine-point decline in Serbia’s overall MRMI score was largely driven by a dramatic downgrade in the reliability, availability, and professionalism of its media. In other words, Serbia's content producer score steadily decreased from the highest-ranking component in 2010 to the lowest component in 2020. This trend is consistent with observations of media watchdog groups. IREX’s Media Sustainability Index on Serbia reported that the “number of quality journalism outlets [in Serbia] is shrinking,” and the Press Council reported thousands of ethical code violations by Serbian print media in 2018 that went unimpeded (IREX, 2019c, p. 6). Media have become polarized between dominant, divisive outlets and smaller, more professional outlets, with “nothing more than tabloids'' in the highest circulation (IREX, 2019c, pp. 6-7).
Like Serbia, Bosnia and Herzegovina (see Figures SA5b and SA7 in the Appendix) saw a significant decrease in its content producer component score, contributing to the decrease in its overall MRMI score. Once again, this appears to be consistent with observations of media watchdog reports. Media content in Bosnia and Herzegovina tends to be poorly researched, incomplete, and biased, although outlets do provide some coverage for most major events (IREX, 2019a, pg. 7). Much like Serbia, ethical codes are long established but rarely followed. Inflammatory speech that incites ethnic, religious, and racial divisions appears often, according to observers (IREX, 2019a, pg. 6). While the Communications Regulatory Agency does sanction the media for violating ethics codes, it only issues these sanctions after formal complaints and does not proactively monitor media content.
5. Key Takeaways
What do the results from the MRMI Index tell us about the bigger picture of media resilience in Europe and Eurasia over the last decade? Some countries are becoming more resilient in managing or repelling malign foreign influence in their media systems, while others are losing ground. Even among strong and weak performers overall, there is considerable variation in the underlying resilience of the three components of a healthy media system: consumers, producers, and institutions. In this section, we present three key takeaways from this analysis. These takeaways are based on our preliminary findings and may change as we further refine the index.
Takeaway #1: Media resilience is generally increasing across the region
The good news is that media systems in the region generally appear to be on the right track: overall MRMI scores improved for most countries over the last decade. Countries like Uzbekistan, Armenia, and Georgia lead the charge in demonstrating a regional shift towards greater resilience in the face of malign foreign influence. Reflecting this, the Caucasus and Central Asia are subregions that saw the biggest increases over time. In other words, we see evidence that the consumers of media content, those that produce it, and the institutions that regulate and govern these groups are adapting to the challenges posed by foreign actors who seek to influence their public discourse. The bad news is that media resilience requires a continuous investment of effort, as demonstrated by countries like Serbia, Tajikistan, and Montenegro that became less resilient over the last decade, as well as Turkmenistan, Uzbekistan—improved as it may be—and Azerbaijan, which still continue to lag far behind their peers.
Takeaway #2: Media-savvy citizens can facilitate increases in resilience, even in autocracies
Less democratic institutions and norms do not necessarily present an insurmountable barrier to improving media resilience to malign foreign influence. Uzbekistan and Belarus are cases in point: these authoritarian states saw sizable increases in their media resilience index scores over the last decade, despite widespread constraints on freedom of speech and media. Although democratic norms and institutions may be beneficial, these examples suggest that citizens can be important bulwarks of resilience even in autocratic countries with decidedly unfree media systems.
Takeaway #3: There is no one silver bullet when it comes to overall resilience: the relative strength of different components of media systems varies by country
The value of the MRMI Index is that we can see both a country’s overall resilience on average, as well as identify aspects of relative strength and weakness in its constituent parts. More resilient countries like Georgia have areas of weakness (content consumers) that can be masked by areas of strength (content producers). Conversely, even lagging countries like Belarus can have relatively bright spots of resilience (content consumers). Although the institutional environment is a persistent Achilles heel for most in the region, some countries show hardly any variation at all amongst the three media system components. Instead of simply presenting an overall score, the disaggregated MRMI Index data helps policymakers and researchers understand the drivers of media resilience in each country. In addition, it can assist the USG in customizing its programming to address unique points of vulnerability in each country’s distinct media system to improve resilience to malign foreign influence.
6. Conclusion
In this report, we presented results from our new Media Resilience to Malign Influence (MRMI) index in 17 E&E countries. Among the countries we analyzed, Georgia remains the country with the highest and most consistent levels of media resilience. Uzbekistan has made the greatest strides, while authoritarian Turkmenistan continues to lag behind. However, there is no room for complacency, as nascent democratic norms and unconsolidated institutions are easily contested by illiberal forces, either foreign or domestic. The stakes remain high for all countries in this region, and Serbia’s dramatic decline over the past decade underscores that media resilience requires continuous maintenance.
The objective of the MRMI Index is to provide better information for policymakers, advocates, and development partners to pinpoint areas of vulnerability and strength for countries to effectively manage or repel malign foreign influence in their media systems. The 17 countries in this initial iteration of the index are particularly relevant to this discussion of media resilience given their importance as battlegrounds for influence between Russia, the West, and even China. In future iterations, we hope to expand to additional countries in the Europe and Eurasia region and beyond, as well as continue to refine the index construction and presentation of results.
7. Works Cited
A.O. (2018). How Armenia’s revolution has been different. The Economist . Published May 25, 2018. URL: https://www.economist.com/the-economist-explains/2018/05/25/how-armenias-revolution-has-been-different .
Adsera, A., Boix, C., & Payne, M. (2003). Are you being served? Political accountability and quality of government. The Journal of Law, Economics, and Organization, 19(2), 445-490.
Benard, B. (2004). Resiliency: What we have learned. WestEd.
Bowyer, A. C. (2018), ‘Political Reform in Mirziyoyev's Uzbekistan: Elections, Political Parties & Civil Society,’ Central Asia- Caucasus Institute: Silk Road Studies Program. URL: www.silkroadstudies.org/publications/silkroad-papers-and-monographs/item/13284-political-refor .
Charron, N., & Lapuente, V. (2018). Quality of government in EU regions: spatial and temporal patterns. QoG Working Paper Series, 1(1).
Coppedge, M., Gerring, J., Knutsen, C. H., Lindberg, S. I., Teorell, J., Altman, D., Bernhard, M., Fish, M. S., Glynn, A., Hicken, A., Luhrmann, A., Marquardt, K. L., McMann, K., Paxton, P., Pemstein, D., Seim, B., Sigman, R., Skaaning, S., Staton, J., Wilson, S., Ziblatt, Z. (2020). V-Dem [Country–Year/Country–Date] Dataset v10 [Data set]. Varieties of Democracy Project. URL: https://doi.org/10.23696/vdemds20 .
Csaky, Zselyke. (2020) Dropping the Democratic Facade. Freedom House: Nations inTransit 2020 . URL: https://freedomhouse.org/report/nations-transit/2020/dropping-democratic-facade
DiResta, R., Shaffer, K., Ruppel, B., Sullivan, D., Matney, R., Fox, R., ... & Johnson, B. (2019). The tactics & tropes of the Internet Research Agency. URL: https://digitalcommons.unl.edu/cgi/viewcontent.cgi?article=1003&context=senatedocs .
Folke, C., Carpenter, S. R., Walker, B., Scheffer, M., Chapin, T., & Rockström, J. (2010). Resilience thinking: integrating resilience, adaptability and transformability. Ecology and society, 15(4).
Freedom House (n.d.). Freedom in the World . URL: https://freedomhouse.org/report/freedom-world .
Freedom House (2017). Freedom in the World: Belarus . URL: https://freedomhouse.org/country/belarus/freedom-world/2017 .
Freedom House. (2018). Freedom of the Press: A global survey of media independence [Data set]. URL: https://freedomhouse.org/reports/publication-archives .
Gallup. (2020). Gallup World Poll, 2006-2019 [Data set]. Washington, DC: Gallup Inc.
Hodžić, S. & Petković, B. (2020). Sustainability of professional journalism in the media business environment of the Western Balkans . EU Technical Assistance to Civil Society Organizations in the Western Balkans and Turkey. URL: http://tacso.eu/wp-content/uploads/2020/09/Sustainability-of-Professional-Journalism-in-WB-Study-final.pdf / .
Holling, C. S. (1996). Engineering resilience versus ecological resilience. Engineering within ecological constraints, 31(1996), 32.
IREX (2016) Media Sustainability Index: Moldova 2016, p. 3. URL: https://www.irex.org/sites/default/files/pdf/media-sustainability-index-europe-eurasia-2016-moldova.pdf.pdf .
IREX (2018) Media Sustainability Index: Uzbekistan 2018, p. 1 . URL: https://www.irex.org/sites/default/files/pdf/media-sustainability-index-europe-eurasia-2018-uzbekistan.pdf .
IREX (2019a). Media Sustainability Index: Bosnia & Herzegovina 2019 . URL: https://www.irex.org/sites/default/files/pdf/media-sustainability-index-europe-eurasia-2019-bosnia-herzegovina.pdf .
IREX (2019b). Media Sustainability Index: Georgia 2019 . URL: https://www.irex.org/sites/default/files/pdf/media-sustainability-index-europe-eurasia-2019-georgia.pdf .
IREX (2019c). Media Sustainability Index: Serbia 2019 . URL: https://www.irex.org/sites/default/files/pdf/media-sustainability-index-europe-eurasia-2019-serbia.pdf .
IREX (2019d). Media Sustainability Index: Uzbekistan 2019, p. 3 . URL: https://www.irex.org/sites/default/files/pdf/media-sustainability-index-europe-eurasia-2019-uzbekistan.pdf .
IREX (2019e). Media Sustainability Index: Uzbekistan 2019, p. 6 . URL: https://www.irex.org/sites/default/files/pdf/media-sustainability-index-europe-eurasia-2019-uzbekistan.pdf .
IREX (2021a) Vibrant Information barometer: Georgia, pp. 3-4. URL: https://www.irex.org/sites/default/files/pdf/vibe-georgia-2021.pdf .
IREX (2021b) Vibrant Information Barometer: Montenegro. URL: https://www.irex.org/sites/default/files/pdf/vibe-montenegro-2021.pdf .
Keller, F. B., Schoch, D., Stier, S., & Yang, J. (2020). Political Astroturfing on Twitter: How to coordinate a disinformation campaign. Political Communication , 37 (2), 256-280. URL: https://doi.org/10.1080/10584609.2019.1661888 .
Open Data Kosovo (2019) Corruption in Kosovo: A Comparative Analysis. URL: https://opendatakosovo.org/portfolio/corruption-in-kosovo-a-comparative-analysis/ .
Radio Free Europe (2018, January 11) Moldovan parliament speaker passes law against Russian propaganda. URL: https://www.rferl.org/a/moldova-parliament-speaker-approves-russia-media-law/28966975.html .
Ravitsky, M. (2018, April 16) Global lessons on media manipulation from Eastern Europe . Freedom House. URL: https://freedomhouse.org/article/global-lessons-media-manipulation-eastern-europe .
Rosca, A. (2017, September 13). Media in Moldova: Between freedom and monopoly. Foreign Policy Research Institute. URL: https://www.fpri.org/article/2017/09/media-moldova-freedom-monopoly/ .
Stier, S. (2015). Democracy, autocracy, and the news: The impact of regime type on media freedom. Democratization, 22(7): 1273-1295. URL: https://www.tandfonline.com/doi/abs/10.1080/13510347.2014.964643 .
Tannenberg, M., Bernhard, M., Gerschewski, J., Lührmann, A., & von Soest, C. (2019, April 25). Regime Legitimation Strategies (RLS) 1900 to 2018). V-Dem Working Paper 2019:86. URL: http://dx.doi.org/10.2139/ssrn.3378017 .
Transparency International (2014). Corruption risks in Eurasia: Spotlight on Azerbaijan and Moldova. Published July 3, 2014. URL: https://www.transparency.org/en/news/corruption-risks-azerbaijan-moldova# .
UCLA Statistical Consulting Group. (n.d.) Multiple imputation in STATA. URL: https://stats.idre.ucla.edu/stata/seminars/mi_in_stata_pt1_new/ .
UNDP (2020). Georgian media fall short on analysis in election coverage. Published September 23, 2020. URL: https://www.undp.org/georgia/publications/media-monitoring-2020-parliamentary-elections-georgia .
Walker, C. (2018). What Is "Sharp Power"?. Journal of Democracy, 29(3), 9-23. URL: https://muse.jhu.edu/article/698914 .
Whitten-Woodring, J., & Van Belle, D.A. (2017). The correlates of media freedom: An introduction of the global media freedom dataset. Political Science Research and Methods, 5(1): 179-188. URL: https://doi.org/10.1017/psrm.2015.68 .
World Bank (2020). World Development Indicators. URL: https://datacatalog.worldbank.org/dataset/world-development-indicators .
Appendix
1. Overview
The appendix is divided into the following seven sections: Index Variables and Dataset Completeness, Completeness by Various Dataset Attributes, Cronbach’s Alpha, MRMI Index by World Bank Income Classification, MRMI Index Components and Typical Variation, MRMI Index Snapshots and Change Over Time by Component, and Detailed Description of Variables Used in Index. Each section contains additional figures or tables to provide further detail on the creation of the Media Resilience to Malign Influence (MRMI) Index or to supplement the findings.
In the Index Variables and Dataset Completeness section, Table SA1 contains a detailed breakdown of the elements and data sources that constitute the index, as well as the percentage of observations available with respect to the countries and years of our sample (17 E&E countries from 2010 to 2020). In Table SA1 we assign each element an Element ID to help readers locate the variable description(s) in the Detailed Description of Variable section below.
In the Completeness by Various Dataset Attributes section, Figure SA1 and Table SA2 expands on the above section by providing specific information on the completeness of the data collection, in terms of (i) overall completeness, (ii) subregion, (iii) component, (iv) country, (v) year, and (vi)country-year observation.
In the Cronbach’s Alpha section, we show the results from our analyses looking at the dataset’s internal consistency using the Cronbach’s Alpha test (Table SA3).
Next, in the MRMI Index by World Bank Income Classification section, Figure SA2 shows a bar graph comparing MRMI scores by income level classification.
In the section MRMI Index Components and Typical Change, we include Figures SA3a-b that break down the average Media Resilience to Malign Influence (MRMI) score by three components in all 17 E&E Countries. Also in this section is Table SA4 which displays the standard deviation of the three averages, aggregated components for each country.
Then, in the section MRMI Index Snapshots and Change Over Time by Component, we include Figures SA4a-c which display the averages of the MRMI Index component scores for the entire time period to supplement Figure 2 in the report; Figures SA5a-c show change in average component scores from 2010 to 2020 to supplement manuscript Figure 3 in the report; Figure SA6a-c shows change pots from 2010 to 2020 for the region-aggregated MRMI score along with the region’s four subregion scores‒similar to Figure 4b in the report. Figure SA7 shows the MRMI Index score and its constituent parts over time from 2010 to 2020 in all 17 E&E countries.
Finally, the Detailed Description of Variable section of this report . There, each variable is listed along with its source, raw data range, imputation method(s) used, and the available years and countries.
2. Index Variables and Dataset Completeness
Table SA1. Media Resilience Taxonomy: Components, Domains, and Elements of Resilience
Components |
|
Domain |
|
| Element ID: Element Name Element description | |
| Name of variable measuring element* * Asterisk indicates variables used in two elements. | Percent Complete |
Content Consumers |
|
Media Consumption |
|
| E1: Average number of sources consumed by end users Societies that consume a higher number of media sources are more resilient in that they are less likely to be influenced by any single source in isolation. | |
| MSI: Plurality of source* | 88.24% |
| VDem: Alt. sources* | 100% |
| E2: Universal media access Societies where marginalized groups systematically do not have access to media create silos of information and encourage acceptance of misinformation. | |
| VDem: Exclusion by social group | 100% |
| VDem: Exclusion by location (Urban-Rural) | 100% |
| E3: Access to mobile phones Societies with citizens with more access to mobile phones and Internet connections are more resilient to foreign, malign influence because their likelihood to find counterinformation to misinformation increases. | |
| GSMA: Mobile Connectivity Index | 56.15% |
| UN: Telecommunication infrastructure index | 51.34% |
| E4: Fact-checking / verification behavior of media consumers Societies with higher reported fact-checking behavior are more resilient in that they verify information before consuming it. | |
| N/A; Unable to find data | |
Consumer Attributes |
|
| E5: Education and media literacy Societies with higher levels of education and information/media literacy are more resilient because they are better able to judge the reliability/soundness of the media they consume. | |
| MSI: Plurality of source* | 88.24% |
| VDem: Alt. sources* | 100% |
| GWP: % studied beyond highschool | 97.33% |
| UNDP: Education index | 85.56% |
| UN: Human capital index | 51.34% |
| VDem: Education equality | 100% |
| World Bank: Human capital index | 28.34% |
| E6: Trust in others Societies with a higher degree of distrust in others are less resilient in that they are more likely to be vulnerable to misinformation and disinformation. | |
| BTI: Social capital | 100% |
| E7: Level of income Societies where individuals have higher levels of disposable income are more resilient because they can more easily consume/purchase access to a variety of media sources. Meeting basic needs and possessing more disposable income discourages seeking false narratives that explain economic hardships | |
| VDem: Equal distribution of resources | 100% |
| WDI: GINI | 61.5% |
| WDI: GDP p/c (constant 2015 US$) | 99.47% |
| E8: Economic stability Societies with greater economic stability are more reliant to shocks that cause temporary/long term economic duress that makes individuals more prone to disinformation. | |
| BTI: Monetary and fiscal stability | 100% |
| GWP: Financial life index | 97.33% |
| GWP: Life evaluation index | 97.33% |
| WDI: GDP p/c, change (constant 2015 US$) | 99.47% |
Societal Norms |
|
| E9: Political fragmentation / partnership More politically polarized societies may more easily be swayed by mis- or disinformation if it reinforces their priors to believe the worst of those with whom they disagree. | |
| VDem: DSS, Online media fractionalization | 100% |
| VDem: Political polarization | 100% |
| E10: National identity/ethnolinguistic fractionalization More ethnically polarized societies may more easily be swayed by mis- or disinformation if it reinforces their priors to believe the worst of those with whom they disagree or distrust. | |
| AidData: Proven social trust | 100% |
| VDem: Societal polarization | 100% |
| E11: Citizen participation in society Societies with higher levels of citizen participation may be more resilient to malign influence as engaged citizens are more likely to recognize disinformation when they see it and be less susceptible to manipulation. | |
| GWP: Civic engagement index | 97.33% |
| UN: E-Participation index | 51.34% |
Content Producers |
|
Media Reliability |
|
| E12: Public trust in media as an institution Higher public trust in the media as an institution may signal greater resilience in that media outlets are demonstrating responsible behavior in their reporting practices. | |
| GWP Media Freedom | 79.14% |
| E13: Market dominance vs fragmentation Societies where a small number of media companies own the majority of information channels are less resilient as it is easier for domestic or external actors to co-opt just a few actors to influence the media narrative. | |
| MSI: Business management* | 88.24% |
| E14: Corruption within journalism Higher prevalence of corruption among journalists may signal lower resilience within society as media is more easily co-opted by malign interests. | |
| VDem: Media corruption | 100% |
| E15: Transparency of media outlets Higher transparency of media outlet ownership signals greater resilience in that consumers can more easily determine the reliability of the information. | |
| N/A; Unable to find data | |
Media Availability |
|
| E16: Number of available media outlets for consumers to choose from Societies that offer citizens more media and content options to consume are more resilient in that they are less likely to be influenced by any single source. | |
| MSI: Plurality of news sources* | 88.24% |
| VDem: Alt. sources* | 100% |
| E17: Ideological diversity of available media outlets for consumers to choose from Societies that offer citizens a greater diversity of media options (across the political or ideological spectrum) are more resilient in that they are less likely to be influenced by any single viewpoint. | |
| VDem: DSS, Online media perspectives* | 100% |
| VDem: Print/Broadcast perspectives* | 100% |
Media Professionalism |
|
| E18: Journalism education Societies that have a greater levels of journalism training (both through university on on-the-job training) are more resilient because they learn the value and role of their profession before formally beginning. | |
| N/A; Unable to find data | |
| E19: Journalism as a profession Societies that have a greater preponderance of professional (rather than amateur) journalists are more resilient because media outlets are bound by standards of professionalism. | |
| MSI: Professionalism journalism | 88.24% |
| E20: Journalists as watchdogs Societies where journalists can freely investigate newsworthy stories are more resilient because they expose malign actors and/or government apathy in reacting to them. | |
| VDem: Print/Broadcast critical of govt | 100% |
| E21: Diversification of media revenues Societies where media outlets are less reliant on revenues from any one particular source are more resilient in that journalists are better able to preserve their editorial independence from undue influence. | |
| MSI: Business management* | 88.24% |
| E22: Journalism ethics and accountability Societies where more journalists are held accountable for standards of professionalism by their peers are more resilient because they are more focused on ensuring the accuracy and fairness of reporting. | |
| N/A; Unable to find data | |
Institutional Environment |
|
Media Independence |
|
| E23: Media freedom Societies with higher levels of press freedom are more resilient because they have greater access to investigative journalism, critical reports of powerful individuals, and a diversity of viewpoints in media content. | |
| Freedom House: NIT, Independent media | 100% |
| Reporters Without Borders (RSF): Press Freedom Index | 100% |
| E24: Media ownership diversity Societies with more diverse media owners are more resilient because they have greater access to investigative journalism, critical reports of powerful individuals, and a diversity of viewpoints in media content. | |
| VDem: DSS, Online media perspectives* | 100% |
| VDem: Media bias | 100% |
| VDem: Print/Broadcast perspectives* | 100% |
| VDem: Self-censorship | 100% |
| E25: Media insulation Societies where the media is more insulated from political retaliation or pressure from government are more resilient because they allow for greater diversity of views. | |
| VDem: DSS, Defamation protection | 100% |
| VDem: Harassment of journalists | 100% |
Government Efficiency & Responsiveness |
|
| E26: Corruption levels in government Higher prevalence of corruption within government institutions may signal lower resilience within society as officials that regulate the media are more easily co-opted by malign interests or less responsive to citizens. | |
| VDem: DSS, Abuse of defamation by elites | 100% |
| VDem: Govt corruption index | 100% |
| WGI: Control of Corruption | 100% |
| WGI: Government effectiveness | 100% |
| WGI: Regulatory quality | 100% |
| E27: Fact-checking and disinformation efforts Higher prevalence of fact-checking and disinformation efforts instituted by government institutions signals higher resilience to malign influence as there are greater safeguards in place to ensure the accuracy of information, which incentivizes media producers to verify their content. | |
| VDem: DSS, Govt disseminates false info (social media) | 100% |
| VDem: DSS: Foreign govt disseminates false info (social media) | 100% |
| VDem: DSS, Foreign ads | 100% |
| VDem: DSS, Govt capacity to regulate online content | 100% |
| UN: E-Government index | 51.34% |
Political Legitimacy & Accountability |
|
| E28: Democracy levels Societies with higher levels of democracy are more resilient because citizens have a stake in government as a greater ability to freely speak, discuss, and debate their views. | |
| VDem: Deliberative democracy | 100% |
| VDem: Participatory democracy | 100% |
| E29: Trust in political institutions Higher public trust in political institutions may signal greater resilience in that government actors are seen as promoting accountability among companies and individuals. | |
| GWP: Approval of own government | 83.96% |
| GWP: Disapproval of own government | 86.1% |
| GWP: Govt corruption perception | 86.1% |
Table Note: Element ID allows the reader to see which variables we use for each element. See section Variables Used in Index later in the Appendix. An * indicates variables used in two elements. Elements color-coded red indicate no data found. Percentage refers to how complete the variable covers all country-years in the data set (i.e., 17 E&E countries from 2010-2020).
3. Completeness by Various Dataset Attributes
Figure SA1 below presents ‘completeness’ of the 58 variables that we use to create the Media Resilience to Malign Influence (MRMI) index by (i) overall ‘completeness’, (ii) component, (iii) country, (iv) subregion, and (v) year.
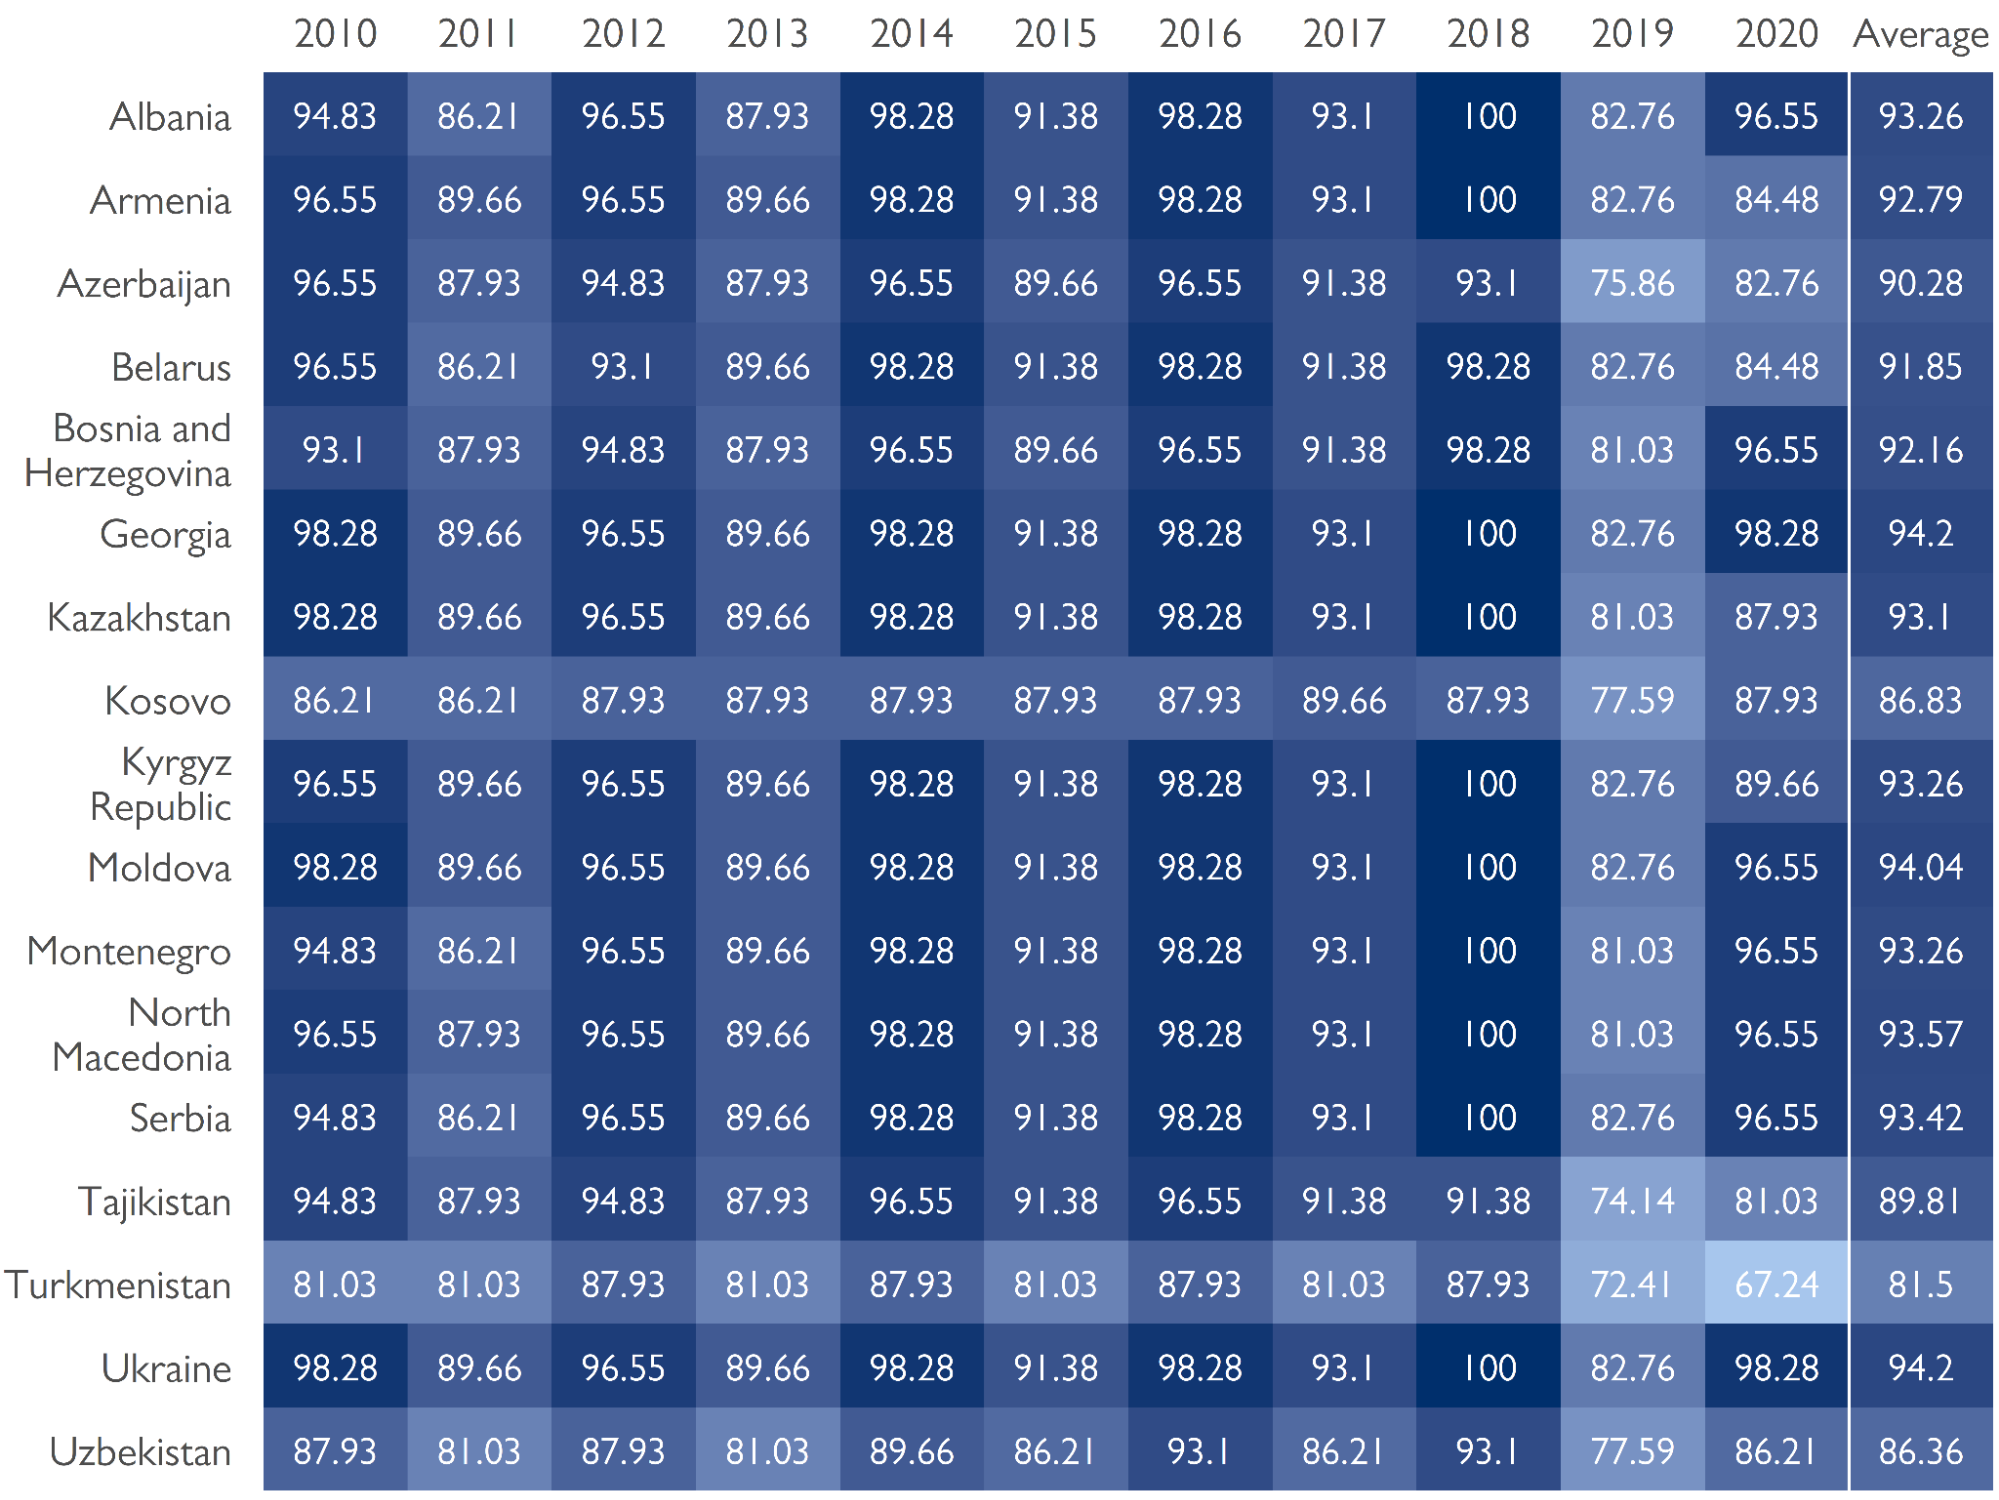
Table SA2 presents the completeness of each country-year dyad. Of the 58 variables we used to create the index, it shows how many data points from those 58 variables were available for each observation (that is, country-year dyad).
Figure SA1. Completeness by Several Dataset Attributes
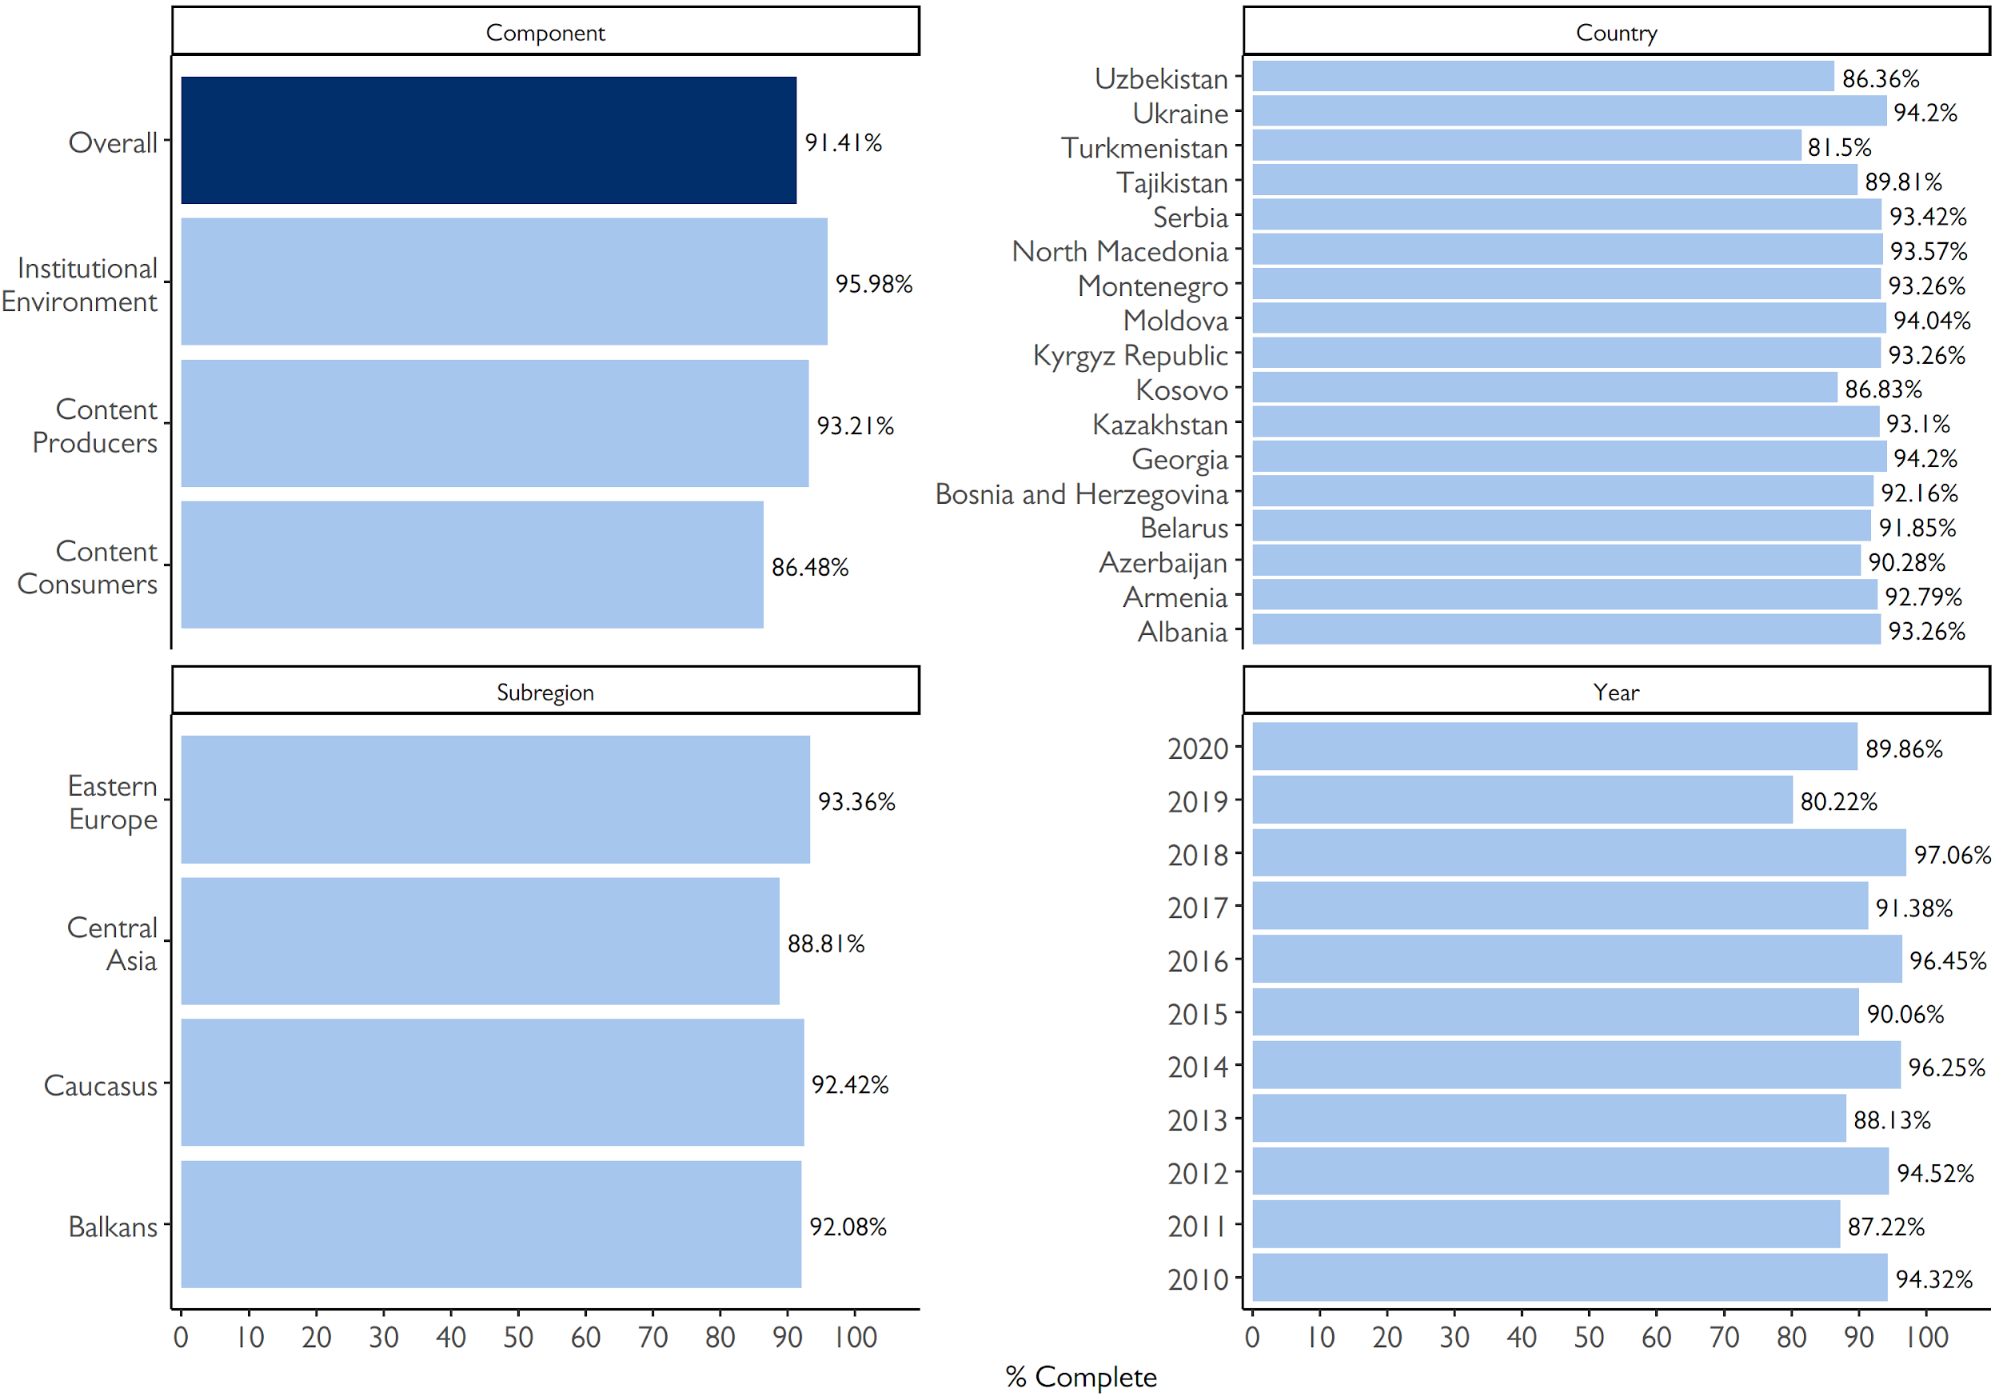
Table SA2. Completeness by Country-Year Dyads
4. Cronbach’s Alpha
We analyze the dataset using Cronbach's alpha test. Cronbach’s alpha is “a measure of internal consistency” that evaluates “how closely related a set of items are as a group.” [33] In other words, it assesses the reliability of how well the variables we selected for the MRMI Index measures a single concept (in this case, media resilience). Cronbach’s alpha coefficient ranges from 0 to 1, with results above the 0.7 threshold universally accepted to be sufficiently consistent/reliable. [34] We provide the results from our test in Table SA3 below.
In examining the overall MRMI Index score, we find the coefficient of the overall index to be above .8 using two different approaches. The first approach uses the three aggregated components as inputs (T1 in Table SA3), while the other uses the nine aggregated domains as inputs (T2 in Table SA3). To examine the components, we use the aggregated domains as the test inputs and find that all components have a coefficient above .7 (T3-5 in Table SA3). Overall, the results indicate a strong reliability with the variables we selected both within the components and for the overall index, providing validity to our taxonomy and data collection.
Table SA3. MRMI Index Cronbach Alpha Tests
|
Test |
Cronbach's Alpha |
|
T1. MRMI Index (full, comp) |
0.8096 |
|
T2. MRMI Index (full, domain) |
0.9286 |
|
T3. Content Consumers |
0.7513 |
|
T4. Content Producers |
0.9587 |
|
T5. Institutional Environment |
0.7527 |
Table Note: This table features Cronbach Alpha tests for the overall MRMI Index and the three components. Cronbach Alpha coefficients above .7 are considered reliable, and all tests in Table SA3 are above .7. For the components, we use the constituent domain variables to run the test. For example, for Content Consumer (alpha 0.7513, T3), we run the test for the aggregate measure of the components of three domains (i) media consumption, (ii) consumer attributes, and (iii) societal norms. For MRMI Index (full, domain), we do the same running all nine aggregate domain variables (T2). For the MRMI Index (full, comp), we run the test with the three aggregated component variables (T1). The table indicates strong internal consistency within each component and for the full MRMI Index.
5. MRMI Index by World Bank Income Classification
Figure SA2. MRMI Index Scores by Income Level in 17 E&E Countries
6. MRMI Index Components and Typical Change
Figures SA3a & SA3B. MRMI Overall and Three Component Average Scores (2010-2020)
Ranked Across the Region
Grouped by Subregion
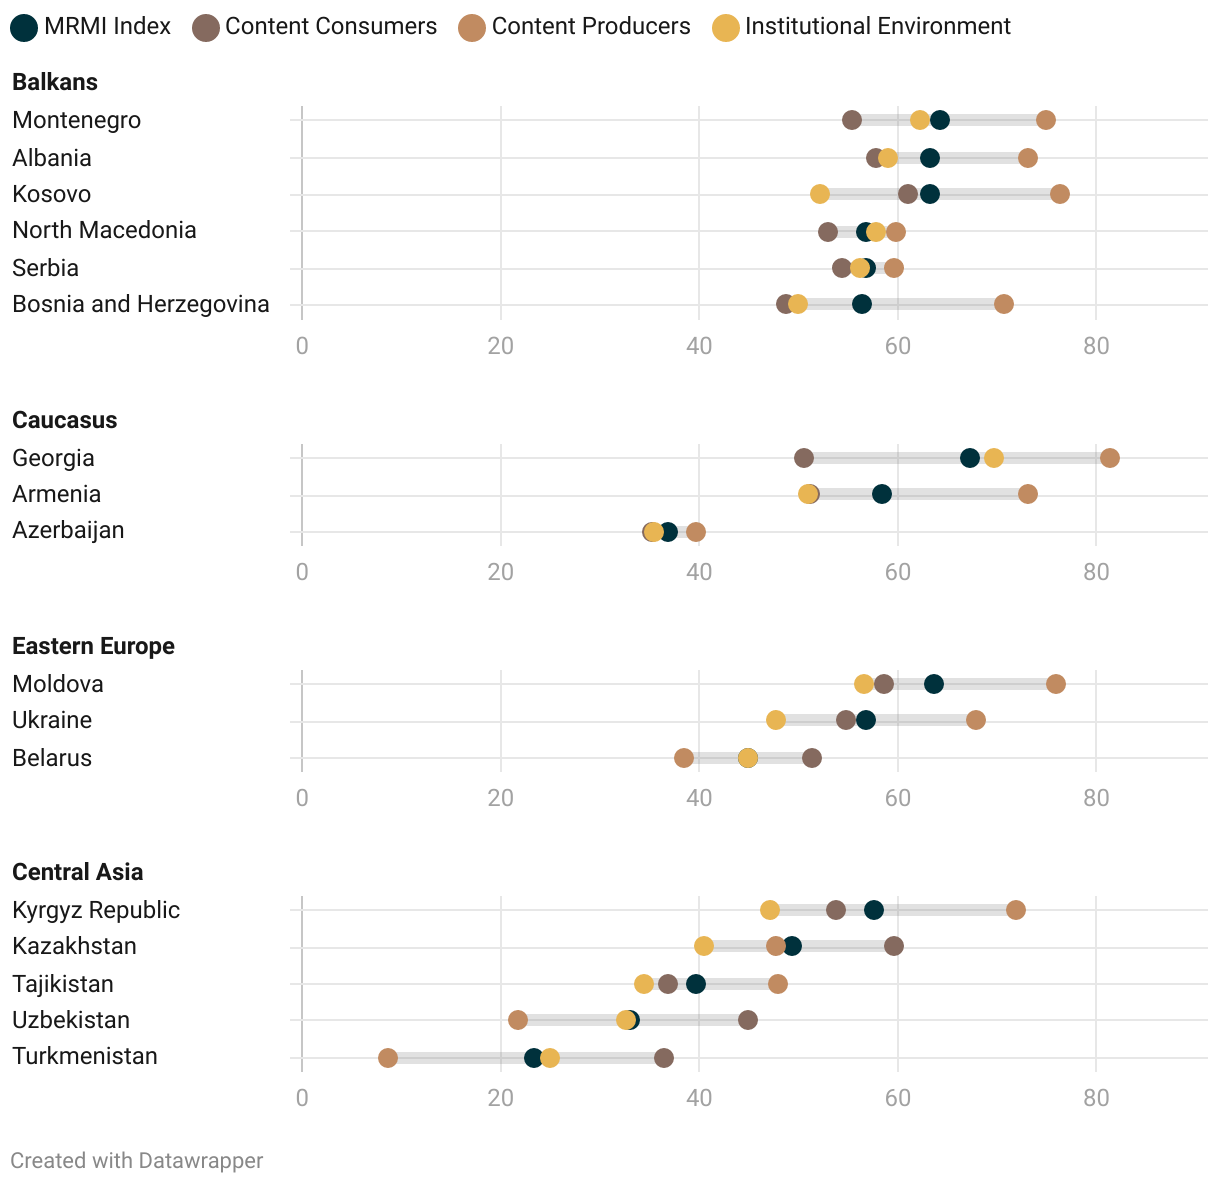
Table SA4: Variation among components in each country
|
Country |
Variation |
Country |
Variation |
Country |
Variation |
|
Georgia |
12.68559 |
Uzbekistan |
9.424834 |
Tajikistan |
5.834592 |
|
Turkmenistan |
11.41137 |
Moldova |
8.679336 |
Belarus |
5.294981 |
|
Kyrgyzstan |
10.42419 |
Ukraine |
8.329987 |
North. Macedonia |
2.919052 |
|
Armenia |
10.41591 |
Montenegro |
8.134081 |
Serbia |
2.145217 |
|
BiH |
10.0307 |
Kazakhstan |
7.844443 |
Azerbaijan |
1.984109 |
|
Kosovo |
9.914842 |
Albania |
6.949321 |
|
|
Table Note: This table displays the standard deviation of the three component scores (see discussion around Figure 3 in the report). To get these numbers, we take the average score of each component by country, then take the standard deviation of those three figures. Since they are on the same 0-100 scale, the resulting number indicates the comparable, typical change among the three components. For example, we see from Figure SA3b above that Montenegro’s averaged component scores are 55.4 (Content Consumers), 75.03 (Content Producers), and 62.26 (Institutional Environment). The standard deviation of 55.4, 75.03, and 62.26 is 8.134081, as seen in Table SA4 above. Large scores indicate greater variation with countries in order of greater variation to less.
7. MRMI Index Snapshots and Change Over Time by Component
In this section, we present additional figures that we derived from the MRMI Index. Figures SA4a-c show the averaged component scores for each country in our sample. These are like Figure 2 in the manuscript but broken down by component: Content Consumers (Figure SA4a), Content Producers (Figure SA4b), and Institutional Environment (Figure SA4c).
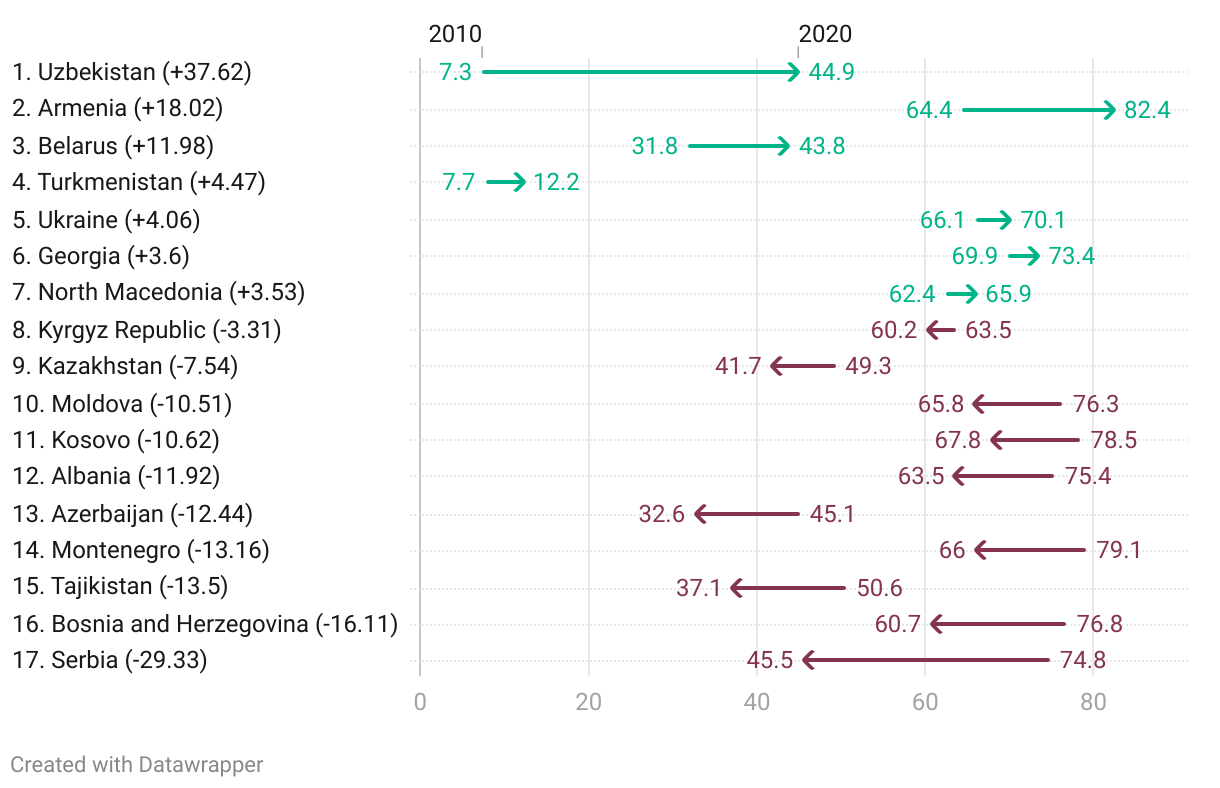
Figures SA5a-c show the 2010 and 2020 comparison among the 17 E&E countries presented by component, like Figure 4a in the report. Similarly, Figures SA6a-c show the 2010 to 2020 comparisons of overall change by component for all subregions, like Figure 4b in the report.
Finally, Figure SA7 presents the trend for the overall MRMI score and three components over time in all 17 E&E countries over time from 2010 to 2020. This is similar to Figure 5 in the report but with all countries in our sample.
Figure SA4a. MRMI Index Snapshot by Component (Content Consumers)
Ranked Across the Region
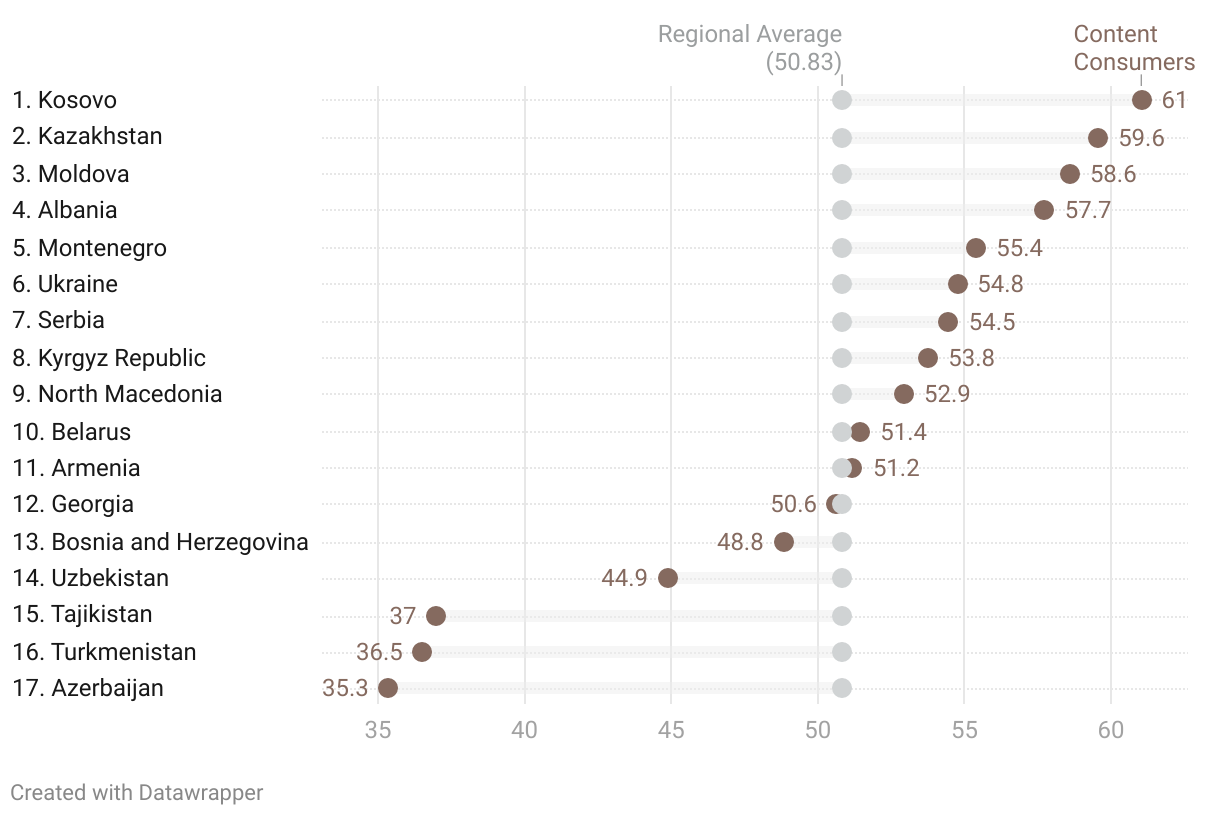
Grouped by Subregion
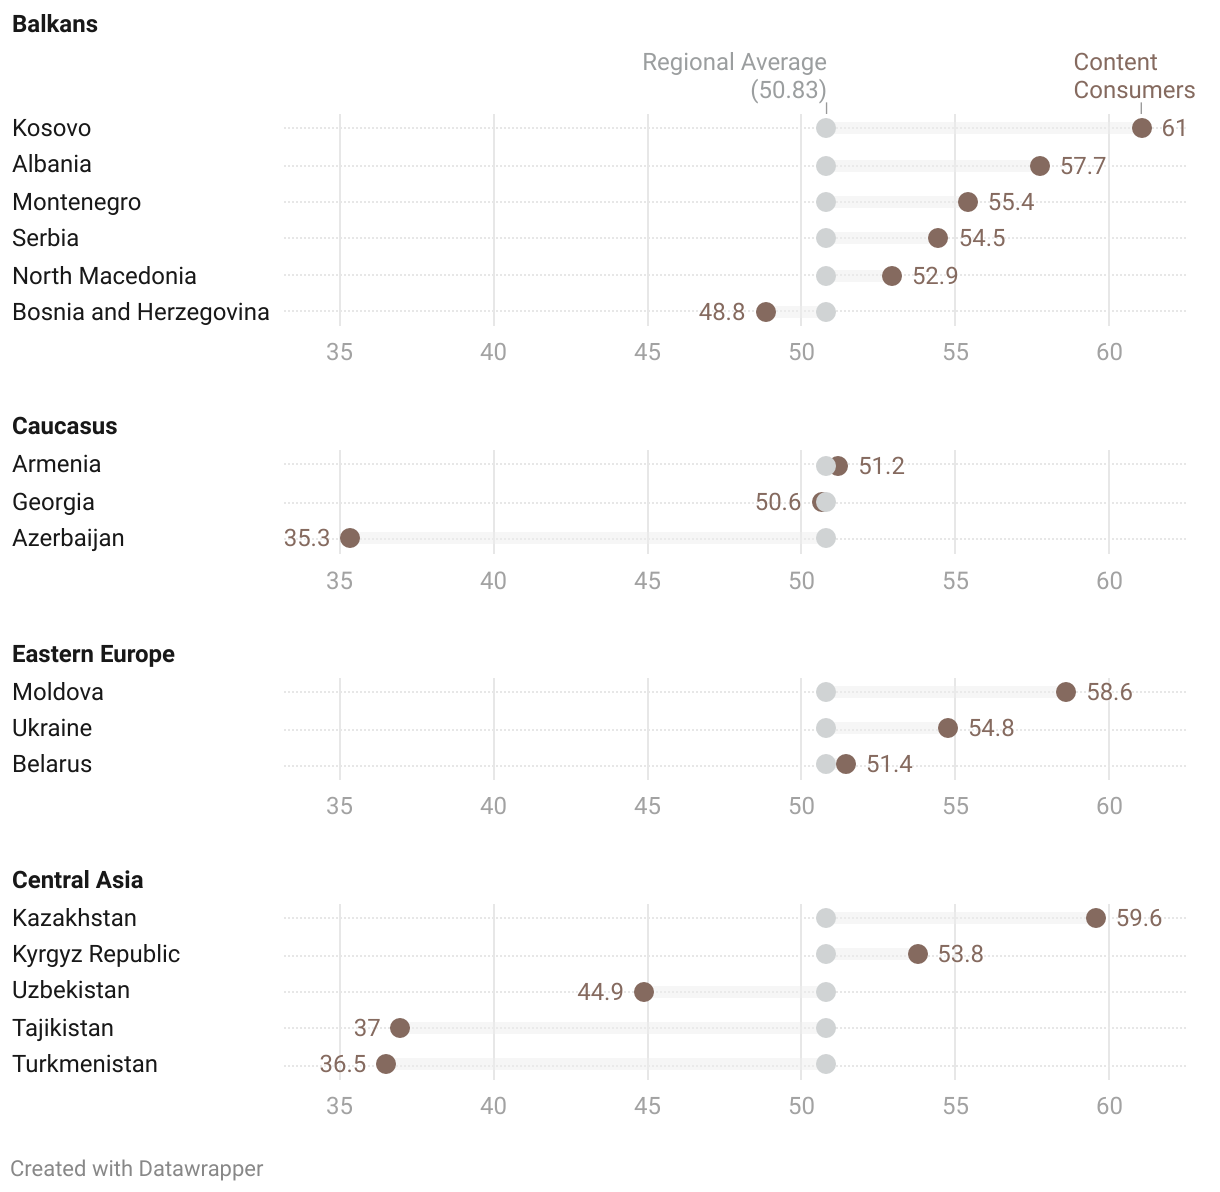
Figure SA4b. MRMI Index Snapshot by Component (Content Producers)
Ranked Across the Region
Grouped by Subregion
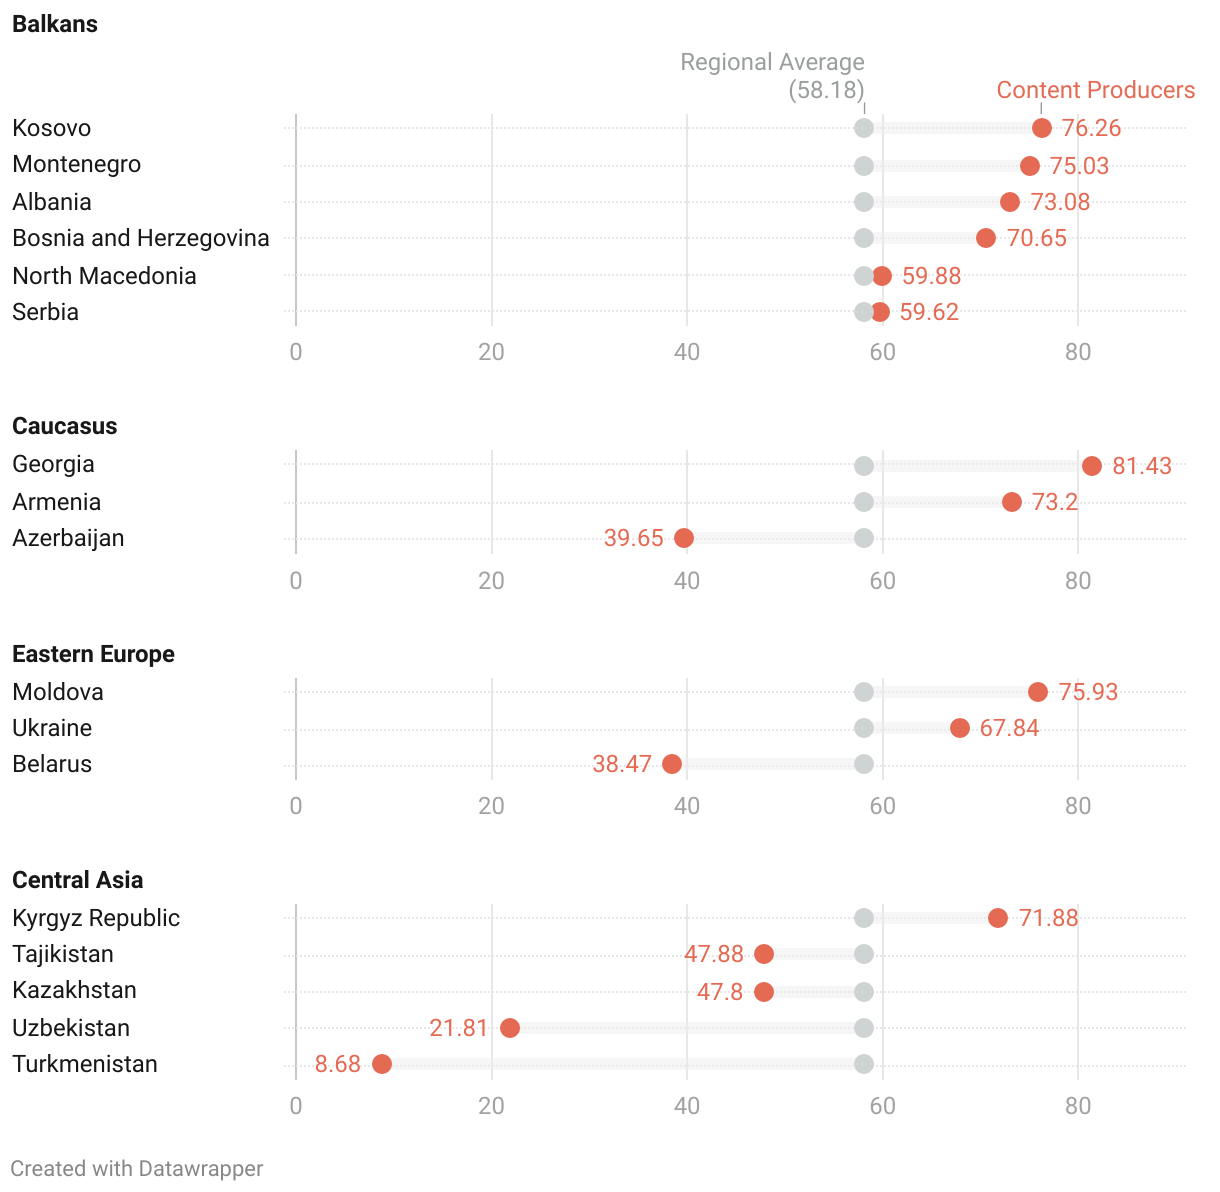
Figure SA4c. MRMI Index Snapshot by Component (Institutional Environment)
Ranked Across the Region
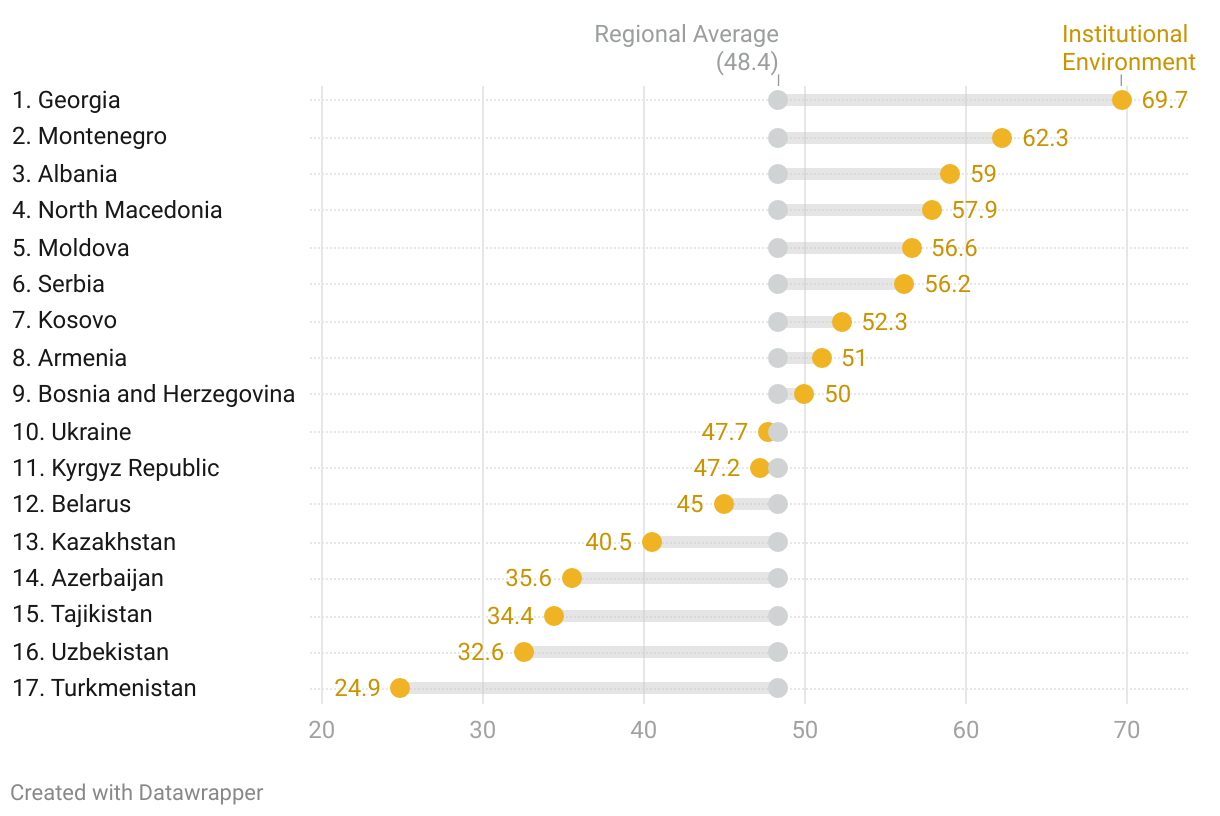
Grouped by Subregion
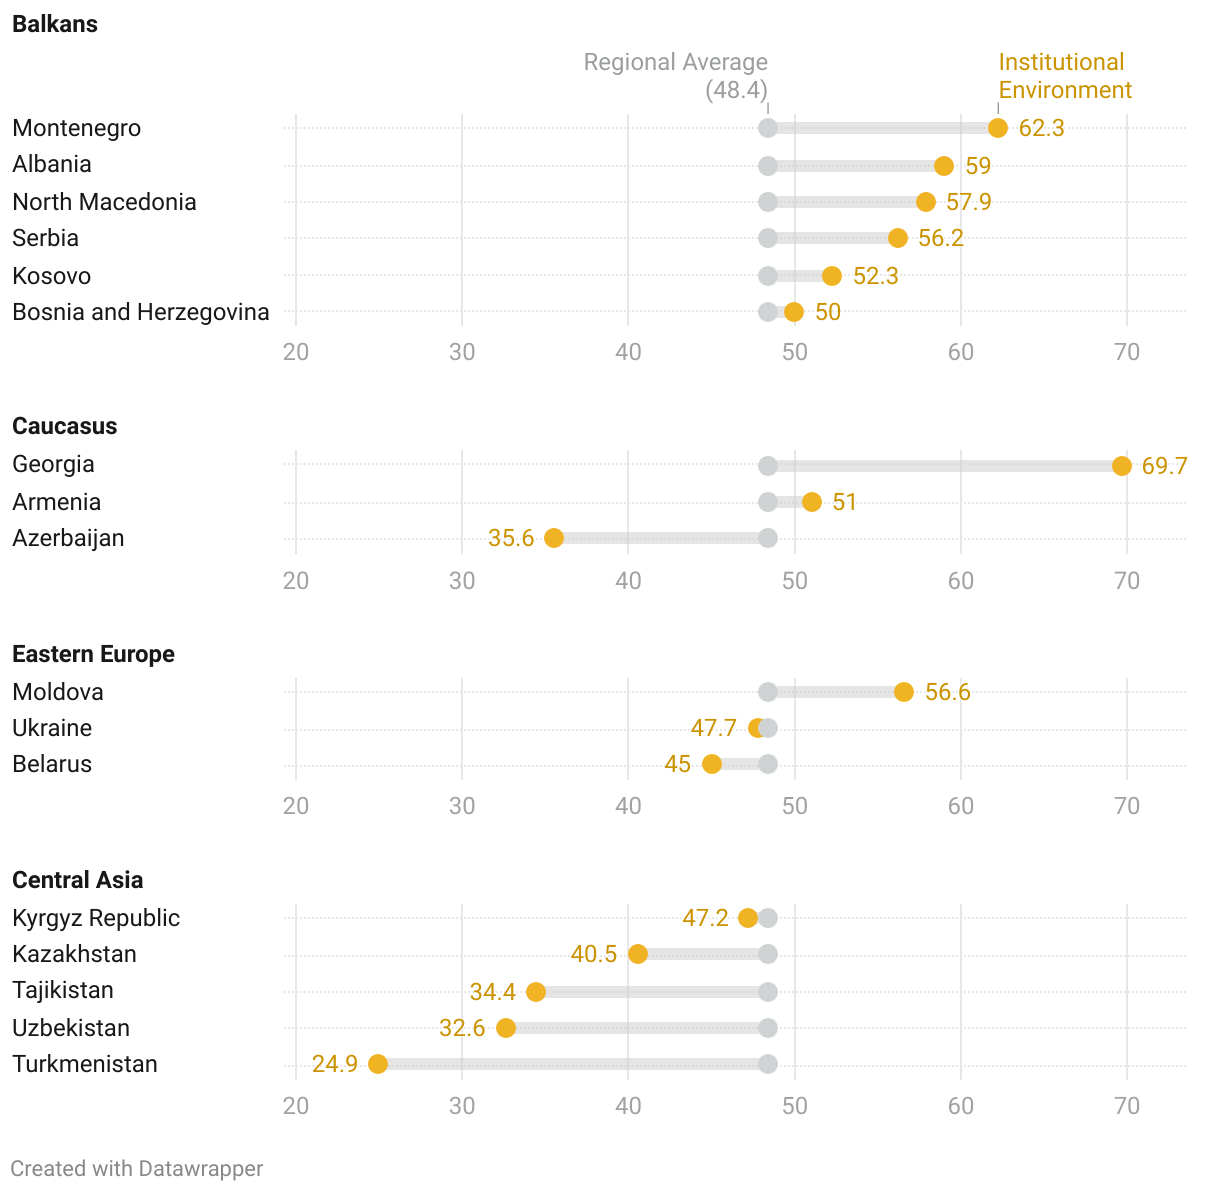
Figure SA5a. Change from 2010 to 2020 in Media Resilience in 17 E&E Countries (Content Consumers)
Ranked Across the Region
Grouped by Subregion
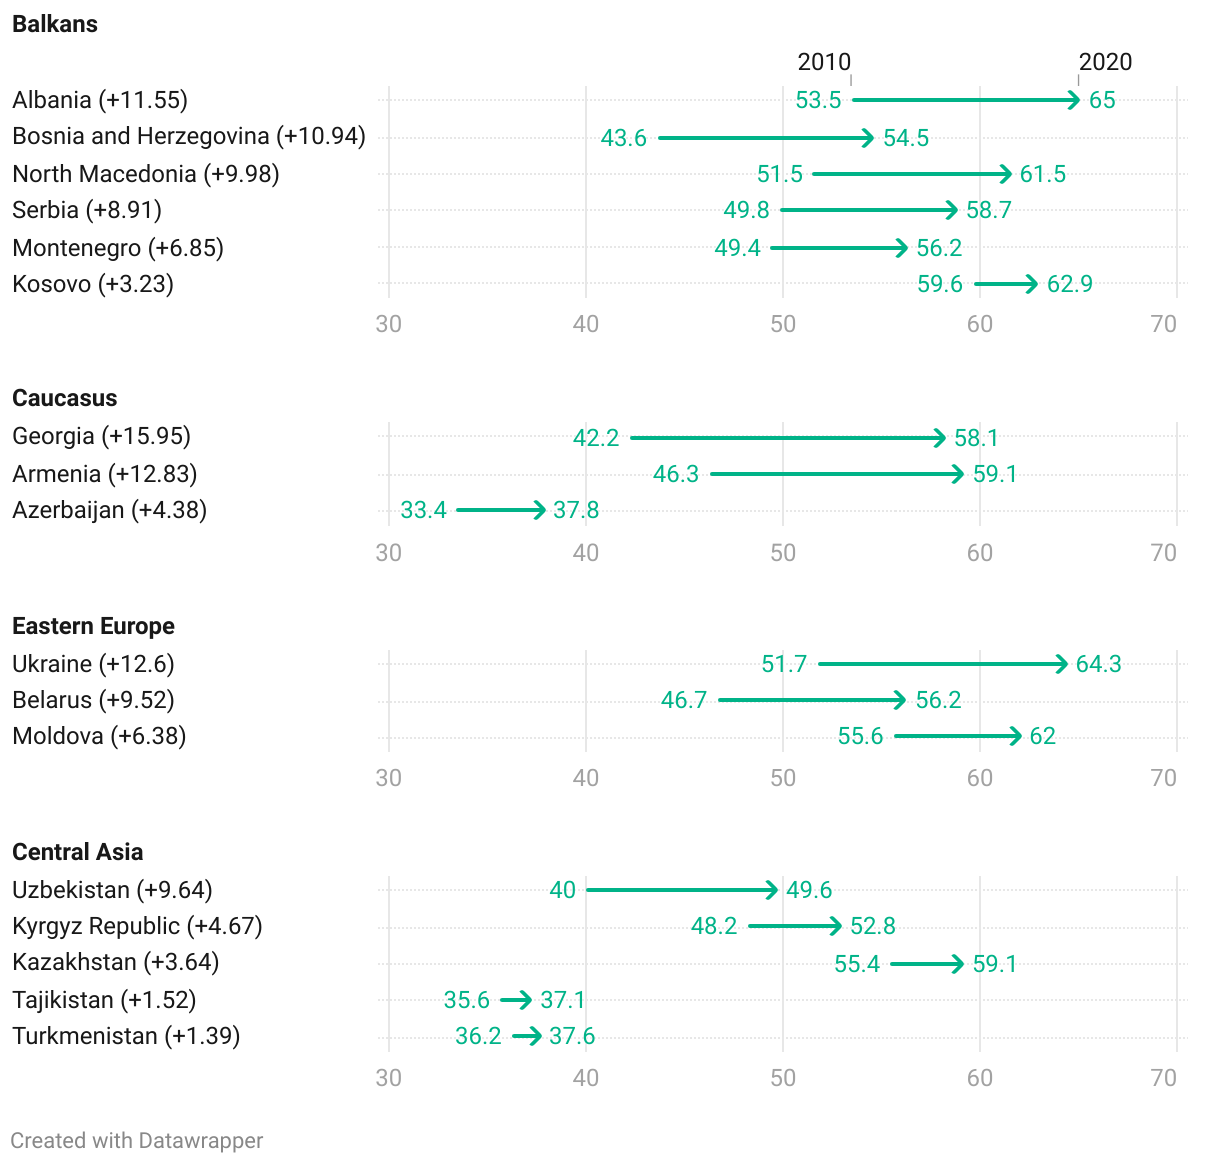
Figure SA5b. Change from 2010 to 2020 in Media Resilience in 17 E&E Countries (Content Producers)
Ranked Across the Region
Grouped by Subregion
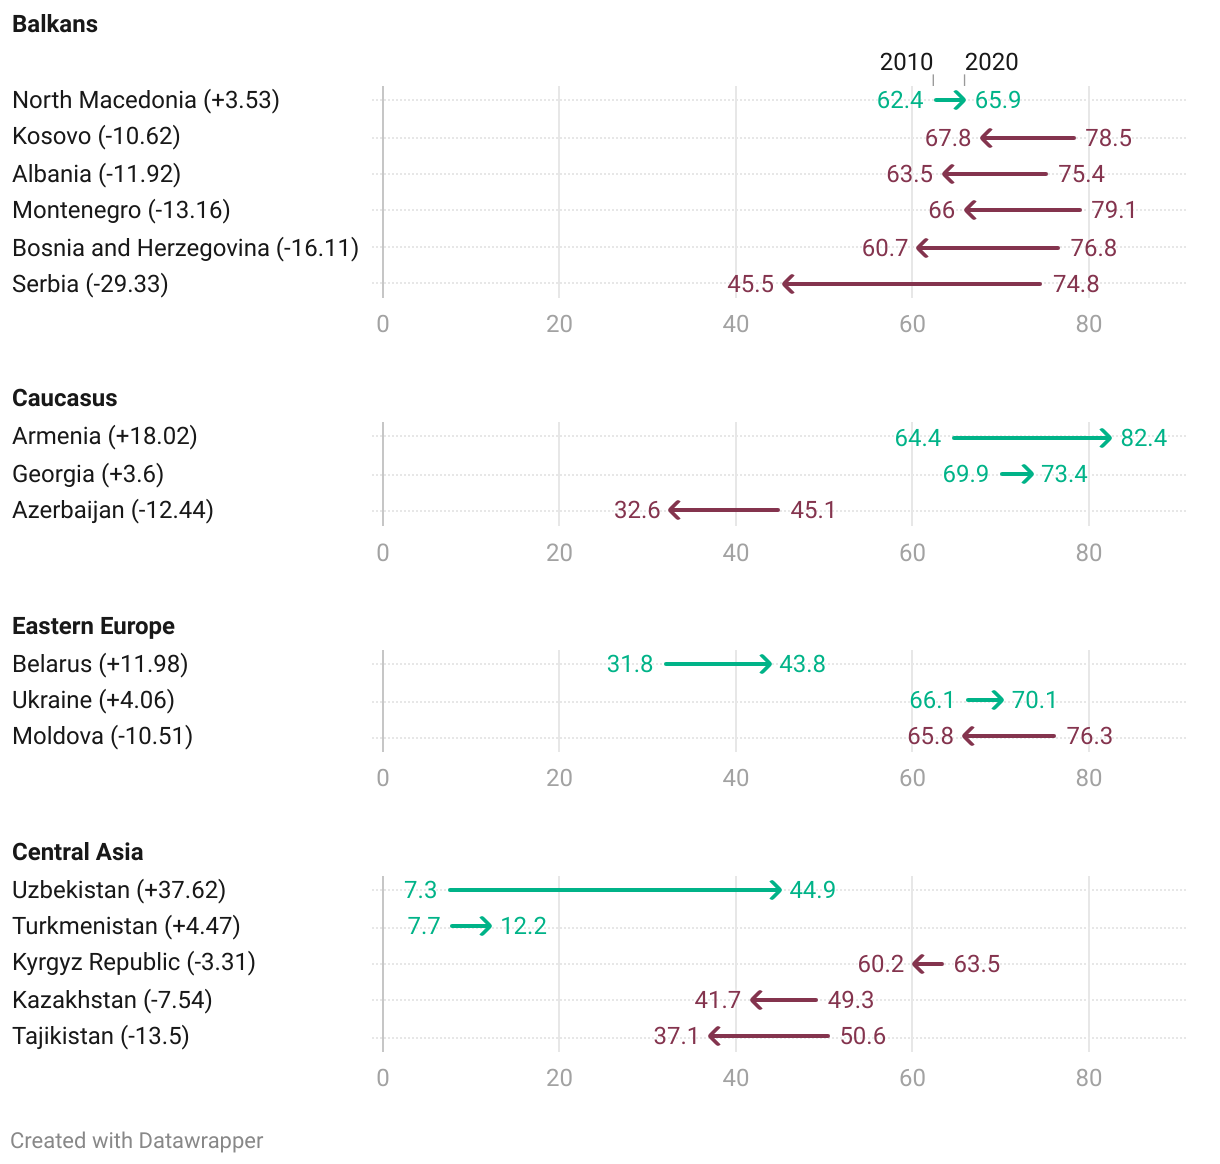
Figure SA5c. Change from 2010 to 2020 in Media Resilience in 17 E&E Countries (Institutional Environment)
Ranked Across the Region
Grouped by Subregion
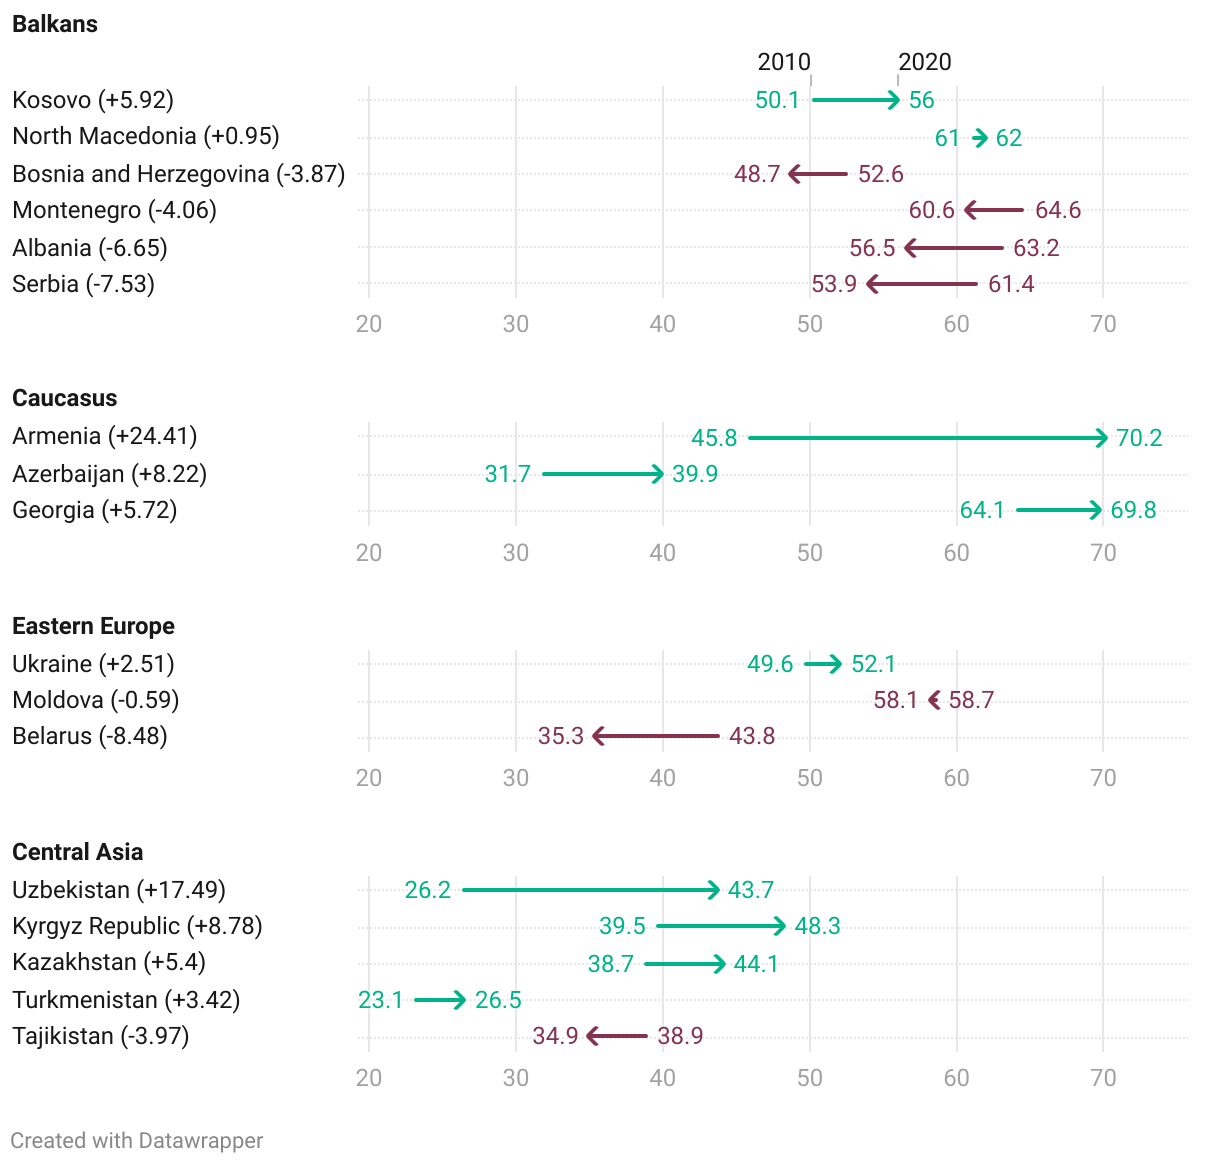
Figure SA6a. Change from 2010 to 2020 in Media Resilience Overall and Among Subregions (Content Consumers)
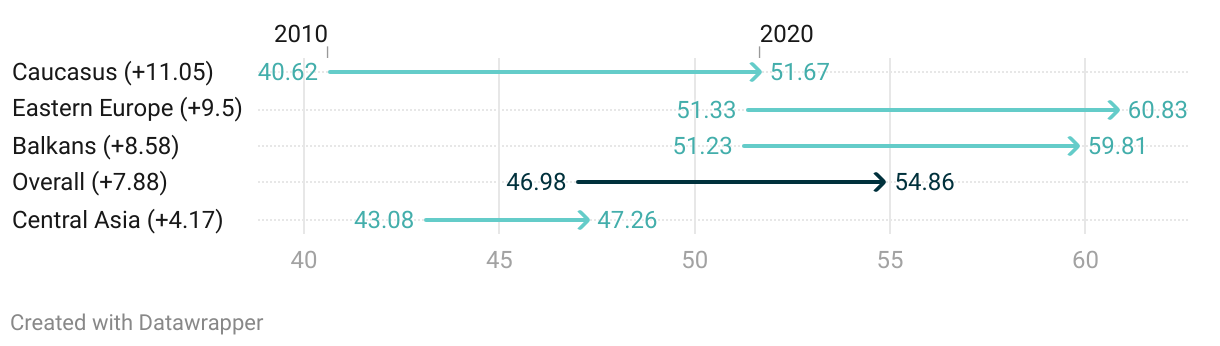
Figure SA6b. Change from 2010 to 2020 in Media Resilience Overall and Among Subregions (Content Producer
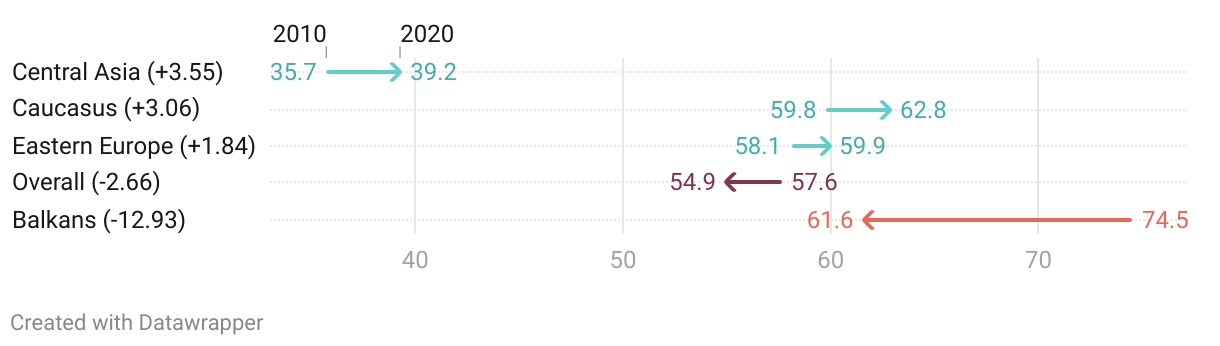
Figure SA6c. Change from 2010 to 2020 in Media Resilience Overall and Among Subregions (Institutional Environment)
Figures SA7. MRMI Index Trends in 17 E&E Countries, Overall and Three Component (2010-2020)
Albania
Armenia
Azerbaijan
Belarus
Bosnia and Herzegovina
Georgia
Kazakhstan
Kosovo
Kyrgyzstan
Moldova
Montenegro
North Macedonia
Serbia
Tajikistan
Turkmenistan
Ukraine
Uzbekistan
8. Detailed Description of Variables Used in Index
Here, we present a detailed description of all the variables we used to create the index. We structure the list so that the reader can quickly identify which variables comprise each element (which make up each domain and component). While marked below, we suggest using the Element ID from Table SA1 as a quick reference to identify the variables that correspond with each element.
For each variable, we provide (1) a definition or concept description of the variable according to the data source; (2) the years the variable covers with respect to our sample (2010 to 2020); (3) the countries the variable covers; (4) the data type of the raw data and data range, (5) the imputation approach (if we used one); and (6) the source. In some cases, a variable will feature all countries and years but not all country-year observations. In these cases, we note that these are missing explicitly.
To label the data type, we group the variables into two data types: continuous or interval/continuous . Continuous means the variable’s values can take any value in the range. For example, a continuous variable that ranges from 0 to 100 can take on values like 1, 35, 1.1, 7.45, etc. Interval/Continuous are continuous variables but do not have a set range. This mostly occurs from Varieties of Democracy variables, which are generated using latent variable modeling. An example would be -2.345 to 3.459.
Regarding data range, in most cases we provide the range for the entire dataset (versus the subset of our 17 E&E countries from 2010-2020) to demonstrate the breadth of the variable. For Interval/Continuous variables, we provide the data range of the data only in the subset of our 17 E&E countries from 2010-2020. [36] In these cases, we identify the ‘min’ and ‘max’ explicitly. Finally, we provide the website of each source for most variables so readers can find and download the raw data themselves. While we provide links for most data, we do not include the Gallup World Poll data due to license restrictions.
All variables were collected between October 2021 and March 2022. A star (*) indicates the variables used in two different elements. We further identify variables with the hash/pound symbol (#) to indicate we reversed the measurement’s manifest range to indicate an increase in the variables represents an increase in media resilience.
Content Consumer
E1. Media Consumption: Average # of media sources consumed by end users
IREX, Media Sustainability Index (MSI): Plurality of news sources*
- Description : Plurality of public and private news sources (e.g., print, broadcast, Internet, mobile) exist and offer multiple viewpoints. Citizens’ access to domestic or international media is not restricted by law, economics, or other means. State or public media reflect the views of the political spectrum, are nonpartisan, and serve the public interest. Independent news agencies gather and distribute news for media outlets. Private media produce their own news. Transparency of media ownership allows consumers to judge the objectivity of news; media ownership is not concentrated in a few conglomerates. A broad spectrum of social interests are reflected and represented in the media, including minority-language information sources. The media provide news coverage and information about local, national, and international issues.
- Notes: Because IREX discontinued the MSI and replaced it with the VIBE index, we supplement the data with VIBE’s 2020 scores when available. Specifically, for this variable we use VIBE Indicator 4, Inclusive and Diverse Content. This new variable was constructed to be a continuation of MSI’s Plurality of News Sources. Based on IREX’s recommendation, we multiply the original 0 to 4 scale scale by 10 to conform with the new VIBE scaling.
- Years : 2010-2018 (MSI), 2020 (VIBE)
- Countries: All; Missing Kazakhstan (2020), the Kyrgyz Republic (2020), Tajikistan (2020), Turkmenistan (2020), and Uzbekistan (2020)
- Raw Data Type/Range: Continuous, 0-40
- Imputation Approach: Multiple imputation (all countries in 2019 and 5 missing countries in 2020)
- Source: International Research & Exchanges Board [IREX]. (2019). Media sustainability index: Development of sustainable independent media in Europe and Eurasia. https://www.irex.org/resource/media-sustainability-index-msi ; International Research & Exchanges Board [IREX]. (2019). Vibrant Information Barometer (VIBE). https://www.irex.org/resource/vibrant-information-barometer-vibe .
Varieties of Democracy: Alternative sources of information index*
- Description : To what extent is the media (a) un-biased in their coverage or lack of coverage of the opposition, (b) allowed to be critical of the regime, and (c) representative of a wide array of political perspectives?
- Years : 2010-2020
- Countries: All
- Raw Data Type/Range: Continuous; 0-1
- Imputation Approach: n/a
- Source: Varieties of Democracy dataset v12, Coppedge et al. 2022/Pemstein et al. 2022 https://www.v-dem.net/vdemds.html
E2. Media Consumption: Universal media access
Varieties of Democracy: Exclusion by social group (#)
- Description : Index of (political) exclusion by socio-economic group. Exclusion is when individuals are denied access to services or participation in governed spaces (spaces that are part of the public space and the government should regulate, while excluding private spaces and organizations except when exclusion in those private spheres is linked to exclusion in the public sphere) based on their identity or belonging to a particular group.
- Years : 2010-2020
- Countries: All
- Raw Data Type/Range: Continuous; 0-1
- Imputation Approach : n/a
- Source: Varieties of Democracy dataset v12, Coppedge et al. 2022/Pemstein et al. 2022 https://www.v-dem.net/vdemds.html
Varieties of Democracy: Exclusion by location (Urban-Rural) (#)
- Description : Index of (political) exclusion by urban-rural location. Exclusion is when individuals are denied access to services or participation in governed spaces (spaces that are part of the public space and the government should regulate, while excluding private spaces and organizations except when exclusion in those private spheres is linked to exclusion in the public sphere) based on their identity or belonging to a particular group.
- Years : 2010-2020
- Countries: All
- Raw Data Type/Range: Continuous; 0-1
- Imputation Approach : n/a
- Source: Varieties of Democracy dataset v12, Coppedge et al. 2022/Pemstein et al. 2022 https://www.v-dem.net/vdemds.html
E3. Media Consumption: Access to cell phones
GSMA: Mobile Connectivity Index
- Description : Measures the ability of a country to deliver and adopt mobile internet connectivity for individuals in their respective countries
- Years : 2014-2020
- Countries: Missing Kosovo and Turkmenistan
- Raw Data Type/Range: Continuous; 0-100
- Imputation Approach : Multiple imputation (Kosovo and Turkmenistan)
- Source: GSMA (2022) Mobile Connectivity Index. https://www.mobileconnectivityindex.com/#year=2019
United Nations E-Government Survey: Telecommunication infrastructure index
- Description : This index consists of the estimated number of internet users, the number of main fixed telephone lines, the number of mobile subscribers, the number of fixed internet subscriptions and the number of fixed broadband facilities, each per 100 inhabitants.
- Years : 2010, 2012, 2014, 2016, 2018, 2020
- Countries: Kosovo missing
- Raw Data Type/Range: Continuous, 0-1
- Imputation Approach: Multiple imputation (Kosovo); Averages of surrounding values (gap years of non-Kosovo countries)
- Source: United Nations. Division for Public Administration, & Development Management. (2010-20). United Nations E-government Survey . UN. https://publicadministration.un.org/egovkb/en-us/Data-Center
E4. Media Consumption : Fact-checking/verification behavior of media consumers
- No Data
E5. Consumer Attributes : Education and Media Literacy
Gallup World Poll: % studied beyond secondary school
- Description : % population completed four years of education beyond secondary school and/or received a 4-year college degree
- Years : 2010-2020
- Countries: All; Missing Armenia (2020), Azerbaijan (2020), Belarus (2020), and Turkmenistan (2010, 2020)
- Raw Data Type/Range: Continuous; 0-100 (percentage) [37]
- Imputation Approach: Multiple imputation
- Source: Gallup. (2022). Gallup World Poll, 2010-2021 [Dataset]. Washington, DC: Gallup Inc.
United Nations Development Programme: Education index
- Description : Measured by combining average adult years of schooling with expected years of schooling for children, each receiving 50% weighting
- Years : 2010-2019
- Countries: Missing Kosovo
- Raw Data Type/Range: Continuous, 0-1
- Imputation Approach: Multiple imputation (Kosovo and 2020)
- Source : United National Development Programme (2022) Human Development
- Indices and Indicators. http://hdr.undp.org/en/data
United Nations E-Government Survey: Human capital index
- Description: Consists of four components; (i) adult literacy rate; (ii) the combined primary, secondary and tertiary gross enrolment ratio; (iii) expected years of schooling; and (iv) average years of schooling.
- Years : 2010, 2012, 2014, 2016, 2018, 2020
- Countries: Missing Kosovo
- Raw Data Type/Range: Continuous, 0-1
- Imputation Approach: Multiple imputation (Kosovo); Average surrounding values for gap years
- Source: United Nations. Division for Public Administration, & Development Management. (2010-20). United Nations E-government Survey . UN. https://publicadministration.un.org/egovkb/en-us/Data-Center
Varieties of Democracy: Education equality
- Description : To what extent is high quality basic education guaranteed to all, sufficient to enable them to exercise their basic rights as adult citizens? Basic education refers to ages typically between 6 and 16 years of age but this varies slightly among countries.
- Years : 2010-2020
- Countries: All
- Raw Data Type/Range: Interval/Continuous; -1.476 (min) to 2.646 (max)
- Imputation Approach: n/a
- Source: Varieties of Democracy dataset v12, Coppedge et al. 2022/Pemstein et al. 2022 https://www.v-dem.net/vdemds.htm
World Bank: Human capital index
- Description : Calculates the contributions of health and education to worker productivity. The final index score measures the productivity as a future worker of a child born today relative to the benchmark of full health and complete education.The human capital index is a compound of the literacy rate and a combined primary, secondary and tertiary gross enrollment ratio.
- Years : 2010, 2017-18, 2020
- Countries: Missing Turkmenistan; Armenia (2010), Belarus (2010, 2017-18), Bosnia (2010), Kosovo (2010), the Kyrgyz Republic (2010), Tajikistan (2010), and Uzbekistan (2010, 2017-18)
- Raw Data Type/Range: Continuous, 0-1
- Imputation Approach: Multiple imputation (Turkmenistan, years 2011-16 and 2019, and country-years specified above)
- Source: Angrist, Noam; Djankov, Simeon; Goldberg, Pinelopi K.; Patrinos, Harry A.. 2019. Measuring Human Capital. Policy Research Working Paper;No. 8742. World Bank, Washington, DC. © World Bank. https://openknowledge.worldbank.org/handle/10986/31280 License: CC BY 3.0 IGO. Data available here: https://databank.worldbank.org/source/human-capital-index#
E6. Consumer Attributes : Trust in others
Bertelsmann Transformation Index: Social capital
- Description : Assess the level of trust between citizens, which fosters cooperation and mutual support for purposes of self-help, rather than primarily to further political objectives. Social capital may also be based on cultural patterns of interaction that characterize traditional societies.
- Years : 2010-2020
- Countries: All
- Raw Data Type/Range: Continuous, 1-10
- Imputation Approach: n/a
- Source: Bertelsmann Transformation Index. (2021). Economic Transformation . https://bti-project.org/en/index/economic-transformation.html
E7. Consumer Attributes : Level of income
Varieties of Democracy: Equal distribution of resources
- Description : This component measures the extent to which resources — both tangible and intangible — are distributed in society. This principle also implies that social or economic inequalities can translate into political inequalities.
- Years : 2010-2020
- Countries: All
- Raw Data Type/Range: Continuous; 0-1
- Imputation Approach: n/a
- Source: Varieties of Democracy dataset v12, Coppedge et al. 2022/Pemstein et al. 2022 https://www.v-dem.net/vdemds.htm
World Development Indicators, World Bank: Gini Coefficient (#)
- Description : The Gini index measures the extent to which the distribution of income (or, in some cases, consumption expenditure) among individuals or households within an economy deviates from a perfectly equal distribution.
- Years : 2010-2020
- Countries: All (though no country has complete coverage)
- Raw Data Type/Range: Continuous, 0-100 (0 represents perfect equality, while an index of 100 implies perfect inequality)
- Imputation Approach: Carryforward; For several countries we carry forward from a year going as far back as 2005 (i.e., Azerbaijan). We assume inequality is a slow changing process.
- Source: World Bank. (2022). World Development Indicators [Data set]. https://data.worldbank.org/
World Development Indicators, World Bank: GDP per capita (2015 US$)
- Description : GDP per capita is gross domestic product divided by midyear population. Data are in 2015 constant U.S. dollars.
- Years : 2010-2020
- Countries: All; Missing Turkmenistan (2020)
- Raw Data Type/Range: Continuous; 783.5194 (min) to 11,402.76 (max)
- Imputation Approach: Multiple imputation (Turkmenistan 2020)
- Source: World Bank. (2022). World Development Indicators [Data set]. https://data.worldbank.org/
E8. Consumer Attributes: Economic stability
Bertelsmann Transformation Index: Monetary and fiscal stability
- Description : Assess whether the control of monetary stability including foreign exchange-rate policies are in accordance with other goals of the government’s economic policy
- Years : 2010-2020
- Countries: All
- Raw Data Type/Range: Continuous, 1-10
- Imputation Approach: n/a
- Source: Bertelsmann Transformation Index. (2022). Economic Transformation [Data set]. https://bti-project.org/en/index/economic-transformation.html
Gallup World Poll: Life evaluation index
- Description : % thriving in life, measures life satisfaction by asking respondents to place the status of their lives on a “ladder” scale with steps numbered from 0 to 10, where 0 indicates the worst possible life and 10 the best possible life for two related but separate questions regarding life evaluations After this, Gallup generates a 3-point index: thriving, struggling, and suffering. Variables take % of 'thriving.'
- Years : 2010-2020
- Countries: All; Missing Armenia (2020), Azerbaijan (2020), Belarus (2020), and Turkmenistan (2010, 2020)
- Raw Data Type/Range: Continuous; 0-100 (percentage) [38]
- Imputation Approach: Multiple imputation
- Source: Gallup. (2022). Gallup World Poll, 2010-2021 [Dataset]. Washington, DC: Gallup Inc.
Gallup World Poll: Financial life index
- Description : The Financial Life Index measures respondents’ personal economic situations and the economics of the community where they live. Based on four separate questions, Gallup generates a 9-point scale. The cutoff point for 'satisfied' is the median of 17%.
- Years : 2010-2020
- Countries: All; Missing Armenia (2020), Azerbaijan (2020), Belarus (2020), and Turkmenistan (2010, 2020)
- Raw Data Type/Range: Continuous; 0-100 (percentage) [39]
- Imputation Approach: Multiple imputation
- Source: Gallup. (2022). Gallup World Poll, 2010-2021 [Dataset]. Washington, DC: Gallup Inc.
World Development Indicators, World Bank: GDP per capita, change (2015 US$)
- Description : Annual percentage growth rate of GDP at market prices based on constant local currency. Aggregates are based on constant 2015 U.S. dollars.
- Years : 2010-2020
- Countries: All; Missing Turkmenistan (2020)
- Raw Data Type/Range: Continuous; -15.11668 (min) to 12.77436 (max)
- Imputation Approach: Multiple imputation (Turkmenistan 2020)
- Source: World Bank. (2022). World Development Indicators [Data set]. https://data.worldbank.org/
E9. Societal norms: Political fragmentation/partisanship
Digital Society Survey/VDem: Online media fractionalization
- Description : Do the major domestic online media outlets give a similar presentation of major (political) news?
- Years : 2010-2020
- Countries: All
- Raw Data Type/Range: Interval/Continuous; -2.271 (min) to 3.243 (max)
- Imputation Approach: n/a
- Source: Digital Society Project Dataset v2, Mechkova et al. (2021, Digital Society Project Working Paper 2021:1); Pemstein et al. (2019, V-Dem Working Paper Series 2019:21) http://digitalsocietyproject.org/data/
Varieties of Democracy: Political polarization (#)
- Description : Is society polarized into antagonistic, political camps? Here we refer to the extent to which political differences affect social relationships beyond political discussions. Societies are highly polarized if supporters of opposing political camps are reluctant to engage in friendly interactions, for example, in family functions, civic associations, their free time activities and workplaces.
- Years : 2010-2020
- Countries: All
- Raw Data Type/Range: Interval/Continuous; -3.23 (min) to 2.333 (max)
- Imputation Approach: n/a
- Source: Varieties of Democracy dataset v12, Coppedge et al. 2022/Pemstein et al. 2022 https://www.v-dem.net/vdemds.htm
E10. Societal norms : National identity/ethnolinguistic fractionalization
AidData: Proven Social Trust
- Description: Bespoke variable that indicates the level of proven trust in a society. This variable discounts BTI's Social Capital score if society is not ethnically, linguistically, and religiously diverse. We create it by interacting BTI’s social capital index with Kolo’s 2012 distance-adjusted ethno-linguistic fractionalization index (DELF). Thus, social capital * DELF .
- Years : 2010-2020
- Countries: All
- Raw Data Type/Range: Continuous, 0-10 [40]
- Imputation Approach: n/a
- Source: (i) Bertelsmann Transformation Index (2022) Economic Transformation. https://bti-project.org/en/index/economic-transformation.html (ii) Kolo, P. (2012). Measuring a new aspect of ethnicity: The appropriate diversity index (No. 221). Discussion Papers, Ibero America Institute for Economic Research. http://hdl.handle.net/10419/92997
Varieties of Democracy: Societal polarization
- Description : How would you characterize the differences of opinions on major political issues in this society? While plurality of views exists in all societies, we are interested in knowing the extent to which these differences in opinions result in major clashes of views and polarization or, alternatively, whether there is general agreement on the general direction this society should develop.
- Years : 2010-2020
- Countries: All
- Raw Data Type/Range: Interval/Continuous; -2.517 (min) to 1.815 (max)
- Imputation Approach: n/a
- Source: Varieties of Democracy dataset v12, Coppedge et al. 2022/Pemstein et al. 2022 https://www.v-dem.net/vdemds.htm
E11. Societal norms: Citizen participation in society
Gallup World Poll: Civic engagement index
- Description : % high civic engagement, The Civic Engagement Index assesses respondents’ inclination to volunteer their time and assistance to others. It is designed to measure a respondent’s commitment to the community where he or she lives. Based on three questions, Gallup creates a 4-point scale. % of highest two on 4-point scale.
- Years : 2010-2019
- Countries: All; Armenia (2020), Azerbaijan (2020), Belarus (2020), and Turkmenistan (2010, 2020) missing
- Raw Data Type/Range: Continuous; 0-100 (percentage) [41]
- Imputation Approach: Multiple imputation
- Source: Gallup. (2022). Gallup World Poll, 2010-2021 [Dataset]. Washington, DC: Gallup Inc
United Nations E-Government Survey: E-Participation index
- Description : Assesses the quality, relevance, and usefulness of government websites in providing online information and participatory tools and services to their citizens.
- Years : 2010, 2012, 2014, 2016, 2018, 2020
- Countries: All except Kosovo
- Raw Data Type/Range: Continuous; 0-1
- Imputation Approach: Averages of surrounding values (Gap years other countries), Multiple imputation (Kosovo)
- Source: United Nations. Division for Public Administration, & Development Management. (2010-20). United Nations E-government Survey . UN. https://publicadministration.un.org/egovkb/en-us/Data-Center
Content Producers
E12. Media Reliability : Public trust in media as an institution
Gallup World Poll: Media freedom
- Description : % responding 'yes' to: Do the media in this country have a lot of freedom, or not?
- Years : 2010-2020
- Countries: Turkmenistan missing; Missing Albania (2010-11), Armenia (2020), Azerbaijan (2020), Belarus (2020), Bosnia (2010-11), Kosovo (2010-11), Montenegro (2010-11), North Macedonia (2010-11), Serbia (2010-11), Tajikistan (2018-20), and Uzbekistan (2010-19)
- Raw Data Type/Range: Continuous; 0-100 (percentage) [42]
- Imputation Approach: Multiple imputation
- Source: Gallup. (2022). Gallup World Poll, 2010-2021 [Dataset]. Washington, DC: Gallup Inc.
E13. Media Reliability: Market dominance vs fragmentation
IREX, Media Sustainability Index (MSI): Business management*
- Description : Media outlets operate as efficient and self-sustaining enterprises. Media revenues from a multitude of sources. Advertising agencies and related industries support the advertising market. Advertising revenue as a percentage of total revenue is in line with accepted standards. Government subsidies and advertising are distributed fairly, governed by law, and neither subvert editorial independence nor distort the market. Market research is used to formulate strategic plans, enhance advertising revenue, and tailor the product to the needs and interests of the audience. Broadcast ratings, circulation figures, and Internet statistics are reliably and independently produced.
- Notes: Because IREX discontinued the MSI and replaced it with the VIBE index, we supplement the data with VIBE’s 2020 scores when available. Specifically, for this variable we use VIBE Indicator 5 Content production is Sufficiently Resourced. This new variable was constructed to be a continuation of MSI’s Business Management. Based on IREX’s recommendation, we multiply the original 0 to 4 scale scale by 10 to conform with the new VIBE scaling.
- Years : 2010-2018 (MSI), 2020 (VIBE)
- Countries: All; Missing Kazakhstan (2020), the Kyrgyz Republic (2020), Tajikistan (2020), Turkmenistan (2020), and Uzbekistan (2020).
- Raw Data Type/Range: Continuous, 0-40
- Imputation Approach: Multiple Imputation
- Source: International Research & Exchanges Board [IREX]. (2019). Media sustainability index: Development of sustainable independent media in Europe and Eurasia. https://www.irex.org/resource/media-sustainability-index-msi ; International Research & Exchanges Board [IREX]. (2019). Vibrant Information Barometer (VIBE). https://www.irex.org/resource/vibrant-information-barometer-vibe .
E14. Media Reliability: Corruption within journalism
Varieties of Democracy: Media corruption
- Description : Do journalists, publishers, or broadcasters accept payments in exchange for altering news coverage?
- Years : 2010-2020
- Countries: All
- Raw Data Type/Range: Interval/Continuous; -3.167 (min) to 1.744 (max)
- Imputation Approach: n/a
- Source: Varieties of Democracy dataset v12, Coppedge et al. 2022/Pemstein et al. 2022 https://www.v-dem.net/vdemds.htm
E15. Media Reliability : Transparency of media outlets
- No Data
E16. Media Availability: Number of available media outlets for consumers to choose from
IREX, Media Sustainability Index (MSI): Plurality of news sources*
- Description : Plurality of public and private news sources (e.g., print, broadcast, Internet, mobile) exist and offer multiple viewpoints. Citizens’ access to domestic or international media is not restricted by law, economics, or other means. State or public media reflect the views of the political spectrum, are nonpartisan, and serve the public interest. Independent news agencies gather and distribute news for media outlets. Private media produce their own news. Transparency of media ownership allows consumers to judge the objectivity of news; media ownership is not concentrated in a few conglomerates. A broad spectrum of social interests are reflected and represented in the media, including minority-language information sources. The media provide news coverage and information about local, national, and international issues.
- Notes: Because IREX discontinued the MSI and replaced it with the VIBE index, we supplement the data with VIBE’s 2020 scores when available. Specifically, for this variable we use VIBE Indicator 4, Inclusive and Diverse Content. This new variable was constructed to be a continuation of MSI’s Plurality of News Sources. Based on IREX’s recommendation, we multiply the original 0 to 4 scale scale by 10 to conform with the new VIBE scaling.
- Years : 2010-2018 (MSI), 2020 (VIBE)
- Countries : All; Missing Kazakhstan (2020), the Kyrgyz Republic (2020), Tajikistan (2020), Turkmenistan (2020), and Uzbekistan (2020).
- Raw Data Type/Range: Continuous, 0-40
- Imputation Approach: Multiple Imputation
- Source: International Research & Exchanges Board [IREX]. (2019). Media sustainability index: Development of sustainable independent media in Europe and Eurasia. https://www.irex.org/resource/media-sustainability-index-msi ; International Research & Exchanges Board [IREX]. (2019). Vibrant Information Barometer (VIBE). https://www.irex.org/resource/vibrant-information-barometer-vibe .
Varieties of Democracy: Alternative sources of information index*
- Description : To what extent is the media (a) un-biased in their coverage or lack of coverage of the opposition, (b) allowed to be critical of the regime, and (c) representative of a wide array of political perspectives?
- Years : 2010-2020
- Countries: All
- Raw Data Type/Range: Continuous; 0-1
- Imputation Approach: n/a
- Source: Varieties of Democracy dataset v12, Coppedge et al. 2022/Pemstein et al. 2022 https://www.v-dem.net/vdemds.htm
E17. Media Availability : Ideological diversity of available media outlets for consumers to choose from
Digital Society Survey/VDem: Online media perspectives*
- Description : Do the major domestic online media outlets represent a wide range of political perspectives?
- Years : 2010-2020
- Countries: All
- Raw Data Type/Range: Interval/Continuous; -2.055 (min) to 1.817 (max)
- Imputation Approach: n/a
- Source: Digital Society Project Dataset v2, Mechkova et al. (2019, Digital Society Project Working Paper 2019:1); Pemstein et al. (2019, V-Dem Working Paper Series 2019:21) http://digitalsocietyproject.org/data/
Varieties of Democracy: Print/Broadcast perspectives*
- Description : Do the major print and broadcast media represent a wide range of political perspectives?
- Years : 2010-2020
- Countries: All
- Raw Data Type/Range: Interval/Continuous; -2.275 (min) to 2.198 (max)
- Imputation Approach: n/a
- Source: Varieties of Democracy dataset v12, Coppedge et al. 2022/Pemstein et al. 2022 https://www.v-dem.net/vdemds.htm
E18. Media Professionalism : Journalism education
No Data
E19. Media Professionalism : Journalism as a profession
IREX, Media Sustainability Index (MSI): Professional journalism
- Description : Reporting is fair, objective, and well-sourced. Journalists follow recognized and accepted ethical standards. Journalists and editors do not practice self-censorship. Journalists cover key events and issues. Pay levels for journalists and other media professionals are sufficiently high to discourage corruption and retain qualified personnel within the media profession. Entertainment programming does not eclipse news and information programming. Technical facilities and equipment for gathering, producing, and distributing news are modern and efficient. Quality niche reporting and programming exist (investigative, economics/business, local, political).
- Notes: Because IREX discontinued the MSI and replaced it with the VIBE index, we supplement the data with VIBE’s 2020 scores when available. Specifically, for this variable we use VIBE Principle 1 (Information Quality). This new variable was constructed to be a continuation of MSI’s Professional Journalism . Based on IREX’s recommendation, we multiply the original 0 to 4 scale scale by 10 to conform with the new VIBE scaling.
- Years : 2010-2018 (MSI), 2020 (VIBE)
- Countries: All; Missing Kazakhstan (2020), the Kyrgyz Republic (2020), Tajikistan (2020), Turkmenistan (2020), and Uzbekistan (2020)
- Raw Data Type/Range: Continuous, 0-40
- Imputation Approach: Multiple imputation
- Source: International Research & Exchanges Board [IREX]. (2019). Media sustainability index: Development of sustainable independent media in Europe and Eurasia. https://www.irex.org/resource/media-sustainability-index-msi ; International Research & Exchanges Board [IREX]. (2019). Vibrant Information Barometer (VIBE). https://www.irex.org/resource/vibrant-information-barometer-vibe .
E20. Media Professionalism : Journalists as watchdogs
Varieties of Democracy: Print/Broadcast critical of govt
- Description : Of the major print and broadcast outlets, how many routinely criticize the government?
- Years : 2010-2020
- Countries: All
- Raw Data Type/Range: Continuous; -3.223 (min) to 2.212 (max)
- Imputation Approach: n/a
- Source: Varieties of Democracy dataset v12, Coppedge et al. 2022/Pemstein et al. 2022 https://www.v-dem.net/vdemds.htm
E21. Media Professionalism: Diversification of media revenues
IREX, Media Sustainability Index (MSI): Business management*
- Description : Media outlets operate as efficient and self-sustaining enterprises. Media revenues from a multitude of sources. Advertising agencies and related industries support an advertising market. Advertising revenue as a percentage of total revenue is in line with accepted standards. Government subsidies and advertising are distributed fairly, governed by law, and neither subvert editorial independence nor distort the market. Market research is used to formulate strategic plans, enhance advertising revenue, and tailor the product to the needs and interests of the audience. Broadcast ratings, circulation figures, and Internet statistics are reliably and independently produced.
- Because IREX discontinued the MSI and replaced it with the VIBE index, we supplement the data with VIBE’s 2020 scores when available. Specifically, for this variable we use VIBE Indicator 5 Content production is Sufficiently Resourced. This new variable was constructed to be a continuation of MSI’s Business Management. Based on IREX’s recommendation, we multiply the original 0 to 4 scale scale by 10 to conform with the new VIBE scaling.
- Years : 2010-2018 (MSI), 2020 (VIBE)
- Countries: All; Missing Kazakhstan (2020), the Kyrgyz Republic (2020), Tajikistan (2020), Turkmenistan (2020), and Uzbekistan (2020)
- Raw Data Type/Range: Continuous, 0-40
- Imputation Approach: n/a
- Source: International Research & Exchanges Board [IREX]. (2019). Media sustainability index: Development of sustainable independent media in Europe and Eurasia. https://www.irex.org/resource/media-sustainability-index-msi ; International Research & Exchanges Board [IREX]. (2019). Vibrant Information Barometer (VIBE). https://www.irex.org/resource/vibrant-information-barometer-vibe .
E22. Media Professionalism : Journalism ethics and accountability
- No Data
Institutional Environment
E23. Media Independence : Media freedom
Freedom House, Nations in Transit: Independent media component
- Description : Examines press freedom's current state, including libel laws, harassment of journalists, and editorial independence; the operation of a financially viable and independent private press; functioning of public media.
- Years : 2010-2020
- Countries: All
- Raw Data Type/Range: Continuous; 1-7
- Imputation Approach: n/a
- Source: Freedom House (2022). Nation in Transit [Dataset] https://freedomhouse.org/report/nations-transit
Reporters Without Borders (RSF): Press Freedom Index (#)
- Description : Assessment of the countries' press freedom records in the previous year using six general criteria: pluralism (measures the degree of representation of opinions in the media space), media independence, environment and self-censorship, legislative framework, transparency, and infrastructure. It also takes account of the legal framework for the media (including penalties for press offenses, the existence of a state monopoly for certain kinds of media and how the media are regulated) and the level of independence of the public media. It also includes violations of the free flow of information on the Internet.
- Years : 2010-2020
- Countries: All
- Raw Data Type/Range: Continuous; 0-100
- Imputation Approach: n/a
- Source: Reporters without Borders. (2022). Press Freedom Index . https://rsf.org/en/ranking
E24. Media Independence: Media ownership diversity
Digital Society Survey/VDem: Online media perspectives*
- Description : Do the major domestic online media outlets represent a wide range of political perspectives?
- Years : 2010-2020
- Countries: All
- Raw Data Type/Range: Interval/Continuous; -2.055 (min) to 1.817 (max)
- Imputation Approach: n/a
- Source: Digital Society Project Dataset v2, Mechkova et al. (2019, Digital Society Project Working Paper 2019:1); Pemstein et al. (2019, V-Dem Working Paper Series 2019:21) http://digitalsocietyproject.org/data/
Varieties of Democracy: Media bias
- Description : Is there media bias against opposition parties or candidates?
- Years : 2010-2020
- Countries: All
- Raw Data Type/Range: Continuous; -1.965 (min) to 1.969 (max)
- Imputation Approach: n/a
- Source: Varieties of Democracy dataset v12, Coppedge et al. 2022/Pemstein et al. 2022 https://www.v-dem.net/vdemds.htm
Varieties of Democracy: Print/Broadcast perspectives*
- Description : Do the major print and broadcast media represent a wide range of political perspectives?
- Years : 2010-2020
- Countries: All
- Raw Data Type/Range: Interval/Continuous; -2.726 (min) to 2.006 (max)
- Imputation Approach: n/a
- Source: Varieties of Democracy dataset v12, Coppedge et al. 2022/Pemstein et al. 2022 https://www.v-dem.net/vdemds.htm
Varieties of Democracy: Media self-censorship
- Description : Is there widespread self-censorship among the media?
- Years : 2010-2020
- Countries: All
- Raw Data Type/Range: Interval/Continuous; -2.718 (min) to 2.138 (max)
- Imputation Approach: n/a
- Source: Varieties of Democracy dataset v12, Coppedge et al. 2022/Pemstein et al. 2022 https://www.v-dem.net/vdemds.htm
E25. Media Independence : Media insulation
Digital Society Survey/VDem: Defamation protection
- Description : Does the legal framework provide protection against defamatory online content or hate speech?
- Years : 2010-2020
- Countries: All
- Raw Data Type/Range: Interval/Continuous; -1.579 (min) to 1.624 (max)
- Imputation Approach: n/a
- Source: Digital Society Project Dataset v2, Mechkova et al. (2019, Digital Society Project Working Paper 2019:1); Pemstein et al. (2019, V-Dem Working Paper Series 2019:21) http://digitalsocietyproject.org/data/
Varieties of Democracy: Harassment of journalists
- Description : Are individual journalists harassed — i.e., threatened with libel, arrested, imprisoned, beaten, or killed — by governmental or powerful nongovernmental actors while engaged in legitimate journalistic activities?
- Years : 2010-2020
- Countries: All
- Raw Data Type/Range: Interval/Continuous; -2.506 (min) to 1.823 (max)
- Imputation Approach: n/a
- Source: Varieties of Democracy dataset v12, Coppedge et al. 2022/Pemstein et al. 2022 https://www.v-dem.net/vdemds.htm
E26. Government Efficiency and Responsiveness : Corruption levels in government
Digital Society Survey/VDem: Abuse of defamation and copyright law by elites
- Description : To what extent do elites abuse the legal system (e.g., defamation and copyright law) to censor political speech online?
- Years : 2010-2020
- Countries: All
- Raw Data Type/Range: Interval/Continuous; -2.581 (min) to 2.047 (max)
- Imputation Approach: n/a
- Source: Digital Society Project Dataset v2, Mechkova et al. (2019, Digital Society Project Working Paper 2019:1); Pemstein et al. (2019, V-Dem Working Paper Series 2019:21) http://digitalsocietyproject.org/data/
Varieties of Democracy: Govt corruption index (#)
- Description : How pervasive is political corruption?
- Years : 2010-2020
- Countries: All
- Raw Data Type/Range: Continuous; 0-1
- Imputation Approach: n/a
- Source: Varieties of Democracy dataset v12, Coppedge et al. 2022/Pemstein et al. 2022 https://www.v-dem.net/vdemds.htm
Worldwide Governance Indicators, World Bank: Control of Corruption
- Description : Control of Corruption captures perceptions of the extent to which public power is exercised for private gain, including both petty and grand forms of corruption, as well as "capture" of the state by elites and private interests.
- Years : 2010-2020
- Countries: All
- Raw Data Type/Range: Continuous; -2.5 to 2.5
- Imputation Approach: n/a
- Source: World Bank. (2022). World Governance Indicators [Data set]. https://datacatalog.worldbank.org/dataset/worldwide-governance-indicators
Worldwide Governance Indicators, World Bank: Regulatory quality
- Description : Regulatory quality captures perceptions of the ability of the government to formulate and implement sound policies and regulations that permit and promote private sector development.
- Years : 2010-2020
- Countries: All
- Raw Data Type/Range: Continuous; -2.5 to 2.5
- Imputation Approach: n/a
- Source: World Bank. (2022). World Governance Indicators [Data set]. https://datacatalog.worldbank.org/dataset/worldwide-governance-indicators
Worldwide Governance Indicators, World Bank: Government effectiveness
- Description : Captures perceptions of the quality of public services, the quality of the civil service and the degree of its independence from political pressures, the quality of policy formulation and implementation, and the credibility of the government's commitment to such policies.
- Years : 2010-2020
- Countries: All
- Raw Data Type/Range: Continuous; -2.5 to 2.5
- Imputation Approach: n/a
- Source: World Bank. (2022). World Governance Indicators [Data set]. https://datacatalog.worldbank.org/dataset/worldwide-governance-indicators
E27. Government Efficiency and Responsiveness : Fact-checking and disinformation efforts
Digital Society Survey/VDem: Government dissemination of false information domestic (social media)
- Description : How often do the government and its agents use social media to disseminate misleading viewpoints or false information to influence its own population?
- Years : 2010-2020
- Countries: All
- Raw Data Type/Range: Interval/Continuous; -2.172 (min) to 1.76 (max)
- Imputation Approach: n/a
- Source: Digital Society Project Dataset v2, Mechkova et al. (2019, Digital Society Project Working Paper 2019:1); Pemstein et al. (2019, V-Dem Working Paper Series 2019:21) http://digitalsocietyproject.org/data/
Digital Society Survey/VDem: Foreign governments dissemination of false information (social media)
- Description : How routinely do foreign governments and their agents use social media to disseminate misleading viewpoints or false information to influence domestic politics in this country?
- Years : 2010-2020
- Countries: All
- Raw Data Type/Range: Interval/Continuous; -2.831 (min) to 1.589 (max)
- Imputation Approach: n/a
- Source: Digital Society Project Dataset v2, Mechkova et al. (2019, Digital Society Project Working Paper 2019:1); Pemstein et al. (2019, V-Dem Working Paper Series 2019:21) http://digitalsocietyproject.org/data/
Digital Society Survey/VDem: Foreign governments ads
- Description : How routinely do foreign governments and their agents use paid advertisements on social media in order to disseminate misleading viewpoints or false information to influence domestic politics in this country?
- Years : 2010-2020
- Countries: All
- Raw Data Type/Range: Interval/Continuous; -2.29 (min) to 1.232 (max)
- Imputation Approach: n/a
- Source: Digital Society Project Dataset v2, Mechkova et al. (2019, Digital Society Project Working Paper 2019:1); Pemstein et al. (2019, V-Dem Working Paper Series 2019:21) http://digitalsocietyproject.org/data/
Digital Society Survey/VDem: Government capacity to regulate online content
- Description : Does the government have sufficient staff and resources to regulate Internet content in accordance with existing law?
- Years : 2010-2020
- Countries: All
- Raw Data Type/Range: Interval/Continuous; -1.473 (min) to 2.435 (max)
- Imputation Approach: n/a
- Source: Digital Society Project Dataset v2, Mechkova et al. (2019, Digital Society Project Working Paper 2019:1); Pemstein et al. (2019, V-Dem Working Paper Series 2019:21) http://digitalsocietyproject.org/data/
United Nations E-Government Survey: E-Government index
- Description : Measures the development of national e-government capacities aggregated from three primary indicators: i) the OSI - Online Service Index that measures the online presence of the government in terms of service delivery; ii) the TII - Telecommunication Infrastructure Index iii) HCI -Human Capital Index. Constructing a model for the measurement of digitized service.
- Years : 2010, 2012, 2014, 2016, 2018, 2020
- Countries: All except Kosovo
- Raw Data Type/Range: Continuous; 0-1
- Imputation Approach: Multiple imputation (Kosovo), Averages of surrounding values (Gap years of other countries)
- Source: United Nations. Division for Public Administration, & Development Management. (2010-20). United Nations E-government Survey . UN. https://publicadministration.un.org/egovkb/en-us/Data-Center
E28. Political legitimacy and accountability: Democracy levels
Varieties of Democracy: Deliberative democracy
- Description : To what extent is the ideal of deliberative democracy achieved? The deliberative principle of democracy focuses on the process by which decisions are reached in a polity. A deliberative process is one in which public reasoning focused on the common good motivates political decisions—as contrasted with emotional appeals, solidary attachments, parochial interests, or coercion. According to this principle, democracy requires more than an aggregation of existing preferences.
- Years : 2010-2020
- Countries: All
- Raw Data Type/Range: Continuous; 0-1
- Imputation Approach: n/a
- Source: Varieties of Democracy dataset v10, Coppedge et al. 2020/Pemstein et al. 2020 https://www.v-dem.net/en/data/data/v-dem-dataset/
Varieties of Democracy: Participatory democracy
- Description : To what extent is the ideal of participatory democracy achieved? The participatory principle of democracy emphasizes active participation by citizens in all political processes, electoral and non-electoral. It is motivated by uneasiness about a bedrock practice of electoral democracy: delegating authority to representatives. Thus, direct rule by citizens is preferred, wherever practicable. This model of democracy thus takes suffrage for granted, emphasizing engagement in civil society organizations, direct democracy, and subnational elected bodies.
- Years : 2010-2020
- Countries: All
- Raw Data Type/Range: Continuous; 0-1
- Imputation Approach: n/a
- Source: Varieties of Democracy dataset v12, Coppedge et al. 2022/Pemstein et al. 2022 https://www.v-dem.net/vdemds.htm
E29. Political legitimacy and accountability: Trust in political institutions
Gallup World Poll: Approval of own government
- Description : % responding 'approve' to: Do you approve or disapprove of the job performance of the leadership of this country? Own (WP150)
- Years : 2010-2019
- Countries: Turkmenistan missing; Missing Armenia (2020), Azerbaijan (2018-20), Belarus (2011-12, 2020), Tajikistan (2018-20), and Uzbekistan (2010-14)
- Raw Data Type/Range: Continuous; 0-100 (percentage) [43]
- Imputation Approach : Multiple imputation
- Source: Gallup. (2022). Gallup World Poll, 2010-2021 [Data set]. Washington, DC: Gallup Inc.
Gallup World Poll: Disapproval of own government [44] (#)
- Description : % the do not disapprove of own government (WP150)
- Years : 2010-2020
- Countries: Turkmenistan missing; Missing Armenia (2020), Azerbaijan (2018-20), Belarus (2011-12, 2020), Tajikistan (2018-20), and Uzbekistan (2010-14)
- Raw Data Type/Range: Continuous; 0-100 (percentage) [45]
- Imputation Approach : Multiple imputation
- Source: Gallup. (2022). Gallup World Poll, 2010-2021 [Data set]. Washington, DC: Gallup Inc.
Gallup World Poll: Government corruption perception (#)
- Description : % responding 'yes' to: Is corruption widespread throughout the government in (country), or not? (WP146)
- Years : 2010-2020
- Countries: Turkmenistan and Uzbekistan missing; Missing Armenia (2020), Azerbaijan (2018-20), Belarus (2020), and Tajikistan (2018-20)
- Raw Data Type/Range: Continuous; 0-100 (percentage) [46]
- Imputation Approach : Multiple imputation
- Source: Gallup. (2022). Gallup World Poll, 2010-2021 [Data set]. Washington, DC: Gallup Inc.
[1] Geographically, these countries sit at the crossroads of Russia’s sphere of influence and that of Western organizations like the European Union (EU) and the North Atlantic Treaty Organization (NATO). Some are full or associate members of the Russia-dominated intergovernmental organization, the Commonwealth of Independent States (CIS), while others are NATO members and remain EU candidate or potential candidate countries.
[2] Having emerged from either the former Soviet Union or the non-aligned former Yugoslavia. Albania, though once communist, remains the only exception.
[3] This project was made possible with funding from the Europe & Eurasia (E&E) Bureau through a USAID/DDI/ITR Higher Education Solutions Network (HESN) cooperative agreement (AID-A-12-00096).
[4] Geographically, these countries sit at the crossroads of Russia’s sphere of influence and Western organizations like the European Union (EU) and the North Atlantic Treaty Organization (NATO). Some are full or associate members of the Russia-dominated intergovernmental organization, the Commonwealth of Independent States (CIS), while others are NATO members and remain EU candidate or potential candidate countries.
[5] Having emerged from either the former Soviet Union or the non-aligned former Yugoslavia. Albania, though once communist, remains the only exception.
[6] Foreign media capture arises when in-country media publishes content that is either (i) biased in favor of an intervening actor or (ii) created by the intervening actor but presented as domestic. We label the latter ‘avatar content.’ Disinformation is “false information spread with intent to deceive” (Keller et al., 2019, p. 3). Both media capture and disinformation are forms of non-restrictive content manipulation (NCM), as opposed to restrictive content manipulation (RCM). NCM comprises content manipulated through co-option or clandestine methods that do not overly disrupt journalists or media actors. Examples include propaganda that is presented as ‘local,’ disinformation, and seeking to bias journalists or outlets in favor or against certain actors. RCM is content manipulated by disrupting the actions of actors like journalists and media outlets. Examples include closing media outlets, censoring outlets, and implementing libel laws.
[7] One could hypothetically argue that an autocracy with a completely closed media system and draconian restrictions is resilient if it is able to successfully repel malign foreign influence. However, this condition does not fit within our framework. In our conceptualization, media resilience still shares the normative goal with media freedom that a country’s media system should provide rich, quality, diverse, and free information to its citizens as they make political and economic decisions.
[8] We struck a balance between variables that measured the concept precisely and proxy variables with availability across countries and the time period (2010 to 2020). We ultimately collected over 80 variables with various levels of missingness, proximity to the concept described in each element, and availability by country and year. We then evaluated these data further and assessed fit to the taxonomy, the similarity among other collected variables, and overall missingness. This allowed us to reduce the total number of variables, resulting in a total of 54 unique variables included in the index. Four variables map to two elements but are averaged with other variables in theoretically distinct elements and domains to create mathematically different, theory-driven indicators with which to construct our index.
[9] Table SA1 in the Appendix highlights these four missing elements.
[10] The Institutional Environment was the most complete component, at about 96%, while the Content Consumers component had the least completeness, at about 86%.
[11] Georgia and Ukraine had the highest completeness percentage, with 94.2% each. On the low end, Turkmenistan had the least data, at only 81.5% complete. This is not surprising, given Turkmenistan is a closed autocracy and it is often difficult to collect data there. Kosovo has the third lowest levels of complete data, at about 86.8%. Most United Nations (UN) data we collected do not include Kosovo, because including these data would be a de facto recognition of Kosovo as a sovereign country. Russia, Serbia, and all other countries in our sample—save Albania, Montenegro, and North Macedonia—do not recognize Kosovo’s independence.
[12] The year 2018 had the highest completeness percentage, at about 97%. On the other hand, 2019 has the least complete data, with just above 80%; this can be attributed to a typical delay of data generators not releasing their most recent data. Odd years are slightly more missing than even years.
[13] The four subregions are the Balkans (Albania, Bosnia and Herzegovina, Kosovo, Montenegro, North Macedonia, Serbia), the Caucasus (Armenia, Azerbaijan, Georgia), Central Asia (Kazakhstan, the Kyrgyz Republic, Tajikistan, Turkmenistan, and Uzbekistan), and Eastern Europe (Belarus, Moldova, and Ukraine). While all four subregions had about the same completeness of data, Eastern Europe was the most complete, at 93.3%, and Central Asia was the least complete, at 88.8%.
[14] Country-year completeness refers to the data availability among the 58 variables used to construct the index for any given country-year dyad. The table provides 187 completeness scores for each of the 187 country-year observations in the dataset. For example, Albania’s 2010 score is 94.83%, indicating that of the 58 variables we collected, 55 of 58 (94.83%) provided a data point for Albania in 2010. This also indicates that we imputed 5.17% of the data for this observation. The highest completeness was a perfect 100%, achieved by several country-year dyads in 2018, while the worst performer was Turkmenistan in 2020 with 67.24%. However, the average across countries indicates all countries above 81%, with the vast majority above 90%.
[15] Though ideal to include data released at regular and consistent intervals, this is unfortunately not always possible. However, we feel confident in this approach for the GINI coefficient, since inequality is a feature of society that changes slowly.
[16] For consistency and compatibility, we include only variables used in the taxonomy to predict missing values. For most data, we use all complete, non-missing variables in the index as predictors to impute the missing values. We perform 100,000 iterations for each variable, producing 1,000 draws from the data using a normal distribution and then take the average of those 1,000 draws to create a new variable with imputed data. The process retains the original, non-missing manifest values provided by the dataset. We implement this procedure for all tier-three variables with missing values from 2010 to 2020. For variables with completely missing data, such as Kosovo for United Nations Development Programme’s Education index, the Bayesian procedure uses multiple regression of other variables in the dataset to impute missing values. While this imputation approach is not a perfect solution, we recognize that excluding variables to avoid Kosovo’s complete missingness might induce other biases.
[17] We standardize the raw data in the sample, that is the 187 observations in the 17 countries from 2010 to 2020, as opposed to the entire variable, which might include other countries and years.
[18] Note that 100 on the new scale does not imply that a country has reached the highest manifestation possible in the original, underlying dataset(s). Additionally, 0 to 100 is the index scale and not a percentage.
[19] We note that these averages are not weighted. There is no obvious theoretical or statistical reason to weigh one component over the other.
[20] The countries below the second quartile are roughly below the sample average (52.47), thus we cluster them into the lowest group. The middle group corresponds with values roughly between the 2nd and 3rd quartiles, while the highest group corresponds to those countries that land above the upper quartile.
[21] “Revising the Regulatory Environment for Media in Montenegro.” Karanovic Partners. Published September 2020. URL: https://www.lexology.com/library/detail.aspx?g=1af28765-3e3e-4095-bf64-d73ecbf96a54 .
[22] While initially repealed in late 2020, another version went into effect June 2022 in response to Russia’s invasion of Ukraine. See Necsutu, Madalin. “Moldova Bans Russian Media to Counter Propaganda Over Ukraine.” Balkan Insight. Published June 20, 2022. URL: https://balkaninsight.com/2022/06/20/moldova-bans-russian-media-to-counter-propaganda-over-ukraine/ .
[23] Specifically, some media experts have expressed concern that overly restrictive legislation could inadvertently create the conditions for increased monopolization and reduced diversity of local media markets as some outlets disappear, along with hampered free speech (IREX, 2016).
[24] We note that the Kyrgyz Republic was rated Partially Free throughout the sample period until Freedom House downgraded it to Not Free in 2020.
[25] We combine lower and lower middle income classifications since the World Bank only considers 10 observations (seven in Tajikistan from 2010-13 and 2017-19, and three in the Kyrgyz Republic from 2010-12) as lower income, an inadequate sample size for comparison.
[26] According to the World Bank’s historical income level classifications (retrieved from https://datahelpdesk.worldbank.org/knowledgebase/articles/906519-world-bank-country-and-lending-groups ).
[27] The correlation coefficient is -0.07.
[28] We present similar bar charts for each of the 17 E&E countries Figures 3SAa-b in the Appendix.
[29] Table SA4 in the Appendix shows the measure of typical change among each country's three components for all 17 E&E countries.
[30] We note that either content consumers or content producers were sometimes the component with the highest scores. Besides Kosovo, other countries where the institutional environment was lowest scoring include the Kyrgyz Republic, Armenia, Kosovo, Moldova, Kazakhstan, and Tajikistan. See Appendix Figures SA3a-b for the full country breakdown.
[31] Transparency International’s Corruption Perceptions Index 2021 ranking of Kosovo indicates some improvements, with Kosovo jumping 17 spots to 85 out of 180 countries. Higher spots indicate less corruption. See: Isufi, Antigonë. “Kosovo’s Rise in Transparency’s Corruption Index Welcomed.” Prishtina Insight. Published January 25, 2022. URL: https://prishtinainsight.com/kosovos-rise-in-transparencys-corruption-index-welcomed/ .
[32] This can be seen even more clearly in Figures SA5a-c in the Appendix.
[33] See more detailed information here: https://stats.oarc.ucla.edu/spss/faq/what-does-cronbachs-alpha-mean/ .
[34] Ibid.
[35] See more information about historical classifications here: https://datahelpdesk.worldbank.org/knowledgebase/articles/906519-world-bank-country-and-lending-groups .
[36] Because this irregular range is not useful for our purposes, we only provide the range of the subset of the 17 E&E countries from 2010-2020.
[37] Respondent-level responses transformed to country-year data for index.
[38] Respondent-level responses transformed to country-year data for index.
[39] Respondent-level responses transformed to country-year data for index.
[40] As scores increase and move closer to 10, proven trust in society increases.
[41] Respondent-level responses transformed to country-year data for index.
[42] Respondent-level responses transformed to country-year data for index.
[43] Respondent-level responses transformed to country-year data for index.
[44] Due to the ‘Don’t know’ option Gallup provides to respondents, disapproval is not the inverse of approval.
[45] Respondent-level responses transformed to country-year data for index.
[46] Respondent-level responses transformed to country-year data for index.