Listening to Leaders 2025
Development cooperation over a decade of disruption
Samantha Custer, Ana Horigoshi, Bentje Boer, and Kelsey Marshall
April 2025
1. Introduction: Development cooperation in a time of disruption
1.1 A decade of Listening to Leaders—who, what, and why?
1.1.2 Which development partners?
1.1.3 How did leaders share their views, and on which topics?
2. Footprint: With whom are Global South leaders working?
2.1 The footprint of development cooperation in 2024
2.2 Changes over time in the footprint of development cooperation
3. Performance: How do leaders rate development partners?
3.1 The perceived performance of development partners in 2024
3.1.1 Global heavyweights: Top performers across geographies and sectors
3.1.2 Specialized star power: Niche areas of comparative advantage
3.2 Changes over time in the ratings of development partner performance
4. Attraction: What do leaders look for in their partners?
4.1 Performance perceptions across leaders of different types
4.2 What makes development partners influential and helpful?
4.3 What attributes do leaders value most in a development partner?
Figure 1. Expansion in geographic coverage of the Listening to Leaders Survey, 2014 to 2024
Table 1. Listening to Leaders: Sampling frame and sample for analysis
Table 2. Development partners with their acronyms, by cohort
Figure 2. Top 10 largest development partners overall by perceived footprint, 2024
Figure 3. Perceived footprint of traditional multilaterals as a cohort, 2024 snapshot
Figure 4. Perceived footprint of traditional bilaterals as a cohort, 2024 snapshot
Figure 5. Perceived footprint of non-traditional bilaterals as a cohort, 2024 snapshot
Figure 6. Perceived footprint of non-traditional multilaterals as a cohort, 2024 snapshot
Figure 8. Change in footprint, traditional multilaterals, 2017 to 2024
Figure 9. Change in footprint, traditional bilaterals, 2017 to 2024
Table 3. Historical ODA (2023) and announced aid budget cuts by selected traditional bilaterals
Figure 10. Change in footprint, non-traditional bilaterals, 2017 to 2024
Figure 11. Top 10 most influential development partners overall, 2024
Figure 12. Top 10 most helpful development partners overall, 2024
Figure 13. Influence by region and sector, top 35 development partners, 2024
Figure 14. Helpfulness by region and sector, top 35 development partners, 2024
Box 1. Looking back at a decade of U.S. performance to anticipate potential future changes
Figure 15. Why did respondents view development partners as being influential?
Figure 16. Why did respondents view development partners as being helpful?
Figure 17. What did leaders say they valued most in a development partner?
Figure 18. What did leaders say made a development partner adaptable?
Figure 19. What did leaders say made a development partner prioritize long-term planning?
Acronyms
ADB Asian Development Bank
AFDB African Development Bank
AIIB Asian Infrastructure and Investment Bank
AMF Arab Monetary Fund
ARE United Arab Emirates
AUS Australia
AUT Austria
BADEA Arab Bank for Economic Development in Africa
BEL Belgium
BM GF Gates Foundation (formerly Bill and Melinda Gates Foundation)
BRA Brazil
BRI Belt and Road Initiative
BRICS Brazil, Russia, India, China, and South Africa
CAF Development Bank of Latin America and the Caribbean
CABEI Central American Bank for Economic Integration
CAN Canada
CDB Caribbean Development Bank
CHE Switzerland
CHN China
CSO Civil society organization
DAC Development Assistance Committee
DEU Germany
DFC Development Finance Corporation
DNK Denmark
DoS US Department of State
EAP East Asia and Pacific
EBRD European Bank for Reconstruction and Development
ECA Europe and Central Asia
ESP Spain
EU European Union
FAO Food and Agriculture Organization
FF Ford Foundation
FIN Finland
FRA Framce
GAVI Global Alliance for Vaccines and Immunization
GBR Great Britain/United Kingdom
GCF Green Climate Fund
GEF Global Environment Facility
GF Global Fund to Fight AIDS, Tuberculosis, and Malaria
G7 Group of Seven
IDB Inter-American Development Bank
IFAD International Fund for Agricultural Development
IFC International Finance Corporation
IFI International Finance Institution
IMF International Monetary Fund
IND India
IRL Ireland
ISDB Islamic Development Bank
ISR Israel
ITA Italy
JBIC Japan Bank for International Cooperation
JICA Japan International Cooperation Agency
JPN Japan
KOR South Korea
KWT Kuwait
LAC Latin America and the Caribbean
LBY Libya
LIC Low-income country
LtL Listening to Leaders
LUX Luxembourg
MCC Millennium Challenge Corporation
MEX Mexico
MENA Middle East and North Africa
MIGA Multilateral Investment Guarantee Agency
NGO Non-governmental organization
NLD Netherlands
NOR Norway
NZL New Zealand
ODA Official development assistance
OECD Organization for Economic Co-operation and Development
OFID OPEC Fund for International Development
OPEC Organization for Petroleum Exporting Countries
PRT Portugal
QAT Qatar
RUS Russia
SA South Asia
SAU Saudi Arabia
SDGs Sustainable Development Goals
SIDS Small Island Developing States
SSA Sub-Saharan Africa
SWE Sweden
TUR Turkey
TWN Taiwan
UAE United Arab Emirates
UK United Kingdom
UN United Nations
UNDP United Nations Development Program
UNEP United Nations Environment Program
UNESCO United Nations Educational, Scientific, and Cultural Organization
UNICEF United Nations Children’s Fund
UNFPA United Nations Population Fund
U.S. United States
USA United States of America
USAID U.S. Agency for International Development
VEN Venezuela
WB World Bank
WFP World Food Program
WHO World Health Organization
ZAF South Africa
Executive Summary
Disruption has defined the last decade of development cooperation—from climate change and global epidemics to persistent conflicts and geopolitical competition. To preserve past gains and advance progress, Global South countries mobilized domestic resources at home and cooperated with numerous bilateral agencies and multilateral organizations from abroad. Using four AidData surveys conducted between 2014 and 2024, we analyze how leaders representing 148 countries and territories rate the performance of their external development partners, how these attitudes evolved over the decade, and what factors might explain these perceptions.
We use the term leader broadly to include mid- to senior-level government officials, representatives from civil society and the private sector, and independent experts from universities, media, and think tanks who work closely with development partners in their countries. In this report, we examine the performance of individual development partners against the full field of players and compared to those in their closest cohort group: traditional OECD bilaterals, traditional multilaterals, non-traditional bilaterals, and non-traditional or Southern-led multilaterals. We collapse responses for all agencies flying the same flag into a unified score for each measure.
Footprint: With whom are Global South leaders working?
Global South leaders reported receiving advice or assistance from 71 bilateral and multilateral actors in the 2024 survey wave. We calculate the percentage of respondents who reported receiving advice or assistance from each development partner to measure that actor’s footprint. This measure provides important context to understand the size and diversity of each development partner’s constituency base. Typically, the largest partners worked with one-fifth or more of the leaders surveyed, while the smallest worked with 1 percent or fewer.
Three key takeaways about the footprint of development cooperation over the last decade:
- Traditional multilaterals and OECD bilaterals still worked with the most Global South leaders in 2024, proving durable in an age of expanded choice
- Despite waning multilateralism, traditional multilaterals held steady or expanded their footprints, while many OECD bilaterals have lost ground since 2017
- China remains the front-runner among non-traditional players, both bilateral or multilateral, and works with more leaders and countries, but this growth may be slowing
Performance: How do leaders rate development partners?
Global South leaders generally viewed their development partners favorably. In 2024, the average development partner was rated as influential by roughly three-quarters (72.4 percent) of the leaders they worked with and helpful by four-fifths (81.8 percent) of this group. However, averages can obscure attitudes towards specific partners. There was a 37 percentage point difference between the most and least influential development partners, the Global Fund (92.1 percent) and Brazil (55.1 percent), in 2024. That year, there was a gap of 29 percentage points between the most and least helpful partners, Portugal (96 percent) and Qatar (67 percent).
Two key takeaways about the performance of development cooperation over the last decade:
- Non-traditional players have not yet displaced traditional multilaterals and OECD bilaterals, who still dominated the leaderboard on influence and helpfulness in 2024
- BRICS and Middle Eastern development partners were among the most improved, charting big performance gains over the decade, but still lagging traditional players
Attraction: What do Global South leaders look for in their partners?
The decisions of bilateral aid agencies and multilateral organizations regarding how much they are willing to invest, where, and in what certainly affect the choices available. However, Global South leaders ultimately determine with whom they want to partner to catalyze socio-economic progress for their countries. In this report, we assessed the odds that leaders of different types rate development partners more or less favorably, examine the ingredients leaders consider important in explaining the performance of development partners, and assess the attributes leaders say they value most in a partner.
Three takeaways about what development partners look for in their partners:
- Money matters, but leaders in some country contexts—lower income, democratic, and moderately vulnerable countries—are more predisposed than others to view partners favorably
- Resources, respect, and relationships were top-of-mind for Global South leaders explaining what made development partners top performers
- Global South leaders place a premium on development partners willing to adapt their strategies to local needs and plan for long-term sustainability
Conclusion: Reimagining future development cooperation
If the past decade was one of disruption, the next decade does not promise fairer weather for development cooperation. Traditional bilaterals are retreating from earlier official development assistance commitments. Multilaterals must contend with rising skepticism and declining core contributions. Global South countries are questioning whether conventional aid has done more harm than good, while rising powers are challenging the traditional rules of the game and advocating for South-South Cooperation as a sustainable alternative.
In the next decade, development cooperation will likely be reimagined, as government and international organizations revisit how they create, finance, and deliver value in support of Global South countries. As we consider how development cooperation can and should evolve, the Listening to Leaders surveys highlight three opportunities for action:
- Reorient future cooperation around shared prosperity and mutual benefit: Bilateral cooperation could identify areas of shared interest that are responsive to what Global South counterparts want, while strategically aligned with a donor’s national interests.
- Safeguard multilateral venues with an expanded voice for middle powers: Traditional multilaterals could position themselves as trustworthy venues to adjudicate between conflicting interests in ways that strengthen the negotiating power of non-traditional development partners and low- and middle-income countries. As traditional bilaterals cut back their aid and engagement, non-traditional development partners and Global South countries may increasingly represent the future of multilateral cooperation.
- Get serious about policy coherence and a broader suite of economic tools: As aid is likely to be in increasingly short supply in the coming decade, it will be even more important for development partners to focus on creating synergies between aid and other tools of economic statecraft, such as trade, foreign direct investment, and remittances. This implies that international organizations and government agencies need to walk the talk of “policy coherence,” ensuring broader economic policies are helping, not hindering, this goal.
Acknowledgments
The 2025 Listening to Leaders (LtL) report was prepared by Samantha Custer, Ana Horigoshi, Bentje Boer, and Kelsey Marshall (AidData, William & Mary). John Custer and Sarina Patterson supported this publication’s layout, editing, and visuals. This edition spans four global surveys conducted by AidData over a decade (2014, 2017, 2020, 2024). In this respect, this publication would not have been possible without the support of many individuals who gave their time and talents as research assistants, collaborators, or external reviewers over the years.
Although they remain unnamed to maintain anonymity, this research crucially relied upon the more than 20,000 responses from survey participants from 148 countries and semi-autonomous territories, who shared their invaluable insights on development partner performance. We also appreciate supportive funding partners who contributed general operating support to the survey or commissioned custom analyses that defrayed the cost of providing this report as a public good. The findings and conclusions of this report are those of the authors alone and do not necessarily reflect the views of our funders and partners.
We express our sincere gratitude to each of the following individuals and institutions for their invaluable contributions to one or more of the surveys featured in this report:
- LtL Staff and Research Assistants: Nour Aburish, Harrison Abramsohn, Brandon Aheimer, Raffaela Alhach, Mehr Ali, Nada Aljassar, Lana Altunashvili, Grace Anderson, Haley Arata, Dawn Bangi, Abigail Barnes, Danielle Batterman, Khadijah Bea, Alondra Belford, Andrew Bell, Ori Ben-Ari, Anne Bergman, Bentje Boer, Hanna Borgestedt, Heather Blackwell, Hunter Blackwell, Michael Blakely, Eric Brewer, Daniel Brot, Grace Bruce, Bryan Burgess, Riley Busbee, Matthew Bynum, Caroline Byrne, Gabriella Cao, Nicholas Cardozo, Mengfan Cheng, Vera Choo, Riley Companion, Abigail Crews, Jasmine Curry, Samantha Custer, Makayla Cutter, Ashley Darang, Caroline Davis, Megan Davis, Damiana Dendy, Catherine Denton, Sarah DeVellis, Matt DiLorenzo, Jack Doherty, Sarah Dowless, Hanyi Dou, Emily Dumont, John Eckert, Codi Elliott, Salma Elsayed-Ali, Weldon Emerson, Madeleine Engler, Agustina Eskenazi, Khaile Forbes, Julia Gloudeman, Lexi Godfrey, Leonor Grave, Riley Graham, Emma Groene, Maria Haddad, Elizabeth Hagen, Hannah Hampton, Thompson Hangen, Carrie Hartgrove, Duenya Hassan, John Hoskins, Sariah Harmer, Ani Harutyunyan, Cassie Heyman-Schrum, Ana Horigoshi, Amber Hutchinson, Megan Jenkins, JT Kaufmann, Patrick Kavanaugh, Luka Klimaviciute, Rodney Knight, Emma Landi, Rebecca Latourell, Kristen Lauritzen, Lisa Lee, Hannah Lee, Nicholas Lee, Ziwei Li, Jason Lin, Haowen Liu, Jingjing Liu, Samyuktha Mahadevan, Kelsey Marshall, Takaaki Masaki, Benoit Mathieu, Caitlin McTiernan, Austin Morrison, Rachel McGraw, Holden Mershon, Noelle Mlynarczyk, Ankita Mohan, Lehman Montgomery, Erin Murphy, Salina Natnael, Cassie Nestor, Kara Newman, Caroline Nutter, Matthew Nwaneri, Yaw Ofori-Addae, Ben Olinger, Laura Opsahl-Ong, Joanne Owens, Catalina Palma, Bradley Parks, Elaine Perkins, Megan Pierce, Ryan Posthumus, Laura Powell, Brigid Rawdon, Chesney Reid, Zachary Rice, Joshua Richards, Grace Riley, Kristin Ritchey, Peter Rizkallah, John Roakes, Jacob Rodrigues, Allison Rohrer, Christopher Rossi, Sarah Salem, Annelise Schader, Claudia Segura, Tanya Sethi, Rose Shafer, Ramona Shelton, Shahzeb Siddiqui, Madeline Smith, Rafael Snell-Feikema, Chris Soldan, Minkyong Song, Megan Steele, Alena Stern, Lauren Su, Adrianne Sugden, Rishya Suresh, Anahita Suri, Michael Testa, Semira Tewolde, Brendan Thomas, Jessica Tiblin, Morgan Tompkins, Undra Tsend, Jioni Tuck, Marie Tummarello, Halla Walcott, Dongyang Wang, Clara Waterman, Brianna Vetter, Mikayla Williams, Taylor Wilson, Diana Winters, Angela Yost, Alex Yung, and Jack Zhang
- LtL Peer Collaborators and External Reviewers: Jihee Ahn, Norma Altshuler, Rob Blair, Bryan Burgess, Grant Cameron, Maria Arnal Canudo, Jack Cornforth, John Custer, Matt DiLorenzo, Elizabeth Dodds, Emilie Efronson, Catherin Elkins, Joerg Faust, Sharon Felzer, David de Ferantti, Anthony Gao, Rasmus Heltberg, Mirko Heinzel, Jennifer Hudson, Galina Kalvatcheva, Parker Kim, Paige Kirby, Charlotte Lane, Rachel Leeds, Ammar A. Malik, Peter McDermott, Ida McDonnell, David McNair, Ahmed Naseer, Kathy Nolan, NORC at the University of Chicago, Soomin Oh, Brad Parks, Sarina Patterson, Suma Pratyusha, Annalisa Prizzon, Bernhard Reinsberg, Phil Roessler, Mark Skeith, Ariel Swan, and Llanco Talamantes, Huitang Tang, Jennifer Turner, Jessica Wells, Hannah Wheatley, and Alex Wooley
- LtL Contributing Funders: Danish International Development Agency (Danida), Ford Foundation, Gates Foundation, Germany’s Federal Ministry for Economic Cooperation and Development, German Institute for Development Evaluation (DEval), Inter-American Development Bank, International Monetary Fund, John Templeton Foundation, London School of Economics and Political Science, Smith Richardson Foundation, United Kingdom Foreign Commonwealth and Development Office, United Nations Development Program, United States Agency for International Development, the University of Glasgow, William & Mary, World Bank, William and Flora Hewlett Foundation
Citation
Custer, S., Horigoshi, A., Boer, B., and K. Marshall. (2025). Listening to Leaders 2025: Development cooperation over a decade of disruption. Williamsburg, VA: AidData at William & Mary.
1. Introduction: Development cooperation in a time of disruption
If there is a single word that describes the landscape of development cooperation [1] over the last decade, it is disruption. Extreme weather events and global pandemics spared no country and compounded vulnerabilities for resource-constrained communities (World Economic Forum, 2025; OECD, 2023a; Fund for Peace, 2022). Hot conflicts became more numerous and cyclical, threatening long-term development gains across continents (Ero and Atwood, 2024; Palik et al., 2022). Intensified geopolitical competition encouraged countries to be more transactional in their foreign policy, with development as a venue for contestation (Ikenberry, 2025 ; Aly et al., 2025). Inequality within countries rose, even as it fell between countries, fueling distrust in institutions and apathy towards democracy (UN, n.d.; Wike and Fetterolf, 2021).
To navigate this decade of disruption, leaders in low- and middle-income countries mobilized domestic resources and ingenuity at home while partnering with many external development partners—bilateral aid agencies and multilateral organizations—from abroad. This report analyzes the performance of these external development partners in delivering value to those who rely on their policy advice or financial assistance. It surfaces 360-degree feedback on performance from the perspective of public, private, and civil society leaders who make and shape development policies in the Global South. It does not attempt to synthesize or duplicate the array of studies that assess aid’s effectiveness at the project, community, or portfolio level. Nor does this publication replicate critical global trends analysis of leading institutions that assess risks, monitor progress, and track hotspots of poverty and deprivation.
For more than a decade, AidData (a research lab at William & Mary’s Global Research Institute) has been at the forefront of efforts to help development partners better respond to the priorities, preferences, and perspectives of counterparts in low- and middle-income countries. In this report, we bring together for the first time four of our global Listening to Leaders (LtL) surveys conducted at critical intervals during this decade of disruption in 2014, 2017, 2020, and 2024. These surveys covered a wide range of topics, some of which will be analyzed in subsequent publications. In this report, we focus on a subset of responses related to three perception-based measures of how leaders interact with international development partners:
- Footprint: From which development partners do Global South leaders receive advice or assistance, and how has this evolved?
- Influence: Which development partners are most and least influential in shaping the domestic policy priorities of leaders in the Global South—and why?
- Helpfulness: Which development partners do Global South leaders consider most and least helpful in implementing policy changes in their countries, and why?
The answers to these questions are valuable in several use cases. Development partners can use this information to optimize future assistance efforts. Global South leaders and watchdog groups can leverage this data to inform dialogue with development partners over reforms to make assistance more accountable and responsive. In a world where multiple powers jockey for competitive advantage, policymakers may also find these insights useful for conversations about whether and under what conditions development finance helps them project global influence.
In the remainder of this chapter, we provide more information about how we use the Listening to Leaders survey to answer our three research questions by describing (i) who participated in the survey, (ii) which development partners they evaluated, and (iii) on which dimensions partners were assessed.
1.1 A decade of Listening to Leaders—who, what, and why?
Government officials, private sector leaders, and civil society representatives influence innumerable decisions that affect their country’s development trajectory and relations with external partners. Yet, there is a dearth of information readily available about the preferences and experiences of these influential elites. Over the past decade, AidData has surveyed public, private, and civil society leaders across 100+ countries and semi-autonomous territories about their development priorities and experiences working with various partners. Each survey was conducted online via the Qualtrics management platform over 4 to 6 weeks.
The four waves of the LtL survey span eleven years (2014-2024), which allows us to analyze how leaders’ attitudes toward development partners change over time. Of the 20,269 survey responses received from leaders over the years, this report focuses on the roughly 13,000 responses that rated development partner performance. While we only briefly introduce the LtL survey here, the technical appendix provides additional detail.
1.1.1 Which leaders?
AidData uses the term “leader” broadly to capture perspectives from a range of individuals who make or shape development policy across the Global South. A panoply of polls tracks citizen priorities and attitudes towards foreign powers or institutions in the general population. It has historically been more difficult to surface the viewpoints of Global South policymakers who directly interact with the marketplace of development finance suppliers. Listening to Leaders is uniquely positioned to help close this gap by focusing on individuals who, because of their positions and expertise, work most closely with development partners and whose familiarity with these actors better equips them to evaluate their performance.
Common hurdles in conducting elite surveys include identifying who holds relevant knowledge to share, contacting these individuals, and motivating them to share their perspectives. While the true population of Global South leaders involved in making and shaping development policy is largely unobservable, our methodology produces the next best thing: a well-defined sampling frame systematically curated over ten years to roughly represent the population of interest across 23 sectors of development policy.
Rather than the convenience samples used by market research firms, AidData uses institutional position maps to identify positions and people within government agencies and organizations who make or shape decisions relevant to our research questions. The 2024 sampling frame included 66,000 individuals representing diverse stakeholder groups of interest covering 148 countries and semi-autonomous territories. Stakeholder groups in the sampling frame include: (i) mid-level to senior government officials working in executive branch agencies; (ii) representatives of civil society organizations (CSOs) and non-governmental organizations (NGOs) who implement projects and advocate for policies; (iii) leaders of private sector companies; (iv) local representative of bilateral and multilateral development partners operating in country; (v) independent experts from universities, think tanks, and media; and (vi) parliamentarians.
Our development of the sampling frame has been relatively consistent over the past decade. Beyond annual updating, the research team made minimal alterations to four stakeholder groups across the LtL survey waves, including: government officials, civil society, private sector, and local development partner representatives. In some cases, we fine-tuned stakeholder groups to better capture the population of interest. In 2020, the independent expert category was refined to focus on in-country experts; previously, it allowed for the inclusion of experts outside the country. A new group for parliamentarians was added in 2020 but dropped in 2024. AidData expanded the sampling frame to include additional geographic areas from 126 countries and territories in 2014, to 141 in 2020, and 148 in 2024 (see Figure 1).
Fielded between February and June 2024, 49,000 individuals successfully received an email invitation to participate in the 2024 Listening to Leaders survey. Of these individuals, 3,250 participated for an overall survey response rate of 6.58 percent. Table 1 below summarizes the sampling frame, sample, and response rate information for each of the four LtL surveys in general, and specifically for the partner performance module. Individual-level participation rates in email and elite surveys tend to be lower than those of household and in-person surveys.
Figure 1. Expansion in geographic coverage of the Listening to Leaders Survey, 2014 to 2024
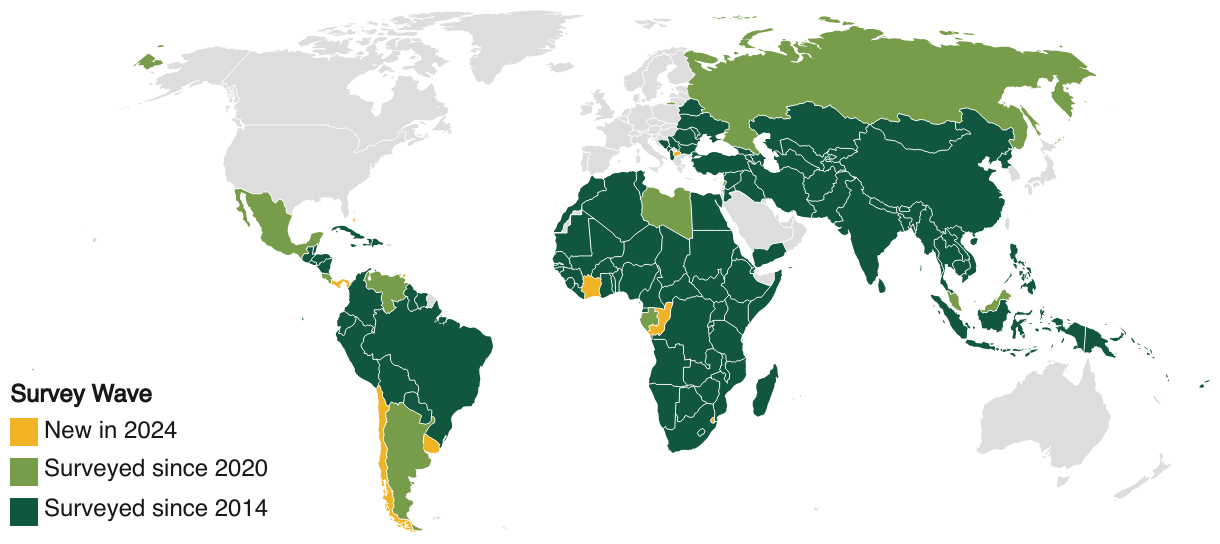
Table 1. Listening to Leaders: Sampling frame and sample for analysis
LtL 2014 (W1) | LtL 2017 (W2) | LtL 2020 (W3) | LtL 2024 (W4) | |
Number of countries and semi-autonomous territories surveyed | 126 | 126 | 141 | 148 |
Sampling frame size (approximately) | 55,000 | 58,000 | 100,000 | 66,000 |
Successfully received the email (approximately) | 43,000 | 47,000 | 84,000 | 49,000 |
Respondents who answered any questions | 6,744 | 3,468 | 6,807 | 3,250 |
Response rate overall | 15.7% | 7.4% | 8.1% | 6.6% |
Respondents who answered questions about the influence or helpfulness of any development partner | 4,474 | 1,941 | 4,046 | 2,441 |
Response rate for influence/helpfulness module only | 10.4% | 4.1% | 4.8% | 5.0% |
Notes: The larger sampling frame in 2020 was due to the inclusion of parliamentarians.
Given imperfect information about the representativeness of our sample vis-à-vis the sampling frame, AidData mitigates potential bias in our surveys in three ways: (i) we develop a robust sampling frame of individuals who represent our target population of interest to ensure there is a large enough set of final respondents to facilitate this analysis; (ii) we collect data to monitor the demographics of those who receive an invitation versus those who respond to the survey to assess representativeness; and (iii) we use non-response weights when computing aggregate statistics (e.g., arithmetic means) from the survey results.
The LtL surveys offer comparability of responses for a common set of questions about perceptions of a large field of development partners across waves, between multiple cohorts of interest (e.g., sector, geography, gender), and using standardized scales. The sample size is sufficiently large to conduct descriptive trend analysis and test the explanatory power of donor-level, country-level, and individual factors that may shape leader perceptions. To facilitate these analyses, AidData leverages anonymized demographic information provided by the survey respondents (e.g., stakeholder group, [2] policy domain, country, education, work experience), along with secondary data sources for country attributes and development partner financial portfolios.
1.1.2 Which development partners?
In this report, we use development partners as an inclusive term to describe a range of external actors that provide an array of assistance to low- and middle-income countries—from financial assistance (e.g., grants and loans at varying degrees of concessionality) to technical assistance (e.g., advisory services and other non-financial support). A unique advantage of the LtL surveys, compared to agency-specific instruments or those limited to a subgroup of similar donors, is the opportunity to assess performance against a broad and diverse field of assistance suppliers, including bilateral and multilateral actors and traditional and non-traditional players.
In this last decade of disruption, countries have more choices of “non-traditional” development partners. South-South Cooperation providers, large and small, have expanded their bilateral assistance efforts and formed new multilateral agencies (Asmus et al., 2017; UN OSSC, 2024; Bhattacharya et al., 2025). Private philanthropies such as the Gates Foundation rival sovereign nations in the size of their grant-making (Burgess and Custer, 2023). [3] And international financial markets and private sector companies supply debt financing and management expertise for Global South leaders (Custer et al., 2023).
“Traditional” assistance providers, meanwhile, are experiencing disruption. The OECD’s Development Assistance Committee (DAC) club of advanced economies is experiencing populist movements and economic slowdowns, which create pressure to reduce aid budgets and consolidate agencies (Davies, 2025; Aly et al., 2024). Canada, Australia, and the United Kingdom (UK) closed their independent aid agencies, integrating aid within their foreign ministries (Mathew and Custer, 2023). In early 2025, the United States (U.S.) dismantl ed its U.S. Agency for International Development (USAID) (White House, 2025a and 2025b; Knickmeyer and Sherman, 2025). Multilaterals like the United Nations (UN) system and the World Bank (WB) see declining core contributions from advanced economies, shifting resources to issue-specific vertical funds, and mounting calls for reform (Hendra, 2024; OECD, 2024; G20, 2024).
AidData asks leaders to identify the development partners who had provided them with advice or assistance within the last five years before a survey was fielded (e.g., the 2024 survey asked about the 2020 to 2024 period) out of a list of 118 development partners, including 83 bilateral aid agencies, 32 multilateral development banks or intergovernmental organizations, and 3 private foundations. [4] In this report, we examine the performance of individual development partners against the full field of players, as well as compare each partner with those in their closest cohort group: traditional OECD bilaterals (e.g., Germany, Japan), traditional multilaterals (e.g., UN, WB), non-traditional bilaterals (e.g., China, Mexico), and non-traditional or Southern-led multilaterals (e.g., the Asian Infrastructure Investment Bank, the Islamic Development Bank).
Although a bilateral actor may be represented by more than one agency, in this report, we collapse the responses for all agencies flying the same flag into a single, unified picture for each perception measure. [5] For example, survey respondents could select up to four Japanese entities from which they had received advice or assistance: the Japan Bank for International Cooperation (JBIC), the Japan International Cooperation Agency (JICA), the Japanese embassy (or consulate-general), and the representative office of Japan. For the sake of simplicity, we collapse those responses into a single score for Japan in this report. This analysis only includes performance ratings for development partners rated by at least 30 respondents. To request more granular information and to compare multiple agencies representing the same bilateral player, please send inquiries to info@aiddata.org.
Table 2. Development partners with their acronyms, by cohort
Traditional Bilaterals + European Union (23)
Asia-Pacific:
- Australia (AUS)
- Japan (JPN)
- New Zealand (NZL)
- South Korea (KOR)
Europe and Eurasia:
- Austria (AUT)
- Belgium (BEL)
- Denmark (DNK)
- European Union (EU)
- Finland (FIN)
- France (FRA)
- Germany (DEU)
- Ireland (IRL)
- Italy (ITA)
- Luxembourg (LUX)
- Netherlands (NLD)
- Norway (NOR)
- Portugal (PRT)
- Spain (ESP)
- Sweden (SWE)
- Switzerland (CHE)
- United Kingdom (GBR
Western Hemisphere:
- Canada (CAN)
- United States (USA)
Traditional Multilaterals (23)
Global Development Banks:
- International Finance Corporation (IFC)
- International Monetary Fund (IMF)
- Multilateral Investment Guarantee Agency (MIGA)
- World Bank (WB)
Regional Development Banks:
- African Development Bank (AFDB)
- Asian Development Bank (ADB)
- European Bank for Reconstruction and Development (EBRD)
- Inter-American Development Bank (IDB)
United Nations System:
- Food and Agriculture Organization (FAO)
- International Labor Organization (ILO)
- United Nations Children’s Fund (UNICEF)
- United Nations Development Program (UNDP)
- United Nations Educational, Scientific, and Cultural Organization (UNESCO)
- United Nations Population Fund (UNFPA),
- United Nations Environment Program (UNEP)
- United Nations Program on HIV/AIDS (UNAIDS)
- World Food Program (WFP)
- World Health Organization (WHO)
Vertical Funds:
- GAVI, the Vaccine Alliance (GAVI)
- Green Climate Fund (GCF)
- Global Environment Facility (GEF)
- Global Fund to Fight AIDS, Tuberculosis, and Malaria (GF)
Non-Traditional Bilaterals (15)
Asia-Pacific:
- China (CHN)
- India (IND)
- Taiwan (TWN)
Europe and Eurasia:
- Russia (RUS)
- Turkey (TUR)
Middle East & Africa:
- Israel (ISR)
- Kuwait (KWT)
- Libya (LBY)*
- Qatar (QAT)
- Saudi Arabia (SAU)
- South Africa (ZAF)
- United Arab Emirates (ARE)
Western Hemisphere:
- Brazil (BRA)
- Mexico (MEX)*
- Venezuela (VEN)*
Non-Traditional Multilaterals (8)
Asia-Pacific:
- Asian Infrastructure and Investment Bank (AIIB)
Middle East & Africa:
- Arab Bank for Economic Development in Africa (BADEA
- Arab Monetary Fund (AMF)
- Islamic Development Bank (ISDB)
- OPEC Fund for International Development (OFID)
Western Hemisphere:
- Caribbean Development Bank (CDB)
- Central American Bank for Economic Integration (CABEI)
- Development Bank of Latin America and the Caribbean (CAF)
Private Foundations (2)
- Ford Foundation (FF),
- Gates Foundation (BMGF)
Notes: Asterisks (*) denote that these development partners had insufficient sample sizes to meet our threshold of 30 respondents and so they were not included in analyses of the influence and helpfulness performance measures.
1.1.3 How did leaders share their views, and on which topics?
Each Listening to Leaders survey contains two core modules related to development priorities and partner performance, which feature questions that are repeated from year to year to facilitate comparability over time. Additionally, we include several special topics modules that appear in certain years to drill down on timely areas of interest. In this report, we focus specifically on the questions that asked leaders about the development partners they work with and how they rate these partners against several performance dimensions. This series of questions remained relatively consistent across each wave, with a few exceptions described below. The full questionnaire for 2024 is available in the technical appendix accompanying the report.
Respondents were first asked to identify a particular “policy initiative” they worked on in the five years before the survey. [6] We defined policy initiative as an organizational action designed to solve a particular problem. Respondents were then presented with two preset lists, [7] one with multilateral organizations and private foundations, and the second with foreign embassies and bilateral agencies, and prompted to answer two questions:
- (i) Of the following intergovernmental organizations, development banks, and private foundations, which, if any, provided [you] with advice or assistance to support this initiative ;
- (ii) Of the following foreign embassies and bilateral agencies, which, if any, provided you with advice or assistance to support this initiative.
We use answers to these two questions to produce a perception-based measure of footprint: the percentage of leaders who reported receiving advice or assistance from a development partner within the last five years. This “footprint” measure gives us a baseline of a partner's reach or visibility with key constituencies in the Global South. In Chapter 2, we only assess trends in footprint between 2017 and 2024, due to differences in how the options for this question were presented to respondents in 2014 compared to other waves. [8]
Using footprint as a baseline of who was working with whom, respondents could rate their development partners on two performance dimensions: influence and helpfulness. We defined both concepts for respondents: “influence” was the power to change or affect the policy agenda, while “ helpfulness” was being of assistance in implementing policy changes. The 2014 survey used a 5-point rating scale, while subsequent surveys moved to a 4-point scale, so the first wave responses were rescaled to facilitate historical comparability across waves. [9] Specifically, respondents were asked to answer two questions about their development partners:
- “You indicated that the foreign and international organizations below provided [organization] with advice or assistance. How influential were they on [organization] decision to pursue this initiative? Respondents select among “not at all influential,” “only slightly influential,” “quite influential,” “very influential,” “don’t know/not sure,” and “prefer not to say.”
- “You indicated that the foreign and international organizations below provided [organization] with advice or assistance. How helpful were they on [organization] decision to pursue this initiative? Respondents select among “not at all helpful,” “only slightly helpful,” “quite helpful,” “very helpful,” “don’t know/not sure,” and “prefer not to say.”
Using the answers to these questions, we produced two perception-based performance measures. Influence—the percentage of leaders who viewed a given development partner as quite or very influential—is a barometer of an external actor’s agenda-setting ability in the early stages of the policymaking process to inform countries’ domestic priorities. Helpfulness—the percentage of leaders who viewed a given development partner as quite or very helpful—is a gauge of an external actor’s delivery capacity to support the design and implementation of policy changes in the later stages of the policymaking process. In this analysis, we only include partners if they were rated by at least 30 respondents in a given survey wave. Respondents also answered questions about what makes for an influential or helpful development partner. [10]
This report uses these perception-based measures to assess how individual development partners perform over time against themselves and relative to their peers. We provide a global overview at different points in time and assess the extent to which perceptions of development partners vary across different countries, stakeholders, and sectors. Since they were evaluated using the same questions and scales, we can rank each partner’s performance in relation to other agencies, based on who was deemed influential or helpful by the highest to lowest percentages of respondents.
In our analysis, we collapsed the 23 domains of policy expertise into seven larger sector groups: economic, environment, governance, infrastructure, rural development, social, and other. Country-level responses are organized into six larger regional groups: East Asia and the Pacific (EAP), Europe and Central Asia (ECA), Latin America and the Caribbean (LAC), Middle East and North Africa (MENA), South Asia (SA), and sub-Saharan Africa (SSA).
With our introduction to the Listening to Leaders survey approach complete, the rest of the report is organized into four chapters:
- Chapter 2 (Footprint) analyzes from whom Global South leaders say they are receiving advice or assistance on development policy and how this is evolving over time.
- Chapter 3 (Performance) assesses how respondents rate the influence and helpfulness of their partners, considering how this varies across different years and leader types.
- Chapter 4 (Attraction) explores the factors that may shape leaders’ performance perceptions and what they look for in their preferred partners.
- Chapter 5 (Conclusion) reflects on how over ten years of Global South perceptions of development cooperation should inform how development partners approach the next decade.
2. Footprint: With whom are Global South leaders working?
The term development partner implies a degree of uniformity and stability in the agencies that supply advice or assistance. The opposite is true. Some variation is by design: agencies have different mandates, strategies, and resources to advance their missions. The priorities of taxpayers and shareholders play a role, as do the ambitions of allies and competitors. These constraints inform how bilateral agencies and multilateral organizations think about the countries, sectors, and types of leaders with which they want to work. At the same time, low- and middle-income countries also have a say in selecting development partners.
In this report, we use the LtL surveys to assess points of continuity and disruption in the composition of who is working with whom to advance development outcomes over a decade. In each survey wave, leaders identified which development partners (out of a list of bilateral and multilateral agencies) they had received advice or assistance from during the prior five-year period. As described in Chapter 1, we calculate the percentage of respondents who reported receiving advice or assistance from each development partner to measure that actor’s footprint.
In the remainder of this chapter, we provide a snapshot of who reported working with whom in 2024 (section 2.1) and compare how this has changed since 2017 (section 2.2). We highlight three key takeaways about the footprint of development cooperation over the past decade:
- Traditional multilaterals and OECD DAC bilaterals still worked with the most Global South leaders in 2024, proving durable in an age of expanded choice.
- Despite waning multilateralism, traditional multilaterals held steady or expanded their footprints, while many DAC bilaterals have lost ground since 2017.
- China remains the front-runner among non-traditional players, both bilateral and multilateral, and works with more leaders and countries, but this growth may be slowing.
2.1 The footprint of development cooperation in 2024
Global South leaders reported receiving advice or assistance from 71 bilateral and multilateral actors in the 2024 survey wave. Although it is not a performance measure, footprint provides important context to understand the size and diversity of each development partner’s constituency base. Smaller players have the luxury of brokering deep relationships and providing customized offerings. Larger players face trade-offs in going broad versus deep in their partnerships across the Global South. In Chapter 3, we will take a closer look at whether and how footprint corresponds with performance.
Finding #1. Traditional multilaterals and OECD DAC bilaterals still worked with the most Global South leaders in 2024, proving durable in an age of expanded choice
The 10 development partners with the largest footprints in 2024 worked with one-fifth or more of the leaders surveyed, spanning 119+ countries (Figure 2). UN agencies (e.g., UNDP, UNICEF, FAO, WHO) and international finance institutions (e.g., WB, IMF) dominated this group of global heavyweights. They were joined by bilaterals who historically had large assistance portfolios (e.g., U.S., Germany, Japan, EU). Impressively, these top footprint players were durable in their reach with leaders across geographic regions, [11] sectors, [12] and different stakeholder groups. [13] Conversely, the smallest footprint development partners worked with 1 percent or fewer of leaders. This included small South-South Cooperation providers (e.g., Libya, Venezuela, Mexico) and multilateral agencies (e.g., Central American Bank for Economic Integration, Arab Monetary Fund).
Figure 2. Top 10 largest development partners overall by perceived footprint, 2024
% respondents who said they received advice or assistance from a development partner between 2020 and 2024
Table scrolls horizontally
| Rank | Development Partner | Respondents per Partner | Percentage of All Survey Respondents | Number of Countries with at least One Respondent |
|---|---|---|---|---|
| 1 | WB | 1107 | 48.1 | 133 |
| 2 | UNDP | 1094 | 45.2 | 131 |
| 3 | EU | 970 | 40.9 | 131 |
| 4 | USA | 957 | 39.5 | 129 |
| 5 | UNICEF | 728 | 30.7 | 126 |
| 6 | WHO | 643 | 27.4 | 126 |
| 7 | IMF | 635 | 27.2 | 127 |
| 8 | DEU | 613 | 26.9 | 114 |
| 9 | JPN | 591 | 25.3 | 119 |
| 10 | FAO | 564 | 23.7 | 125 |
Notes: This figure shows the 10 development partners with the highest percentages of respondents who reported receiving advice or assistance from them between 2020 and 2024. The percentages take into account non-response weights. Sources: AidData’s 2024 Listening to Leaders Survey.
“Traditional multilaterals” refer to the UN system, the Bretton Woods institutions (the World Bank and International Monetary Fund) formed after World War II, “northern-led” regional development banks, [14] and vertical funds. The 23 traditional multilaterals tended to have the largest footprints, engaging with 17.9 percent of leaders and spanning 94 countries, on average. Large multilaterals, such as the World Bank (48 percent, 133 countries) and UNDP (45 percent, 131 countries), had expansive remits, working across geographies and sectors (see Figure 3 below). Smaller players included vertical funds—multi-stakeholder partnerships focusing on specific issues or themes (Gartner and Kharas, 2014), such as GAVI, which worked with roughly 6 percent of leaders from 62 countries.
Of course, a global snapshot can obscure the outsized importance of regionally or sectorally focused players. Four of five regional development banks assessed in this survey worked with one-fifth to one-third of the leaders from their respective focus regions. [15] Specialized UN agencies and vertical funds also had greater visibility with leaders in niche sectors and certain country types. UNEP and the GEF were among the largest players working with leaders who self-reported environmental expertise. IFAD and WFP were large players in the eyes of leaders with expertise in rural development. UNESCO, ILO, and UNFPA were among the top 10 multilateral players by footprint, working with social sector leaders. Focused on food security and reproductive health, agencies such as UNFPA and WFP also tended to be among the largest development partners for leaders from low-income and fragile states.
Figure 3. Perceived footprint of traditional multilaterals as a cohort, 2024 snapshot
% respondents who said they received advice or assistance from a traditional multilateral between 2020 and 2024
Table scrolls horizontally
| Rank | Development Partner | Respondents per Partner | Percentage of All Survey Respondents | Number of Countries with at least One Respondent |
|---|---|---|---|---|
| 1 | WB | 1107 | 48.1 | 133 |
| 2 | UNDP | 1094 | 45.2 | 131 |
| 3 | UNICEF | 728 | 30.7 | 126 |
| 4 | WHO | 643 | 27.4 | 126 |
| 5 | IMF | 635 | 27.2 | 127 |
| 6 | FAO | 564 | 23.7 | 125 |
| 7 | UNESCO | 475 | 19.4 | 122 |
| 8 | ILO | 452 | 19.1 | 113 |
| 9 | UNFPA | 423 | 17.2 | 114 |
| 10 | AFDB | 385 | 17.0 | 62 |
| 10 | WFP | 416 | 17.0 | 103 |
| 12 | ADB | 345 | 14.8 | 60 |
| 13 | UNEP | 340 | 14.6 | 110 |
| 14 | UNAIDS | 290 | 12.3 | 98 |
| 15 | GEF | 308 | 12.2 | 103 |
| 15 | IFAD | 304 | 12.2 | 96 |
| 17 | GCF | 286 | 11.7 | 102 |
| 18 | IFC | 203 | 8.7 | 81 |
| 19 | EBRD | 155 | 8.6 | 42 |
| 20 | GF | 201 | 8.2 | 83 |
| 21 | IDB | 250 | 7.8 | 40 |
| 22 | GAVI | 140 | 5.8 | 62 |
| 23 | MIGA | 42 | 1.8 | 30 |
Notes: This figure shows the percentage of respondents who reported receiving advice or assistance from a traditional multilateral between 2020 and 2024. Only development partners with a sample size of 30 respondents or more are included in this visual. The percentages also take into account non-response weights. Sources: AidData’s 2024 Listening to Leaders Survey.
“Traditional bilaterals” refer to member countries of the OECD’s Development Assistance Committee. [16] On average, the 23 traditional bilaterals assessed in the survey had the second-largest footprint of the four donor groups, engaging on average with 13.1 percent of leaders from 72 countries. [17] Although these traditional bilaterals adhere to a common set of OECD principles and standards for their assistance efforts, they are highly diverse in their footprint (Figure 4). As of 2024, one-quarter or more of leaders surveyed reported receiving advice or assistance from larger footprint players like the EU (41 percent, 131 countries), the U.S. (40 percent, 129 countries), Germany (27 percent, 114 countries), and Japan (25 percent, 119 countries). It is important to underscore that this survey predates the closure of the U.S. Agency for International Development and cuts to U.S. foreign aid programs announced in early 2025.
Some mid-sized traditional bilaterals have achieved outsized footprints with leaders from select geographic regions, country types, or focus sectors. Canada, Sweden, Australia, and Switzerland, for example, each supplied advice or assistance to only 12 to 13 percent of leaders surveyed globally. However, all four of these bilaterals were among the top 10 largest players by footprint in at least one geographic region. [18] Australia’s proximity to low-lying Pacific island nations likely explains its appearance among the top 10 largest footprint donors with leaders from small island states (SIDS). Small traditional bilaterals like Finland and Portugal worked with 3 percent or fewer leaders from 38 and 21 countries, respectively.
Figure 4. Perceived footprint of traditional bilaterals as a cohort, 2024 snapshot
% respondents who said they received advice or assistance from a traditional bilateral between 2020 and 2024
Table scrolls horizontally
| Rank | Development Partner | Respondents per Partner | Percentage of All Survey Respondents | Number of Countries with at least One Respondent |
|---|---|---|---|---|
| 1 | EU | 970 | 40.9 | 131 |
| 2 | USA | 957 | 39.5 | 129 |
| 3 | DEU | 613 | 26.9 | 114 |
| 4 | JPN | 591 | 25.3 | 119 |
| 5 | GBR | 429 | 18.2 | 104 |
| 6 | FRA | 384 | 17.2 | 100 |
| 7 | NLD | 391 | 16.6 | 87 |
| 8 | CAN | 316 | 13.1 | 93 |
| 9 | SWE | 316 | 12.7 | 64 |
| 10 | AUS | 293 | 12.0 | 60 |
| 11 | NOR | 272 | 11.6 | 77 |
| 12 | CHE | 282 | 11.5 | 81 |
| 13 | KOR | 242 | 10.5 | 88 |
| 14 | DNK | 161 | 6.7 | 57 |
| 15 | ESP | 168 | 6.2 | 56 |
| 16 | BEL | 152 | 6.1 | 50 |
| 17 | AUT | 112 | 5.1 | 40 |
| 18 | NZL | 138 | 5.0 | 33 |
| 19 | ITA | 69 | 3.6 | 43 |
| 20 | IRL | 82 | 3.3 | 39 |
| 20 | LUX | 80 | 3.3 | 34 |
| 22 | FIN | 72 | 3.0 | 38 |
| 23 | PRT | 61 | 2.1 | 21 |
Notes: This figure shows the percentage of respondents who reported receiving advice or assistance from a traditional bilateral during the period from 2020 to 2024. Percentages of respondents also take into account non-response weights. Sources: AidData’s 2024 Listening to Leaders Survey.
Non-traditional bilaterals operate outside of the OECD DAC group, including, but not limited to, donors who position their assistance as South-South Cooperation between low- and middle-income countries (UN DESA, 2019). On average, the 15 non-traditional bilaterals assessed in the survey had a much smaller footprint than their traditional peers, engaging with 3.6 percent of leaders from 40 countries. China was the elephant in the room, working with 14.4 percent of leaders across 97 countries (Figure 5) and ranking 21st among all development partners, the only non-traditional player in the top 25 development partners by footprint. Emerging contenders include India (6.2 percent, 61 countries) and Turkey (5.6 percent, 58 countries), while the remainder of the non-traditional bilaterals worked with 4 percent or fewer leaders surveyed.
Non-traditional multilaterals have the smallest footprint as a group: the eight players assessed in the survey engaged with 2.4 percent of leaders from 26 countries, on average. On the upper end, the Islamic Development Bank (ISDB) worked with nearly 6 percent of the sample, and the Arab Bank for Economic Development in Africa (BADEA) worked with 3 percent (Figure 6). On the lower end, some non-traditional multilaterals worked with 1.5 percent or fewer of the leaders surveyed. For example, the Asian Infrastructure Investment Bank (AIIB) was a relatively small player, with only 1.4 percent of respondents from 22 countries reportedly receiving its advice or assistance.
Figure 5. Perceived footprint of non-traditional bilaterals as a cohort, 2024 snapshot
% respondents who said they received advice or assistance from a non-traditional bilateral between 2020 and 2024
Table scrolls horizontally
| Rank | Development Partner | Respondents per Partner | Percentage of All Survey Respondents | Number of Countries with at least One Respondent |
|---|---|---|---|---|
| 1 | CHN | 338 | 14.4 | 97 |
| 2 | IND | 150 | 6.2 | 61 |
| 3 | TUR | 122 | 5.6 | 58 |
| 4 | ARE | 85 | 3.9 | 48 |
| 5 | BRA | 93 | 3.8 | 48 |
| 6 | SAU | 84 | 3.5 | 53 |
| 7 | KWT | 78 | 3.2 | 40 |
| 8 | QAT | 66 | 2.7 | 44 |
| 8 | TWN | 67 | 2.7 | 29 |
| 10 | RUS | 55 | 2.4 | 37 |
| 11 | ZAF | 46 | 2.2 | 28 |
| 12 | ISR | 40 | 1.7 | 27 |
| 13 | MEX | 24 | 0.7 | 13 |
| 13 | VEN | 18 | 0.7 | 14 |
| 15 | LBY | 9 | 0.3 | 9 |
Notes: This figure shows the percentage of respondents who reported receiving advice or assistance from a nontraditional bilateral during the period from 2020 to 2024. Percentages also take into account non-response weights. Sources: AidData’s 2024 Listening to Leaders Survey.
Figure 6. Perceived footprint of non-traditional multilaterals as a cohort, 2024 snapshot
% respondents who said they received advice or assistance from a non-traditional multilateral between 2020 and 2024
Table scrolls horizontally
| Rank | Development Partner | Respondents per Partner | Percentage of All Survey Respondents | Number of Countries with at least One Respondent |
|---|---|---|---|---|
| 1 | ISDB | 127 | 5.7 | 43 |
| 2 | BADEA | 78 | 3.3 | 36 |
| 3 | OFID | 63 | 2.5 | 44 |
| 4 | CDB | 59 | 2.2 | 15 |
| 5 | CAF | 71 | 2.0 | 20 |
| 6 | AIIB | 28 | 1.4 | 22 |
| 7 | AMF | 20 | 1.0 | 16 |
| 8 | CABEI | 31 | 0.9 | 9 |
Notes: This figure shows the percentage of respondents who reported receiving advice or assistance from a nontraditional multilateral during the period from 2020 to 2024. Percentages also take into account non-response weights. Sources: AidData’s 2024 Listening to Leaders Survey.
2.2 Changes over time in the footprint of development cooperation
The landscape of development cooperation is constantly evolving: new agencies form, some consolidate, and others broaden or narrow their focus sectors and geographies. How might these geopolitical dynamics change the footprint of development cooperation? The largest footprint partners—UN agencies, global international finance institutions, and several OECD DAC bilaterals—remained fairly consistent between each survey wave.
Development partners with larger pocketbooks tend to work with a greater percentage of leaders surveyed. However, money is not deterministic of footprint, and this is even less the case now than in earlier years. Although the size of a donor’s development finance portfolio and its footprint in a given recipient country remain positively correlated, the magnitude of this relationship has waned since 2017. [19] In other words, more money was less strongly linked to a large footprint in 2024 than in 2017 (Figure 7).
Figure 7. Perceived footprint and mean official development assistance, traditional bilaterals and multilaterals only, 2014-2024 period
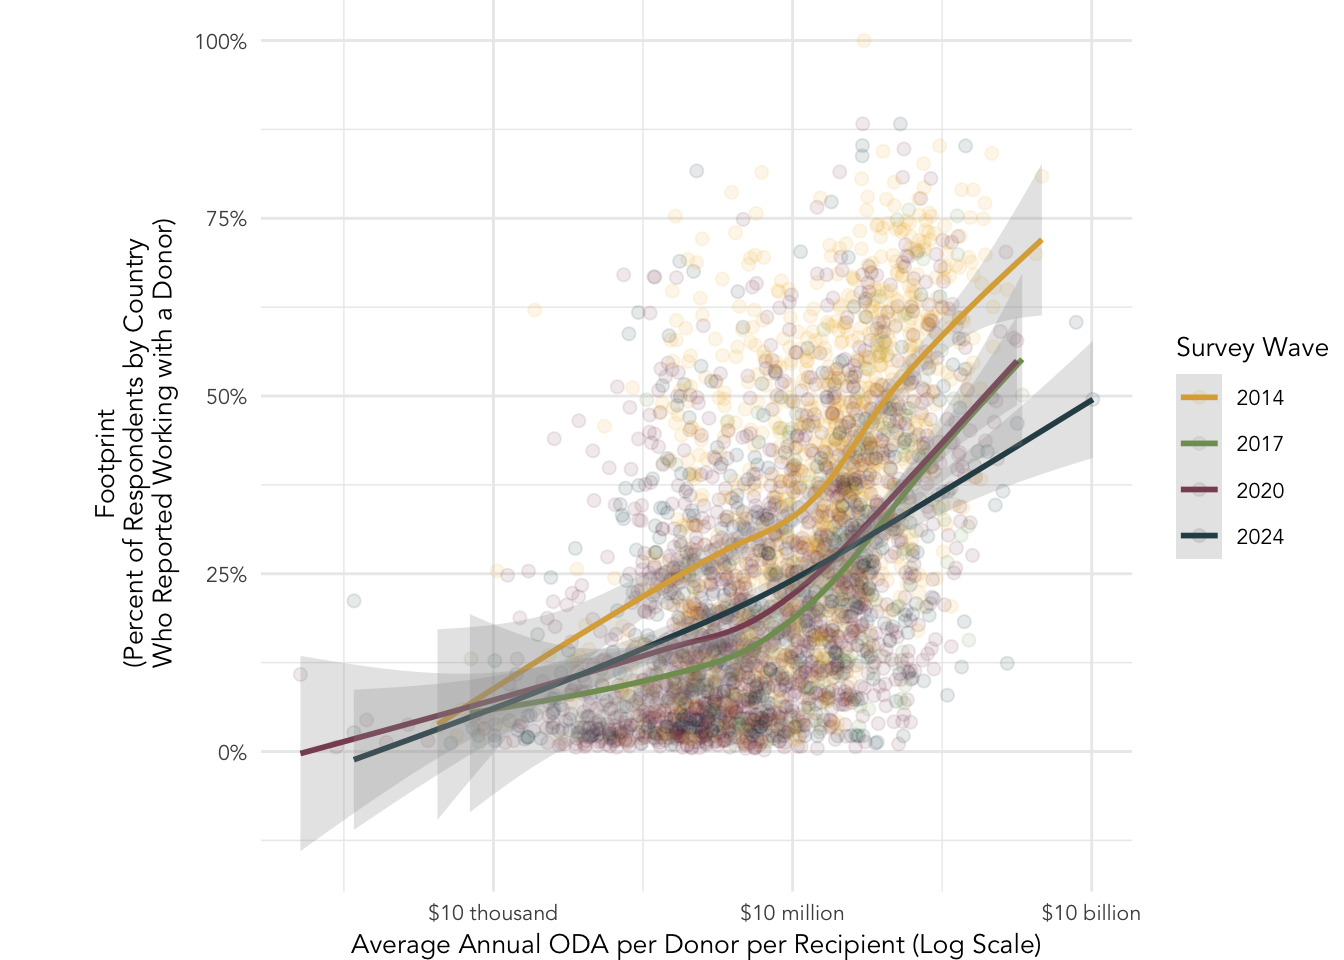
Notes: This scatterplot visualizes the relationship between footprint (the percentage of those who reported receiving advice or assistance from a given traditional bilateral) by recipient country across each of the four survey waves and the official development assistance disbursements of those players (log of mean ODA flows for 2014-2023). The percentages of respondents take into account non-response weights. Average annual ODA was calculated using three years of reported disbursements prior to each survey wave. Sources: AidData’s Listening to Leaders Survey (2014-2024).
Finding #2. Despite waning multilateralism, traditional multilaterals held steady or expanded their footprints, while many DAC bilaterals have lost ground since 2017
Most traditional multilaterals held steady or saw their footprints expand by 2 to 3 percentage points among leaders surveyed over the period (Figure 8). The largest increases were with leaders who reported receiving advice or support from UNICEF (+10.9 percentage points) and the IMF (+7.6 percentage points). This sharp uptick may coincide with growing demands to help countries navigate instability from conflict and emergencies (e.g., UNICEF’s expanding humanitarian assistance portfolio) or fiscal and monetary crises (e.g., the IMF’s role in resolving a wave of debt distress and defaults).
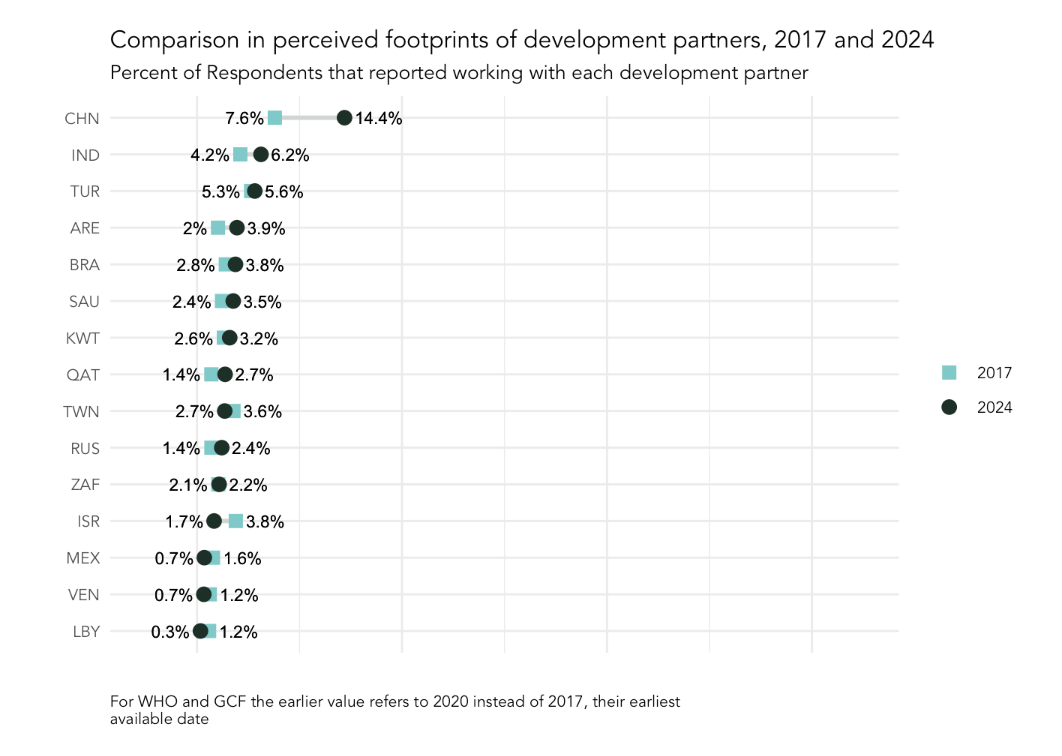
Figure 8. Change in footprint, traditional multilaterals, 2017 to 2024
Percentage of respondents who reported working with each traditional multilateral in 2017 and 2024
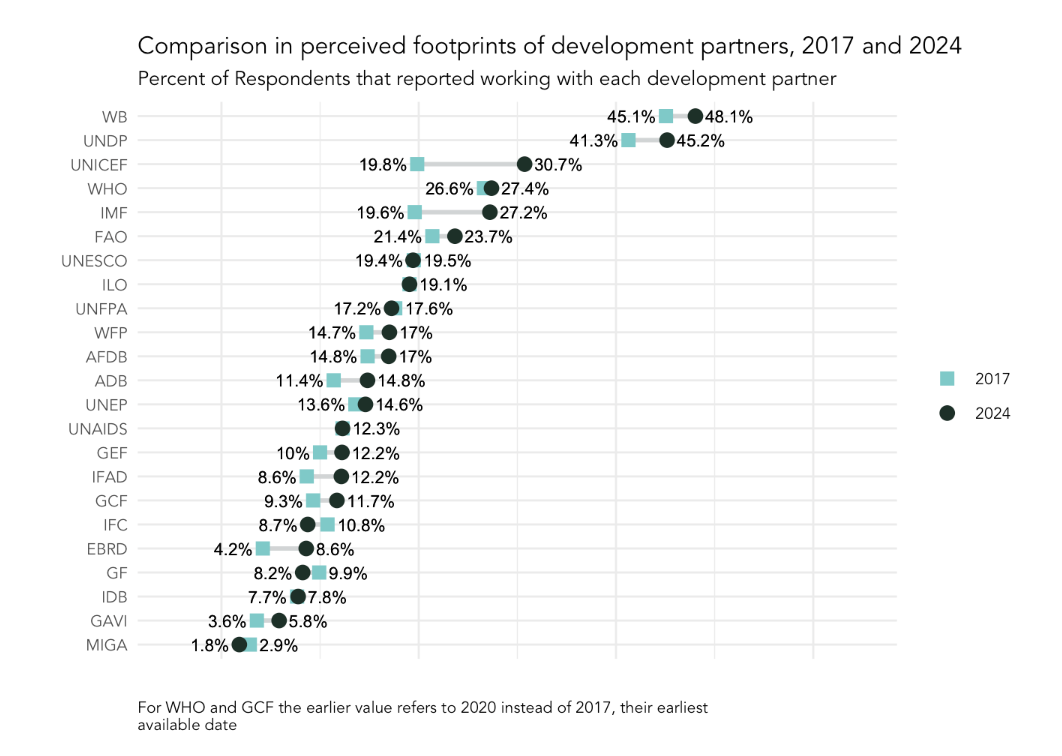
Notes: Traditional multilaterals are ordered from the largest to the smallest overall footprints, according to the percentage of respondents who reported working with them in AidData’s LtL surveys in 2017 and 2024. Only partners with at least 30 responses in both survey waves are listed. For WHO and GCF, the earlier value refers to 2020 instead of 2017, their earliest available date. Sources: AidData’s Listening to Leaders Survey (2017 - 2024).
The footprints of traditional bilaterals have generally held steady or contracted by 1 to 2 percentage points since 2017 (Figure 9). For development partners like the United Kingdom (UK) and Canada, whose footprints decreased by roughly two percentage points, these contractions may align with policy shifts such as aid cuts or consolidation of aid agencies into foreign ministries (Krutikova and Warwick, 2017; Worley, 2020; Carmen and Calleja, 2013; Troilo, 2015). The EU, Denmark, Switzerland, and Germany also saw their footprints decline by 2 to 5 percentage points.
Figure 9. Change in footprint, traditional bilaterals, 2017 to 2024
Percentage of respondents who reported working with each traditional bilateral in 2017 and 2024
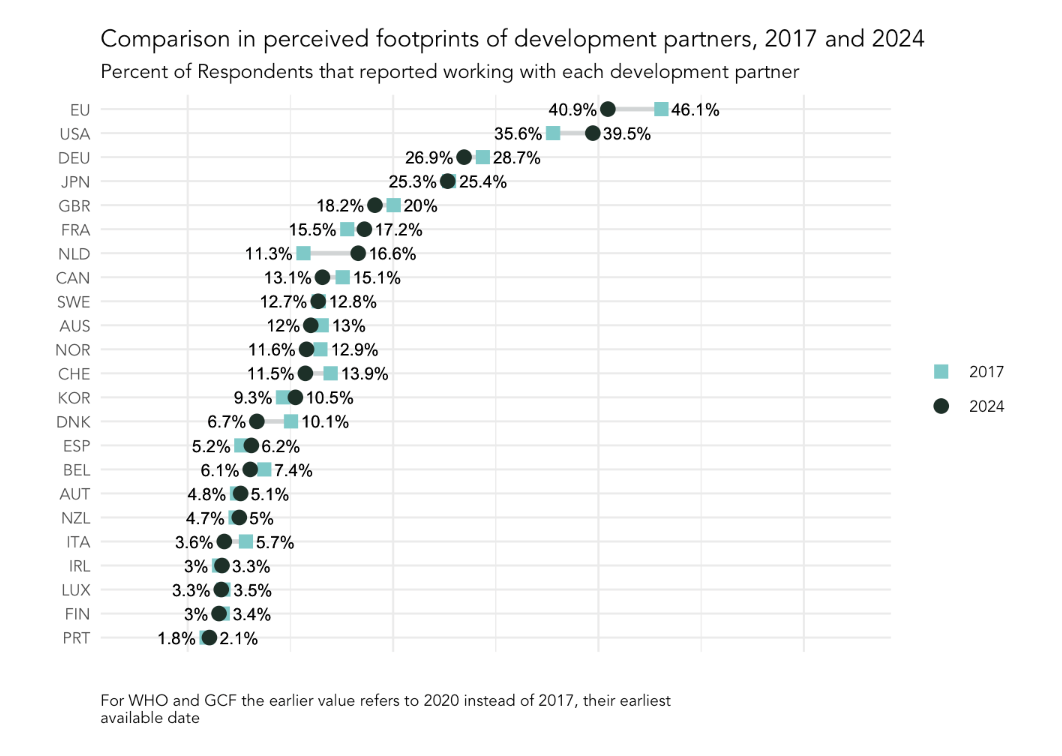
Notes: Traditional bilaterals are ordered from the largest to the smallest overall footprints, according to the percentage of respondents who reported working with them in AidData’s LtL surveys in 2017 and 2024. Only partners with at least 30 responses in both survey waves are listed. Sources: AidData’s Listening to Leaders Survey (2017 - 2024).
Exceptions to this trend of declining reach among traditional bilaterals were the Netherlands, the U.S., and France, whose footprints grew between 2017 and 2024 by 2 to 5 percentage points. In this period, the U.S. and France shared an interest in working with states experiencing crises, conflicts, or emergencies. Humanitarian assistance has accounted for a growing share of U.S. development assistance over the last decade (Custer, 2024), and overcoming root causes of insecurity in fragile states was a French priority to curb migration pressures (OECD, 2018 and 2023). It is unclear whether this focus may explain the uptick in their footprints.
However, these donors are more likely than not to see reduced footprints in future years. France and the Netherlands announced substantial cuts to their aid budgets for 2025 (Donor Tracker, 2024a and 2024b). The U.S. is engaged in a far-reaching overhaul of its development assistance architecture (Custer et al., 2025). These are just a few of the traditional bilaterals that have recently announced reductions in their development cooperation (Table 3).
Table 3. Historical ODA (2023) and announced aid budget cuts by selected traditional bilaterals
Select DAC countries | Total ODA in 2023 | Announced aid budget reductions in 2024 and 2025 |
|---|---|---|
Belgium | $2.81 billion | The government a nnounced a planned 25 % reduction in development cooperation. |
Finland | $1.59 billion | The government plans to reduce ODA by roughly 25% between 2024 and 2027. |
France | $15.1 billion | The 2025 draft budget cuts core ODA by €1.3 billion (a 23 % drop from 2024), following a smaller cut of about €1 billion, which was already implemented in 2024. |
Germany | $37.9 billion | The government reduced ODA by nearly €2 billion in 2024, compared to 2023 levels, and plans to slash a cumulative €4.8 billion from development and humanitarian spending by 2025. |
Netherlands | $7.4 billion | The government announced in late 2024 that it would cut ODA by over two-thirds over three years, reducing the budget by a total of €2.4 billion by 2027. |
Norway | $5.6 billion | The 2024 budget proposal reduced ODA by 5 %, or $460 million. |
Sweden | $5.6 billion | The government a nnounced a 5 % reduction in ODA, abandoning commitments to 1% of GNI. |
UK | $19.1 billion | The government a nnounced that it will drop ODA to 0.3% of GNI (from 0.5%), equating to roughly a 40 % reduction in the aid budget. |
U.S. | $63.7 b illion | In 2025, the government eliminated 90 % of USAID's foreign aid contracts, cancelled 83 % of assistance programs, and reduced USAID staff from 10,000 to 15 positions. |
Sources: OECD (2023b, 2024b), Donor Tracker (2024a-b, 2025), Meijer (2024), Gulrajani and Pudussery (2025), Belga (2025), MacKinnon (2024), Knickmeyer et al., (2025), Mitchell and Hughes (2025), Hird (2025), GoN. (2025), Craig (2025), Demirjian et al., (2025).
Finding #3. China remains the front-runner among non-traditional players, both bilateral and multilateral, and works with more leaders and countries, but this growth may be slowing
Non-traditional bilaterals generally grew their footprints over the period, albeit at modest levels (Figure 10). China was in a league of its own: Beijing increased its footprint by 6.8 percentage points between 2017 and 2024, equivalent to an 89 percent change. Most of this expansion occurred between 2017 and 2020, as Beijing enthusiastically promoted President Xi Jinping’s Belt and Road Initiative (BRI) (Horigoshi et al., 2022).
By 2024, China’s absolute footprint was roughly similar to Canada and the Asian Development Bank (ADB). Nevertheless, relative to earlier years, China’s growth spurt tapered off between 2020 and 2024. This slowdown could reflect a lower risk tolerance in Beijing for supplying additional debt financing and a higher reticence among countries to sign on to projects, amid a wave of defaults in China’s borrowers (Parks et al., 2023). [20]
Figure 10. Change in footprint, non-traditional bilaterals, 2017 to 2024
Percentage of respondents who reported working with each nontraditional bilateral in 2017 and 2024
Notes: Nontraditional bilaterals are ordered from the largest to the smallest overall footprints, according to the percentage of respondents who reported working with them in AidData’s LtL surveys in 2017 and 2024. Only partners with at least 30 responses in both survey waves are listed. Sources: AidData’s Listening to Leaders Survey (2017 - 2024).
India, a fellow BRICS member and a close competitor of China, also enlarged its footprint by 2 percentage points, roughly a 50 percent change, since 2017. New Delhi has made no secret of the fact that India sees its development cooperation efforts through a strategic lens of opening up market access for Indian firms to compete with Chinese state-owned enterprises, curbing Beijing’s influence in South Asia, and securing access to energy resources and other critical supply chains (Mathur, 2021; Singh, 2022). Finally, non-traditional multilaterals grew their footprints over the period, though the differences were largely within 1 percentage point or less.
3. Performance: How do leaders rate development partners?
Leaders are not monolithic in their preferences. Development partners may have differing areas of comparative advantage and disadvantage in an increasingly crowded marketplace. Once reliable standard bearers for aid programs, G7 economies are increasingly reluctant to expend political capital and taxpayer funds to support social-economic progress in other countries. [21] UN and international finance institutions, long-standing venues for multilateral cooperation, seek to overcome a perceived “legitimacy deficit,” reduced core support, and calls for reforms (Custer et al., 2025; Gulrajani and Lundsgaarde, 2023; Graham, 2024). [22] Once “recipients” of aid, non-traditional bilaterals also supply assistance to other countries (Aly et al., 2024).
This raises a critical question: in an age of expanded choice, how do Global South leaders evaluate the development partners from whom they receive advice or assistance? The Listening to Leaders Survey considers two perception-based measures of partner performance: (i) influence in shaping how leaders prioritize which problems to solve (i.e., agenda-setting); and (ii) helpfulness in supporting leaders to implement policy changes (i.e., reform implementation). Respondents could rate each development partner they had worked with during a five-year period on a scale of 1 (not at all influential/not at all helpful) to 4 (very influential/very helpful).
In the remainder of this chapter, we first provide a snapshot of partner performance as of 2024 (section 3.1) and then compare how this has changed over the last decade (section 3.2). We highlight three takeaways about the performance of development partners over the decade:
- Non-traditional players have not yet displaced traditional multilaterals and OECD DAC bilaterals, who still dominated the leaderboard on influence and helpfulness in 2024
- BRICS and Middle Eastern development partners were among the most improved, charting big performance gains over the decade, but still lagging traditional players
3.1 The perceived performance of development partners in 2024
Global South leaders generally viewed their development partners favorably. In 2024, the average development partner was rated as influential by roughly three-quarters (72.4 percent) of the leaders they worked with and helpful by four-fifths (81.8 percent) of this group. However, averages can obscure attitudes towards specific partners. There was a 37 percentage point difference between the most and least influential development partners, the Global Fund (92.1 percent) and Brazil (55.1 percent), in 2024. That year, there was a gap of 29 percentage points between the most and least helpful partners, Portugal (96 percent) and Qatar (67 percent).
3.1.1 Global heavyweights: Top performers across geographies and sectors
Eighty-four percent or more of leaders who worked with the top 10 influencers in 2024 said these partners were quite or very influential in shaping their domestic priorities (Figure 11). International finance institutions (e.g., IMF, WB, EBRD) and health-focused agencies (such as the Global Fund, GAVI, and WHO) were among the top influencers. The U.S. and the EU, historically large bilateral assistance suppliers, were considered to be highly influential. Nevertheless, New Zealand and Portugal stand out as top influencers despite smaller footprints and budgets relative to their peers.
In 2024, many top helpers were also highly influential, with some exceptions (Figure 12). More than 88 percent of leaders who worked with the top 10 helpers rated them quite or very helpful. UN agencies (e.g., UNICEF, WHO, and UNDP) and vertical funds (e.g., Global Fund and GAVI) performed well, as did the World Bank. Bigger bilateral players like the U.S. and the EU scored high marks on helpfulness, but so too did smaller peers like New Zealand and Portugal. Above-average performers on influence [23] and helpfulness [24] shared several commonalities. They were more likely to be traditional multilaterals or DAC bilaterals, long-standing suppliers of development finance at scale, and previously rated as above-average performers in prior survey waves.
Figure 11. Top 10 most influential development partners overall, 2024
% respondents who rated a development partner they worked with as quite or very influential
Table scrolls horizontally
| Rank | Development Partner | Respondents per Partner | Percentage of All Survey Respondents | Number of Countries with at least One Respondent |
|---|---|---|---|---|
| 1 | GF | 166 | 92.1 | 76 |
| 2 | IMF | 502 | 89.4 | 120 |
| 3 | WB | 887 | 88.4 | 130 |
| 4 | NZL | 107 | 87.3 | 23 |
| 5 | USA | 768 | 86.5 | 122 |
| 6 | GAVI | 99 | 86.1 | 52 |
| 7 | EU | 761 | 85.7 | 125 |
| 8 | WHO | 489 | 85.5 | 122 |
| 9 | EBRD | 117 | 84.2 | 34 |
| 10 | PRT | 45 | 83.7 | 17 |
Notes: This figure shows the 10 development partners rated as quite or very influential by the highest percentage of respondents in 2024 who reported receiving advice or assistance from them. Percentages take into account non-response weights. Sources: AidData’s 2024 Listening to Leaders Survey.
Figure 12. Top 10 most helpful development partners overall, 2024
% respondents who rated a development partner they worked with as quite or very helpful
Table scrolls horizontally
| Rank | Development Partner | Respondents per Partner | Percentage of All Survey Respondents | Number of Countries with at least One Respondent |
|---|---|---|---|---|
| 1 | PRT | 49 | 96.0 | 18 |
| 2 | GF | 164 | 94.0 | 78 |
| 3 | GAVI | 102 | 92.9 | 51 |
| 4 | NZL | 109 | 91.3 | 24 |
| 5 | UNICEF | 576 | 90.6 | 125 |
| 6 | WHO | 507 | 89.5 | 123 |
| 7 | EU | 758 | 89.3 | 129 |
| 8 | USA | 748 | 89.1 | 124 |
| 9 | WB | 853 | 88.8 | 127 |
| 10 | UNDP | 848 | 88.6 | 129 |
Notes: This figure shows the 10 development partners rated as quite or very helpful by the highest percentage of respondents in 2024 who reported receiving advice or assistance from them. Percentages take into account non-response weights. Sources: AidData’s 2024 Listening to Leaders Survey.
Finding #4. Non-traditional players have not yet displaced traditional multilaterals and OECD DAC bilaterals, who still dominated the leaderboard on influence and helpfulness in 2024
Overall, the 23 traditional multilaterals outperformed other groups. On average, approximately 79 percent of leaders who worked with a traditional multilateral rated that actor as influential, and 86 percent considered it helpful. That said, not all multilaterals are seen in the same vein. There was a 22.3 percentage point difference between the most influential (Global Fund, 92.1 percent) and the least influential (International Fund for Agricultural Development, 69.8 percent). There was a similar margin of difference (19.1 percentage points) between the most and least helpful traditional multilateral—the Global Fund (94.0 percent) and the Multilateral Investment Guarantee Agency (79.4 percent).
The 23 traditional bilaterals were also well regarded. Seventy-two percent of leaders who worked with these actors thought they were influential, on average. Eighty-three percent found them to be helpful. Nonetheless, leaders see differences between traditional bilaterals, even if they theoretically espouse similar aid effectiveness practices through their membership in the OECD’s Development Assistance Committee. There was a sizable gap between traditional bilaterals at the top and bottom of the leaderboard on influence (26.7 percentage points) [25] and helpfulness (24.7 percentage points). [26]
The geopolitical clout of a foreign government, going beyond aid to encompass other tools of economic statecraft and security cooperation, could amplify the influence of more politically powerful players like the U.S., the EU, and Germany, among the most influential of the traditional bilaterals. Middle powers like Spain and the Netherlands had greater variability in the degree to which they were seen to influence policy priorities and help implement reforms. Smaller development partners like New Zealand and Portugal outperformed larger players like Canada and Italy, for example.
Non-traditional bilaterals and multilaterals have not yet displaced the apparent dominance of traditional development partners. Less than 70 percent of leaders who worked with the average non-traditional bilateral or multilateral considered them influential (67 and 62 percent, respectively). The results were marginally better for helpfulness: roughly three-quarters of leaders rated these actors as helpful, on average. Non-traditional multilaterals were viewed more uniformly, with the narrowest gaps of any group between the top and bottom performers (12.2 percentage points for influence, 15.3 percentage points for helpfulness). [27]
A handful of emerging bilaterals were able to buck these trends. South Africa (13th), China (24th), India (29th), and Taiwan (33rd) placed among the 35 above-average influencers. Saudi Arabia (23rd) and Taiwan (36th) were the top emerging bilaterals on helpfulness. To achieve this feat, these emerging players leapfrogged traditional DAC bilaterals, including Nordic countries (e.g., Finland, Norway, and Denmark) and other European development partners (e.g., Switzerland, the Netherlands, and Italy). Comparatively, other non-traditional bilaterals such as Brazil (55 percent influential, 67.1 percent helpful) and Qatar (55.3 percent influential, 67 percent helpful) were less able to break through in a crowded marketplace.
3.1.2 Specialized star power: Niche areas of comparative advantage
Some development partners are truly global heavyweights: they consistently appear in the top 10 performers across multiple regions and sectors. This elite group included traditional multilateral organizations (the World Bank, IMF, UNICEF, UNDP, and WHO), along with large DAC bilaterals such as the U.S., the EU, and Germany. [28] Other development partners demonstrated specialized star power, receiving high marks in certain regions, sectors, or country types.
Geographic proximity, linguistic similarity, and concentration of finances could explain some variation in development partners’ comparative advantage. In East Asia and the Pacific, top performers included regional powers like New Zealand, Japan, Australia, China, and South Korea (Figures 13 and 14). [29] Sharing a common language and history via former colonial ties with the region’s Portuguese-speaking countries, Portugal was among the top 10 influencers and helpers in Sub-Saharan Africa. [30] India and Spain were top performers with leaders from their respective focus regions of South Asia and Latin America and the Caribbean. [31] Germany and the UK were well-regarded by leaders from Europe and Central Asia. [32]
Development partners can have unexpected areas of strength farther afield. South Korea and Ireland were among the most influential players in Latin America and the Caribbean and Sub-Saharan Africa, respectively. [33] Taiwan was the 9th most influential and 3rd most helpful development partner with leaders from Latin America and the Caribbean. These dynamics could be an outflow of Taipei’s “checkbook diplomacy” in competing with Beijing to stem the tide of countries adopting the “One China” policy (Fabbro and Gramer, 2023). In 2024, as in past surveys, Germany sustained its comparative advantage as the most influential and helpful development partner in the Middle East and North Africa. This strong showing may be enabled by Germany’s long-standing emphasis on “addressing the root causes of displacement in the region” (DonorTracker, 2021c; Custer et al., 2021).
Leaders may have different needs and aspirations depending upon the characteristics of the countries where they live and work (e.g., income status, regime type, fragility level, small-island states). Although there is more continuity than not among top-performing partners, smaller players can carve out niche areas of influence and helpfulness. Fragile states gave high marks to the UK, Japan, and France. [34] Small island states highly regarded Portugal, New Zealand, Australia, and Taiwan. [35] There did not appear to be a clear dividing line between the preferences of autocracies and democracies regarding their development partners.
Some development partners cultivated narrow but deep reservoirs of support with leaders in specific sectors. The UN system exemplifies this differentiation: agencies carved out niche areas of advantage, such as IFAD and FAO in rural development and UNESCO in infrastructure. [36] Smaller bilaterals made an impression on leaders in dedicated focus areas. Spain was the third most influential and the most helpful partner with leaders working on governance. Australia and Denmark (influence only), along with South Korea, Australia, and China (helpfulness only), were top performers in the governance sector. India edged into the top 10 influencers, and New Zealand into the top 10 helpers in the social sector. Nordic countries earned high marks with leaders in the environment sector, who considered them among the most helpful partners.
More surprising results were observed in the infrastructure and economic sectors. In past AidData surveys, leaders markedly preferred to work with China on infrastructure projects. Nevertheless, Beijing was noticeably absent from the top-10 list of influencers and helpers in infrastructure (Horigoshi et al., 2023; Custer et al., 2024). [37] Instead, traditional bilaterals such as Japan and the U.S. were top-performing players with these leaders. [38] In the economic sector, environmentally-focused agencies such as the Global Environmental Facility (GEF) and the UN Environmental Program (UNEP) were unexpectedly influential and helpful. [39]
Figure 13. Influence by region and sector, top 35 development partners, 2024
| Partner | Percentage of Responses | Overall Rank | EAP | ECA | LAC | MENA | SA | SSA | ECON | ENV | GOV | INFR | OTH | RUR | SOC |
|---|---|---|---|---|---|---|---|---|---|---|---|---|---|---|---|
| GF | 92.1% | 1 | NA | NA | NA | NA | NA | 4 | NA | NA | NA | NA | NA | NA | 1 |
| IMF | 89.4% | 2 | 6 | 2 | 1 | NA | 4 | 1 | 2 | 7 | 1 | 5 | 1 | 5 | 3 |
| WB | 88.4% | 3 | 7 | 1 | 2 | 5 | 3 | 3 | 3 | 3 | 2 | 3 | 4 | 6 | 5 |
| NZL | 87.3% | 4 | 1 | NA | NA | NA | NA | NA | NA | NA | NA | NA | NA | NA | 18 |
| USA | 86.5% | 5 | 5 | 5 | 3 | 2 | 6 | 7 | 9 | 5 | 4 | 1 | 2 | 3 | 8 |
| GAVI | 86.1% | 6 | NA | NA | NA | NA | NA | 8 | NA | NA | NA | NA | NA | NA | 7 |
| EU | 85.7% | 7 | 11 | 3 | 6 | 4 | 10 | 6 | 1 | 1 | 6 | 7 | 5 | 2 | 9 |
| WHO | 85.5% | 8 | 13 | 11 | 5 | NA | 2 | 5 | 13 | 2 | 9 | 4 | 7 | 4 | 4 |
| EBRD | 84.2% | 9 | NA | 4 | NA | NA | NA | NA | 12 | NA | NA | NA | NA | NA | NA |
| PRT | 83.7% | 10 | NA | NA | NA | NA | NA | 2 | NA | NA | NA | NA | NA | NA | NA |
| ADB | 81.4% | 11 | 8 | NA | NA | NA | 9 | 54 | 7 | 10 | 5 | NA | NA | NA | 11 |
| GEF | 81.2% | 12 | 2 | NA | 18 | NA | NA | 12 | 5 | 9 | NA | NA | NA | 1 | 6 |
| ZAF | 80.6% | 13 | NA | NA | NA | NA | NA | 25 | NA | NA | NA | NA | NA | NA | NA |
| UNDP | 79.8% | 14 | 15 | 10 | 13 | 3 | 11 | 10 | 10 | 4 | 20 | 2 | 9 | 12 | 14 |
| UNICEF | 79.7% | 15 | 12 | 15 | 14 | NA | 13 | 9 | 20 | 14 | 10 | NA | 17 | 10 | 10 |
| AFDB | 79.4% | 16 | NA | NA | NA | NA | NA | 20 | 4 | 6 | 12 | NA | NA | 9 | 25 |
| GBR | 78.5% | 17 | 20 | 6 | 28 | NA | 12 | 11 | 28 | 13 | 13 | NA | 3 | NA | 15 |
| DEU | 77.7% | 18 | 21 | 9 | 24 | 1 | NA | 22 | 11 | 8 | 14 | 9 | 11 | 7 | 31 |
| UNAIDS | 76.9% | 19 | 4 | NA | 4 | NA | NA | 13 | 21 | NA | 16 | NA | 14 | NA | 28 |
| IDB | 76.4% | 20 | NA | NA | 7 | NA | NA | NA | 29 | NA | 25 | NA | 6 | NA | 24 |
| SWE | 76.1% | 21 | NA | 14 | NA | NA | NA | 18 | 26 | 11 | 24 | NA | NA | NA | 12 |
| MIGA | 75.6% | 22 | NA | NA | NA | NA | NA | NA | NA | NA | NA | NA | NA | NA | NA |
| IRL | 74.8% | 23 | NA | NA | NA | NA | NA | 23 | NA | NA | NA | NA | NA | NA | NA |
| CHN | 74.6% | 24 | 10 | 12 | 19 | NA | NA | 28 | 24 | 16 | 21 | NA | 8 | NA | 30 |
| WFP | 74.6% | 25 | 22 | NA | 27 | NA | 15 | 15 | 14 | 18 | 19 | NA | 12 | 11 | 32 |
| FRA | 74.3% | 26 | 19 | 21 | 29 | NA | NA | 17 | 8 | 19 | 11 | NA | 16 | NA | 37 |
| IFC | 74.3% | 27 | 26 | 7 | NA | NA | NA | 14 | 22 | NA | 17 | NA | NA | NA | NA |
| AUS | 74.1% | 28 | 9 | NA | NA | NA | 19 | 51 | 23 | 25 | 7 | NA | NA | NA | 13 |
| IND | 73.9% | 29 | NA | NA | NA | NA | 1 | 40 | 36 | NA | NA | NA | NA | NA | 2 |
| FAO | 73.8% | 30 | 25 | 18 | 15 | NA | 14 | 16 | 30 | 12 | 15 | NA | 20 | 13 | 22 |
| UNEP | 73.7% | 31 | 17 | 17 | 21 | NA | 7 | 31 | 6 | 15 | 32 | NA | 19 | 8 | 23 |
| UNESCO | 73.3% | 32 | 16 | 20 | 17 | NA | 18 | 21 | 17 | 21 | 30 | 8 | 15 | NA | 17 |
| TWN | 73% | 33 | NA | NA | 9 | NA | NA | NA | NA | NA | NA | NA | NA | NA | NA |
| UNFPA | 72.7% | 34 | 23 | 13 | 31 | NA | 8 | 26 | 15 | NA | 22 | NA | 25 | NA | 26 |
| JPN | 72.5% | 35 | 3 | 23 | 22 | NA | 5 | 34 | 19 | 23 | 28 | 6 | 10 | 15 | 21 |
| LUX | 72% | 36 | NA | NA | NA | NA | NA | 19 | NA | NA | NA | NA | NA | NA | NA |
| ISR | 71.6% | 37 | NA | NA | NA | NA | NA | NA | NA | NA | NA | NA | NA | NA | NA |
| GCF | 71.4% | 38 | 18 | NA | 12 | NA | 17 | 32 | 16 | 20 | 27 | NA | NA | 16 | 16 |
| ILO | 71.3% | 39 | 24 | 8 | 10 | NA | 16 | 37 | 25 | NA | 29 | NA | 13 | NA | 20 |
| SAU | 70.9% | 40 | NA | NA | NA | NA | NA | 30 | NA | NA | NA | NA | NA | NA | NA |
| ESP | 70.8% | 41 | NA | NA | 8 | NA | NA | 29 | 35 | NA | 3 | NA | 18 | NA | 29 |
| IFAD | 69.8% | 42 | 27 | NA | NA | NA | NA | 24 | 34 | 22 | 18 | NA | NA | 14 | 19 |
| RUS | 69.6% | 43 | NA | NA | NA | NA | NA | 52 | NA | NA | NA | NA | NA | NA | NA |
| ISDB | 68.1% | 44 | NA | NA | NA | NA | NA | 42 | 27 | NA | NA | NA | NA | NA | 41 |
| NOR | 67.3% | 45 | NA | 19 | NA | NA | NA | 36 | 32 | 17 | 26 | NA | 24 | NA | 34 |
| BMGF | 66.6% | 46 | NA | NA | NA | NA | NA | 41 | NA | NA | NA | NA | NA | NA | 27 |
| KOR | 66.6% | 47 | 14 | NA | 23 | NA | NA | 46 | 33 | NA | 23 | NA | NA | NA | 35 |
| ARE | 66% | 48 | NA | NA | NA | NA | NA | 27 | NA | NA | NA | NA | NA | NA | NA |
| DNK | 64.8% | 49 | NA | NA | NA | NA | NA | 44 | NA | NA | 8 | NA | NA | NA | 36 |
| CABEI | 64.4% | 50 | NA | NA | 16 | NA | NA | NA | NA | NA | NA | NA | NA | NA | NA |
| BEL | 64.2% | 51 | NA | NA | NA | NA | NA | 38 | NA | NA | NA | NA | NA | NA | 40 |
| FIN | 64.2% | 52 | NA | NA | NA | NA | NA | 47 | NA | NA | NA | NA | NA | NA | NA |
| BADEA | 64% | 53 | NA | NA | NA | NA | NA | 45 | NA | NA | NA | NA | NA | NA | NA |
| NLD | 63.9% | 54 | 29 | 22 | 30 | NA | NA | 35 | 18 | 26 | 31 | NA | 21 | 17 | 38 |
| CAN | 63.3% | 55 | 28 | NA | 25 | NA | NA | 39 | 37 | NA | 34 | NA | 22 | NA | 33 |
| CDB | 62.8% | 56 | NA | NA | 20 | NA | NA | NA | NA | NA | NA | NA | NA | NA | NA |
| CHE | 62.6% | 57 | NA | 24 | 32 | NA | NA | 33 | 31 | 24 | 33 | NA | 23 | NA | 39 |
| AUT | 62% | 58 | NA | 25 | NA | NA | NA | NA | NA | NA | NA | NA | NA | NA | 42 |
| FF | 61.7% | 59 | NA | NA | NA | NA | NA | 49 | NA | NA | NA | NA | NA | NA | NA |
| ITA | 60.6% | 60 | NA | NA | NA | NA | NA | NA | NA | NA | NA | NA | NA | NA | NA |
| CAF | 59% | 61 | NA | NA | 26 | NA | NA | NA | NA | NA | NA | NA | NA | NA | NA |
| TUR | 58.3% | 62 | NA | 16 | NA | NA | NA | 48 | NA | NA | NA | NA | NA | NA | NA |
| KWT | 56.9% | 63 | NA | NA | NA | NA | NA | 50 | NA | NA | NA | NA | NA | NA | NA |
| OFID | 55.9% | 64 | NA | NA | NA | NA | NA | 43 | NA | NA | NA | NA | NA | NA | NA |
| QAT | 55.3% | 65 | NA | NA | NA | NA | NA | NA | NA | NA | NA | NA | NA | NA | NA |
| BRA | 55.1% | 66 | NA | NA | 11 | NA | NA | 53 | NA | NA | NA | NA | NA | NA | NA |
Notes: Rankings are based on the percentage of responses evaluating a given partner as “quite” or “very influential” in 2024. Partners must have received 30 or more responses overall and 25 or more responses in a sub-cohort (i.e., rank in a given region or sector) to be displayed. Shading represents the quintile within the respective cohort. For readability, we only include the top 35 ranked development partners on this measure. For the full list of development partner rankings, see the technical appendix. Sources: AidData’s 2014, 2017, 2020, and 2024 Listening to Leaders Surveys.
Figure 14. Helpfulness by region and sector, top 35 development partners, 2024
| Partner | Percentage of Responses | Overall Rank | EAP | ECA | LAC | MENA | SA | SSA | ECON | ENV | GOV | INFR | OTH | RUR | SOC |
|---|---|---|---|---|---|---|---|---|---|---|---|---|---|---|---|
| PRT | 96% | 1 | NA | NA | NA | NA | NA | 1 | NA | NA | NA | NA | NA | NA | NA |
| GF | 94% | 2 | NA | NA | NA | NA | NA | 7 | NA | NA | NA | NA | NA | NA | 2 |
| GAVI | 92.9% | 3 | NA | NA | NA | NA | NA | 2 | NA | NA | NA | NA | NA | NA | 1 |
| NZL | 91.3% | 4 | 2 | NA | NA | NA | NA | NA | NA | NA | NA | NA | NA | NA | 6 |
| UNICEF | 90.6% | 5 | 20 | 2 | 10 | NA | 9 | 3 | 10 | 3 | 4 | NA | 8 | 3 | 10 |
| WHO | 89.5% | 6 | 10 | 7 | 6 | NA | 1 | 4 | 7 | 17 | 21 | 8 | 17 | 1 | 5 |
| EU | 89.3% | 7 | 7 | 4 | 1 | 2 | 7 | 19 | 2 | 7 | 5 | 7 | 5 | 4 | 23 |
| USA | 89.1% | 8 | 15 | 5 | 8 | 3 | 14 | 8 | 15 | 16 | 8 | 4 | 12 | 5 | 7 |
| WB | 88.8% | 9 | 13 | 8 | 16 | 4 | 2 | 6 | 8 | 10 | 7 | 2 | 11 | 9 | 13 |
| UNDP | 88.6% | 10 | 5 | 11 | 12 | 5 | 15 | 5 | 11 | 15 | 16 | 1 | 2 | 7 | 11 |
| AFDB | 88.4% | 11 | NA | NA | NA | NA | NA | 22 | 5 | 2 | 14 | NA | NA | 11 | 15 |
| GEF | 87.9% | 12 | 3 | NA | 13 | NA | NA | 18 | 1 | 11 | NA | NA | NA | 2 | 3 |
| IMF | 87.8% | 13 | 21 | 3 | 7 | NA | 12 | 15 | 12 | 5 | 9 | 6 | 10 | 16 | 16 |
| DEU | 87.8% | 14 | 9 | 10 | 27 | 1 | NA | 12 | 6 | 13 | 11 | 9 | 3 | 15 | 20 |
| FF | 86.9% | 15 | NA | NA | NA | NA | NA | 17 | NA | NA | NA | NA | NA | NA | NA |
| ADB | 86.8% | 16 | 11 | NA | NA | NA | 4 | 54 | 3 | 4 | 20 | NA | NA | NA | 19 |
| UNFPA | 86.6% | 17 | 17 | 12 | 22 | NA | 18 | 14 | 14 | NA | 18 | NA | 25 | NA | 8 |
| WFP | 86.5% | 18 | 24 | NA | 17 | NA | 11 | 16 | 22 | 9 | 13 | NA | 22 | 10 | 9 |
| UNESCO | 86.2% | 19 | 25 | 1 | 9 | NA | 6 | 24 | 4 | 24 | 25 | 5 | 4 | NA | 14 |
| IFAD | 85.9% | 20 | 14 | NA | NA | NA | NA | 13 | 19 | 12 | 26 | NA | NA | 8 | 22 |
| FAO | 85.8% | 21 | 23 | 24 | 18 | NA | 8 | 9 | 21 | 8 | 22 | NA | 18 | 6 | 27 |
| IRL | 85.6% | 22 | NA | NA | NA | NA | NA | 10 | NA | NA | NA | NA | NA | NA | NA |
| SAU | 85.5% | 23 | NA | NA | NA | NA | NA | 21 | NA | NA | NA | NA | NA | NA | NA |
| IFC | 84.9% | 24 | 27 | 9 | NA | NA | NA | 26 | 16 | NA | 10 | NA | NA | NA | NA |
| GBR | 84.4% | 25 | 26 | 6 | 30 | NA | 16 | 11 | 23 | 22 | 24 | NA | 6 | NA | 12 |
| SWE | 84% | 26 | NA | 13 | NA | NA | NA | 33 | 29 | 6 | 23 | NA | NA | NA | 25 |
| LUX | 84% | 27 | NA | NA | NA | NA | NA | 27 | NA | NA | NA | NA | NA | NA | NA |
| KOR | 83.9% | 28 | 1 | NA | 5 | NA | NA | 42 | 31 | NA | 2 | NA | NA | NA | 17 |
| ISDB | 83.8% | 29 | NA | NA | NA | NA | NA | 39 | 30 | NA | NA | NA | NA | NA | 4 |
| AUS | 83.7% | 30 | 6 | NA | NA | NA | 19 | 38 | 26 | 20 | 3 | NA | NA | NA | 24 |
| IDB | 83.6% | 31 | NA | NA | 11 | NA | NA | NA | 24 | NA | 32 | NA | 1 | NA | 35 |
| UNAIDS | 83.4% | 32 | 8 | NA | 4 | NA | NA | 29 | 18 | NA | 12 | NA | 16 | NA | 31 |
| JPN | 83.3% | 33 | 4 | 19 | 29 | NA | 3 | 32 | 20 | 23 | 28 | 3 | 23 | 12 | 18 |
| UNEP | 82.7% | 34 | 16 | 21 | 24 | NA | 13 | 20 | 9 | 19 | 30 | NA | 19 | 13 | 30 |
| BMGF | 82.4% | 35 | NA | NA | NA | NA | NA | 31 | NA | NA | NA | NA | NA | NA | 28 |
| TWN | 82.3% | 36 | NA | NA | 3 | NA | NA | NA | NA | NA | NA | NA | NA | NA | NA |
| CAN | 81.9% | 37 | 22 | NA | 20 | NA | NA | 28 | 33 | NA | 29 | NA | 13 | NA | 26 |
| ILO | 81.9% | 38 | 19 | 15 | 21 | NA | 10 | 41 | 28 | NA | 34 | NA | 9 | NA | 21 |
| FRA | 81.8% | 39 | 18 | 14 | 15 | NA | NA | 30 | 17 | 25 | 17 | NA | 7 | NA | 39 |
| EBRD | 81.6% | 40 | NA | 18 | NA | NA | NA | NA | 27 | NA | NA | NA | NA | NA | NA |
| NOR | 81% | 41 | NA | 16 | NA | NA | NA | 23 | 34 | 1 | 19 | NA | 20 | NA | 37 |
| CHN | 80.8% | 42 | 12 | 22 | 28 | NA | NA | 37 | 32 | 21 | 6 | NA | 21 | NA | 29 |
| ESP | 79.9% | 43 | NA | NA | 2 | NA | NA | 40 | 37 | NA | 1 | NA | 14 | NA | 34 |
| BEL | 79.2% | 44 | NA | NA | NA | NA | NA | 25 | NA | NA | NA | NA | NA | NA | 32 |
| CHE | 78.8% | 45 | NA | 23 | 25 | NA | NA | 47 | 35 | 18 | 15 | NA | 15 | NA | 38 |
| CDB | 78.7% | 46 | NA | NA | 23 | NA | NA | NA | NA | NA | NA | NA | NA | NA | NA |
| ZAF | 77.9% | 47 | NA | NA | NA | NA | NA | 46 | NA | NA | NA | NA | NA | NA | NA |
| NLD | 77.9% | 48 | 29 | 20 | 14 | NA | NA | 35 | 13 | 14 | 33 | NA | 24 | 14 | 40 |
| FIN | 77.6% | 49 | NA | NA | NA | NA | NA | 36 | NA | NA | NA | NA | NA | NA | NA |
| DNK | 77.1% | 50 | NA | NA | NA | NA | NA | 49 | NA | NA | 27 | NA | NA | NA | 41 |
| OFID | 76.9% | 51 | NA | NA | NA | NA | NA | 34 | NA | NA | NA | NA | NA | NA | NA |
| GCF | 76.7% | 52 | 28 | NA | 19 | NA | 17 | 44 | 25 | 26 | 31 | NA | NA | 17 | 36 |
| BADEA | 76.6% | 53 | NA | NA | NA | NA | NA | 48 | NA | NA | NA | NA | NA | NA | NA |
| IND | 75.8% | 54 | NA | NA | NA | NA | 5 | 50 | 36 | NA | NA | NA | NA | NA | 33 |
| ITA | 75.1% | 55 | NA | NA | NA | NA | NA | NA | NA | NA | NA | NA | NA | NA | NA |
| MIGA | 74.9% | 56 | NA | NA | NA | NA | NA | NA | NA | NA | NA | NA | NA | NA | NA |
| ISR | 73.5% | 57 | NA | NA | NA | NA | NA | NA | NA | NA | NA | NA | NA | NA | NA |
| AUT | 71.3% | 58 | NA | 25 | NA | NA | NA | NA | NA | NA | NA | NA | NA | NA | 42 |
| ARE | 69.6% | 59 | NA | NA | NA | NA | NA | 45 | NA | NA | NA | NA | NA | NA | NA |
| TUR | 69% | 60 | NA | 17 | NA | NA | NA | 53 | NA | NA | NA | NA | NA | NA | NA |
| KWT | 68.8% | 61 | NA | NA | NA | NA | NA | 43 | NA | NA | NA | NA | NA | NA | NA |
| CAF | 68.5% | 62 | NA | NA | 31 | NA | NA | NA | NA | NA | NA | NA | NA | NA | NA |
| RUS | 67.8% | 63 | NA | NA | NA | NA | NA | 51 | NA | NA | NA | NA | NA | NA | NA |
| BRA | 67.1% | 64 | NA | NA | 26 | NA | NA | 52 | NA | NA | NA | NA | NA | NA | NA |
| QAT | 67% | 65 | NA | NA | NA | NA | NA | NA | NA | NA | NA | NA | NA | NA | NA |
| CABEI | 64.2% | 66 | NA | NA | 32 | NA | NA | NA | NA | NA | NA | NA | NA | NA | NA |
Notes: Rankings are based on the percentage of responses evaluating a given partner as “quite” or “very helpful” in 2024. Partners must have received 30 or more responses overall and 25 or more responses in a sub-cohort (i.e., rank in a given region or sector) to be displayed. Shading represents the quintile within the respective cohort. For readability, we only include the top 35 ranked development partners on this measure in the figure. For the full list of development partner rankings, see the technical appendix. Sources: AidData’s 2014, 2017, 2020, and 2024 Listening to Leaders Surveys.
3.2 Changes over time in the ratings of development partner performance
The marketplace of development is dynamic, not static. Individual agencies change strategic priorities, adopt new policies, and refashion organizational structures that alter how they engage with Global South counterparts. Meanwhile, leaders in low- and middle-income countries (as described in Chapter 3) have evolving needs and more choices in the partners they work with than in prior decades. Leveraging past survey waves, we can examine how the performance of individual development partners has changed in absolute terms over time and relative to other players across four surveys conducted in 2014, 2017, 2020, and 2024.
As a group, development partners became more influential in the eyes of Global South leaders surveyed over the period, with most organizations holding steady or improving their scores. Nevertheless, these gains were not universally shared. A growing number of development partners saw their influence decline between survey waves. If we use 2014 as the base year, all development partners improved their influence scores by 2024. However, there were four organizations whose perceived influence decreased since 2017 and seven since 2020. [40]
Finding #5. BRICS and Middle Eastern development partners were among the most improved, charting big performance gains over the decade, but still lagging traditional players
Since 2014, the ten most improved influencers were almost all non-traditional bilaterals or multilaterals. [41] BRICS players like South Africa, India, Russia, and China were ahead of the curve in expanding their influence by a whopping 44 to 56 percentage points. Middle Eastern donors such as the United Arab Emirates (+49 percentage points) and Saudi Arabia (+45 percentage points) made their mark, charting big gains over the decade. The lone traditional player among the most improved influencers was the Global Fund: 92.1 percent of leaders rated it influential in 2024, up from 57.3 percent who said the same in 2014 (+34.8 percentage points). [42]
However, the biggest improvers are not necessarily the most influential development partners. Non-traditional development partners started the period at a disadvantage, lagging traditional incumbents in the percentage of leaders who rated them as influential. The highest-performing non-traditional bilateral in 2014 (Brazil) was viewed as influential by roughly one-third of leaders (34.5 percent) who worked with it. South Africa and India charted the largest improvements in non-traditional bilaterals since 2020, with 81 and 74 percent of leaders, respectively, viewing them as influential in 2024. These gains can be fleeting and difficult to sustain, as underscored by Brazil falling to the bottom of the leaderboard in 2024 and China falling out of the top 10 most influential partners in 2024.
Alongside these examples of changing attitudes, there were also points of continuity in how leaders rated their development partners. Traditional bilaterals and multilaterals have proven hard to displace among the top influencers. In three of four survey waves, all of the top ten influencers were traditional bilaterals or multilaterals. [43] The single exception to this status quo was China's historic breakthrough into the top influencers in 2020. Most traditional bilaterals and multilaterals began the period with relatively high influence scores and generally sustained or improved on their performance over time. Nevertheless, as many traditional bilaterals pull back on their assistance programs, this could substantially alter the playing field for non-traditional players to position themselves as more influential and helpful (see Box 1).
Perceptions of helpfulness followed similar trends as influence but with some divergence. Most development partners held steady or made gains on perceived helpfulness between 2014 and 2024. [44] Nevertheless, there were winners and losers. Five development partners had lower helpfulness scores in 2024 than in 2017, and 10 saw their standing diminish between 2020 and 2024. [45] The top ten most improved helpers represented a more mixed group than we saw with influence. As with influence, non-traditional players made strides between 2014 and 2024, such as bilaterals like Kuwait, China, and India, along with the multilateral Islamic Development Bank (ISDB). However, several traditional bilaterals like Portugal, South Korea, Canada, Japan, and Germany made up ground on this measure over the decade, as did the Global Fund, a multilateral. [46]
As with influence, traditional bilaterals and multilaterals have routinely dominated the top helpers. Nevertheless, there has been more movement in the individual development partners with the top ten helpfulness scores across survey waves. [47] Some household names, like the EU, the World Bank, and UNICEF, have proven durable, sustaining their position in the top 10 helpers in all four surveys. Beyond this, there has been greater volatility. Earlier in the period, smaller traditional bilaterals like Denmark, Sweden, and Austria attracted high marks for helpfulness among small but vocal constituents. More recently, Portugal and New Zealand were top helpers in 2024. Non-traditional players like BADEA and philanthropies like the Gates Foundation punched above their weight in helpfulness in 2017.
4. Attraction: What do leaders look for in their partners?
A fundamental truth can get lost in donor-centric discussions of development finance: low- and middle-income countries have agency. The decisions of bilateral aid agencies and multilateral organizations regarding how much they are willing to invest, where, and in what programs certainly affect the choices available. However, Global South leaders ultimately determine with whom they want to partner to catalyze socio-economic progress for their countries. This chapter considers possible factors that may shape leader perceptions of development partner performance.
In addressing this question, we can utilize the Listening to Leaders Survey in two ways. First, we use retrospective responses over the past decade to assess the odds that different types of leaders would rate a development partner more or less favorably. Second, we analyze leader responses to questions about why they thought a partner was influential and helpful, as well as the attributes they valued most. [48] In analyzing the responses, we report the percentage of respondents who selected a given reason or attribute in 2024 and compare these answers to prior surveys conducted in 2020 and 2017.
In the remainder of this chapter, we assess the odds that leaders of different types rate development partners more or less favorably (section 4.1), examine the ingredients leaders consider important in explaining the performance of development partners (section 4.2) and assess the attributes leaders say they value most in a partner (section 4.3). We highlight three takeaways about the factors that shape Global South leaders’ perspectives of their partners:
- Money matters, but leaders in some country contexts—lower-income, democratic, and moderately vulnerable countries—are more predisposed than others to view partners favorably
- Resources, respect, and relationships were top-of-mind for Global South leaders explaining what made development partners top performers
- Global South leaders place a premium on development partners willing to adapt their strategies to local needs and plan for long-term sustainability
4.1 Performance perceptions across leaders of different types
Donors with deep pockets could theoretically ‘buy’ influence or favorability in the eyes of their counterparts in low- and middle-income countries simply by bringing more money to the table. Past research, including several AidData surveys, has found some evidence to support this idea: development partners that disbursed a higher volume of official development assistance dollars tend to be seen by in-country counterparts as more influential and helpful, on average (Custer et al., 2015 and 2018; Faust et al., 2016). Other studies using different methods also support the argument that foreign aid dollars have the potential to shape elite political preferences, such as buying votes in international fora like the United Nations (Strüver, 2016), as well as influencing national policy processes (Khan et al., 2018).
The breadth of our sample creates opportunities to systematically assess how attitudes may vary depending on a leader’s job or expertise, the country in which they live, and the choices specific donors make regarding their assistance. In this section, we take a closer look at how individual, country, and donor characteristics may contribute to how leaders perceive the performance of their development partners.
Finding #6. Money matters, but leaders in some country contexts—lower-income, democratic, and moderately vulnerable countries—are more predisposed than others to view partners favorably
Using a decade’s worth of data from our LtL surveys, we constructed a series of statistical tests to assess whether and how official development assistance (hereafter aid) dollars may be correlated with perceptions of development partner performance. We find that the amount of aid a donor provides is positively and significantly associated with the probability that it is viewed as influential in shaping development priorities. [49] Each additional $1 million in yearly total outlays for a donor country increases the probability of a leader finding that development partner influential by between 0.02 percent and 0.03 percent. [50]
Nevertheless, leader perceptions are not straightforward and unlikely to be a function of the volume of assistance provided alone. A notable limitation of our analysis is that the same amount of dollars spent may have a substantially different impact in one country versus another, depending on the size of the recipient. Moreover, we find that smaller donors with modest financial means can position themselves for outsized influence and helpfulness beyond what we would expect to see if perceived performance was strictly a function of money alone (Custer et al., 2015, 2018, and 2021). The opposite is true for some larger donors with ample financial means that routinely punch below their weight in perceived influence and helpfulness (Custer et al., 2018 and 2021; Faust et al., 2016). The fragmentation of aid has been less conclusive about how this may affect leader perceptions. At times, donors have appeared to have greater influence in countries where aid is less fragmented (Parks et al., 2016). However, in other studies, there has been no discernible effect (Custer et al., 2021).
One clue to decoding the contradiction is to look beyond volume to how development partners channel their assistance. Donors who are seen as aligning their assistance with local priorities, supporting activities across sectors, and disbursing less untied aid and technical assistance as a share of their portfolio have tended to be perceived as more influential and helpful (Custer et al., 2015, 2018). In some cases, donors with higher shares of country programmable aid (CPA) as a percentage of their overall aid were seen as more influential (Custer et al., 2018; Faust et al., 2016; Parks et al., 2016). [51] In their mixed-method study, Kunert et al. (2021) found that influence and helpfulness were positively correlated with the degree to which donors channeled their aid on budget and with greater predictability, pooled funding, aligned with country priorities, and built strong interpersonal relationships with counterparts.
Job responsibilities and expertise might inform performance perceptions, so we assessed the odds that different types of leaders rated development partners as influential and helpful. Government officials were 15 percent more likely to consider a donor as influential and 32 percent more likely to rate them as helpful compared to local representatives of development partners. [52] Parliamentarians had 34 percent higher odds of viewing a donor as helpful compared to the same baseline. [53] Respondents in the environment and social sectors were more likely to view a donor as influential, 25 and 27 percent, respectively, than their peers working on economic issues. [54] Leaders in the rural development sector had lower odds of rating a donor helpful (11 percent). Social sector experts were more positive, with 13 percent higher odds of rating them helpful than those in the economic sector.
Past analyses suggest that specific donors may have a discernible comparative advantage with leaders from certain sectors (e.g., Germany in the environment, Denmark in social policy) and stakeholder groups (e.g., Denmark and Germany with host government officials) relative to their peers (Parks et al., 2016; Faust et al., 2016). Familiarity can also breed affinity, as host government officials who previously worked full-time for at least one traditional development partner tended to view non-traditional partners less favorably (Custer et al., 2015). Gender has appeared to play less of a decisive role in explaining why leaders view some donors as more attractive than others (Custer et al., 2021; Sethi and Solis, 2020).
Countries are not monolithic, and leaders may differ in their perspectives on the performance of the partners with whom they work. We put this question to the test by assessing the odds of leaders rating development partners as influential and helpful in diverse conditions (e.g., geographic region, income level, fragility level, regime type, small island status). Two regions present a challenge for donors. Leaders from South Asia, and the Middle East and North Africa, had 34 and 30 percent lower odds, respectively, of rating their partners as influential compared to leaders in the East Asia and Pacific region. [55] This negative perception extended to helpfulness, with leaders from these regions having 15 and 32 percent lower odds, respectively, of viewing their partners as helpful, compared to the same baseline. Leaders from Latin America and the Caribbean also had a pessimistic view: respondents had 24 percent lower odds of finding a partner helpful. Conversely, leaders from Europe and Central Asia (13 percent) and Sub-Saharan Africa (8 percent) had higher odds of rating their partners as helpful. [56]
Poorer countries considered development partners to be more helpful than wealthier ones. Leaders from low-income settings had 66 percent higher odds of rating donors as helpful than those from high-income countries. This was also true for lower-middle income (46 percent higher odds) and upper-middle-income (27 percent higher odds) against the same baseline. [57] This finding is consistent with an earlier study which found that wealthier countries were more negatively predisposed to view a donor as helpful (Custer et al., 2015).
Fragility is a more complicated story. “Extremely fragile” countries had 22 percent lower odds of viewing their partners as helpful in supporting reform implementation compared to “not fragile” contexts. “Somewhat fragile” states were more appreciative of the helpfulness of their partners (15 percent) compared to the same baseline. Relatedly, small island states, which grapple with vulnerabilities such as rising sea levels and climate change, have 20 percent higher odds of viewing their partners as helpful, compared to other countries.
Past studies also underscore the challenge of delivering well in fragile contexts where leaders tend to be less optimistic about the prospects of reform progress (Custer et al., 2018). These leaders can view partners as less influential (Parks et al., 2016). This could be related to the difficulties progressive leaders in these contexts face in mobilizing an enabling environment for reform at the local level, which may be an important predictor of a donor’s perceived performance. Custer et al. (2015) found that development partners were seen as more influential in contexts with a breadth of domestic political support for reform and less influential in countries where the chief executive opposed reform. Faust et al. (2016) similarly found that the breadth of domestic support for reform was important in explaining Germany’s influence.
When we consider all four surveys, leaders in autocratic nations were more skeptical: they had 23 percent lower odds than those in democracies of rating their development partners as helpful. This finding is intriguing, because some studies using earlier waves of the survey in isolation did not find regime type to have a discernible effect on perceptions of donor performance (Custer et al., 2015 and 2018; Parks et al., 2016). That said, the specifics may matter. In some cases, specific development partners may have an advantage with certain regime types, such as the U.S. with democracies (Sethi and Solis, 2020) and Germany with autocracies (Faust et al., 2016).
4.2 What makes development partners influential and helpful?
Finding #7. Resources, respect, and relationships were top of mind for Global South leaders in explaining what made development partners top performers
Over forty percent of leaders surveyed in 2024 identified the provision of financial or material resources as the most important ingredient to explain the influence of a development partner. Although the intensity of that preference varied, from half of Middle Eastern and North African leaders to roughly a third of leaders surveyed from Europe and Central Asia, this reason was consistently ranked first among all the options. Leaders in 2017 and 2020 agreed with this assessment, identifying the provision of financial or material resources as the top reason for influence, at roughly similar levels. [58] This rationale extended to other performance dimensions: 32 percent of leaders in 2024 selected financial or material resources among the top reasons for a partner’s helpfulness. There was a high degree of durability to this finding across all geographic regions and previous surveys. [59]
Beyond money, expertise is often another element of a development partner’s resources that Global South leaders associate with influence. In 2024, 22 percent of leaders surveyed selected access to international experts among their top reasons for a partner’s influence in shaping their domestic priorities. [60] However, not all expertise may be equally valued. Leaders from South Asia and Latin America and the Caribbean emphasized that advice and assistance should be of “high quality.” [61] Meanwhile, whether a development partner was the appropriate institution to provide advice mattered strongly to respondents from Europe and Central Asia and Latin America and the Caribbean. [62] This is not the first time leaders have placed a high premium on international expertise, with roughly one-quarter of leaders surveyed in 2017 pointing to this as a reason for influence and helpfulness.
Respect for in-country counterparts was another theme that emerged in leader responseson what made a development partner influential. This appeared in two respects: respect for the host government’s authority and perceived alignment with the government’s national development strategy. In 2024, 22 percent of leaders surveyed globally identified respect for the government’s authority as the second most important reason for a development partner’s influence. It was consistently a top three cited reason for influence across all regions, except Europe and Central Asia. [63] That said, leaders in East Asia and Pacific placed slightly more weight on partners aligning their activities with the government’s development strategy. This was among the top reasons for influence cited by leaders in prior years (35 percent in 2020 and 28 percent in 2017).
The importance of relationships with in-country counterparts was a third theme evident in survey responses. Leaders surveyed in 2024 identified close collaboration with government counterparts (51 percent) and building support among locals (28 percent) as two of the top reasons that made a development partner helpful in implementing policy changes. Although the intensity of these preferences varied, [64] collaboration with the government always ranked first, and building support among locals was one of the top three reasons across geographic regions.
Leaders from East Asia and the Pacific had the most intensely held preferences: 60 percent of the region’s respondents selected collaboration with the government as a top reason for helpfulness, and 32 percent said the same for building support among locals. These reasons also scored well with leaders in prior surveys conducted in 2020 and 2017. [65] Since we observed previously that leaders from the Middle East and North Africa have lower odds of rating a partner as influential or helpful, it is worth spotlighting a noticeable difference in responses from leaders from this region on reasons for helpfulness. Respondents from the MENA region tended to place a much stronger premium on a development partner’s ability to provide valuable information for use in monitoring and evaluation (23 percent) and careful management of resources (20 percent). [66]
Figure 15. Why did respondents view development partners as being influential?
Percentage of respondents in 2024 who selected specific reasons that development partners were influential
Table scrolls horizontally
| Why Influential? | Global | EAP | ECA | LAC | MENA | SA | SSA |
|---|---|---|---|---|---|---|---|
| Financial/material resources | 41.2% | 40.4% | 34.6% | 41.1% | 52.3% | 39.6% | 44.3% |
| Respected gov authority | 22% | 25.1% | 12.9% | 22.5% | 27.2% | 27% | 24.2% |
| Access to int'l experts | 21.9% | 17.5% | 23.2% | 27% | 21.1% | 19.1% | 21.6% |
| Advice/assistance aligned with gov strategy | 19.5% | 25.7% | 16% | 17% | 15.3% | 14.5% | 20.9% |
| Worked closely with gov | 18.8% | 17.2% | 16.9% | 17% | 17.8% | 25.9% | 20.6% |
| High quality advice/assistance | 17.5% | 17.7% | 18.4% | 20.3% | 9.4% | 20.6% | 16.7% |
| Appropriate institution to provide advice | 17% | 15.3% | 19.4% | 21.1% | 18.5% | 15.1% | 14.5% |
| Seen as unbiased and thrustworthy | 15.1% | 11.5% | 12.1% | 15.3% | 24.8% | 19% | 16.5% |
| Worked closely with groups outside gov | 14.8% | 13.8% | 16.9% | 14.9% | 12.3% | 8.2% | 15.5% |
| Advice/assistance with opportunity to change | 11.1% | 16.6% | 9.5% | 10.8% | 6.4% | 10.5% | 10.4% |
| Involved in existing policy/programmatic discussions | 10% | 12.4% | 10% | 4.5% | 10.4% | 12.3% | 10.5% |
| Evidence that initiative was needed | 6% | 7.1% | 6% | 3.4% | 8.8% | 5.4% | 6.2% |
| Broad support from citizens | 4.6% | 7% | 4.8% | 3.6% | 1.6% | 3.7% | 4.3% |
| Support of champions | 4.1% | 4.7% | 3.1% | 3.7% | 8.5% | 8.1% | 3.2% |
| Evidence on the results of initiative | 3.7% | 3.6% | 3.6% | 4.4% | 0% | 7.8% | 3.4% |
Figure 16. Why did respondents view development partners as being helpful?
Percentage of respondents in 2024 who selected specific reasons that development partners were helpful
Table scrolls horizontally
| Why helpful | Global | EAP | ECA | LAC | MENA | SA | SSA |
|---|---|---|---|---|---|---|---|
| Close collaboration w gov counterparts | 51.1% | 60.3% | 43.8% | 48.2% | 49.2% | 55.6% | 52% |
| Suplied financial/material resources | 32% | 27.1% | 31.1% | 35.5% | 34.5% | 37% | 32.1% |
| Helped build support among locals | 27.7% | 32.4% | 21.2% | 26% | 22.8% | 24.1% | 30.9% |
| Provided access to highly qualified int'l experts | 17.1% | 15.1% | 20.1% | 19.6% | 18.5% | 12% | 15.7% |
| Translated broad policy guidance into specifics | 17% | 15.7% | 13.9% | 12.5% | 19.7% | 10.3% | 22.1% |
| Identified approaches to overcomoing barriers | 16.9% | 18.4% | 15.1% | 16.5% | 15.9% | 19.9% | 16.9% |
| Exercised careful management of resources | 14.9% | 12.4% | 11.5% | 16.8% | 20.1% | 17.1% | 16.3% |
| Provided implementers w discretion and flexibility | 14% | 17.7% | 12.9% | 11% | 10.7% | 13.3% | 14.8% |
| Provided valuable info for use in M&E | 13.2% | 13.7% | 16.3% | 13.1% | 22.7% | 12.9% | 9.7% |
| Aligned its implementation with those from other orgs | 9.2% | 11.5% | 8.3% | 7.7% | 6.4% | 5.5% | 10.4% |
| Minimized admin burden of implementation | 7.1% | 7.9% | 7% | 6.5% | 6.5% | 6.6% | 7.1% |
| Helped implementers make course corrections | 4.9% | 4.6% | 2.6% | 5.2% | 9.4% | 3.2% | 5.8% |
| don't know | 4.1% | 1.9% | 7.5% | 3.4% | 6.4% | 7.7% | 2.8% |
| other | 2.5% | 1.5% | 3.6% | 2.9% | 0.5% | 1.8% | 2.5% |
| none | 0.8% | 0.7% | 0.8% | 1.1% | 0% | 0% | 0.9% |
4.3 What attributes do leaders value most in a development partner?
Finding #8. Global South leaders place a premium on development partners willing to adapt their strategies to local needs and plan for long-term sustainability
Navigating a decade of disruption, leaders pointed to two attributes they value most in their development partners: adaptability and sustainability. Forty percent of leaders surveyed in both 2024 and 2020 identified a “willingness to adapt strategies to country needs” as the quality they valued most in a development partner. [67] In a follow-up question, we asked leaders who selected this attribute to reflect on what made a development partner adaptable. Their responses concentrated around three aspects of adaptability: adjusting approaches following consultation with domestic stakeholders (65 percent), making modifications for projects to be more relevant to the local social, cultural, and political context (50 percent), and aligning projects and programs with the country’s national development strategy (49 percent). [68]
Leaders across the two surveys also agreed on the second most valuable attribute for a preferred partner: “prioritizing long-term planning,” which was selected by 24 and 18 percent of respondents in 2024 and 2020, respectively. What does it mean in practice for a partner to prioritize long-term planning? Leaders’ responses emphasized three facets of sustainability: process, outcomes, and people. Survey respondents prized partners’ focus on building institutional capacity and systems to sustain the work in the long term (60 percent). They emphasized prioritizing longer-term impacts of activities beyond the life of the project itself (49 percent). Finally, leaders stressed coordination with other actors in a particular sector or region (42 percent).
Nearly all regions, except Latin America and the Caribbean, identified long-term planning among the top two attributes they valued in their partners. There was the strongest agreement among regional leaders about the importance of building institutional capacity (52 to 69 percent). Prioritizing long-term impacts was a consistently attractive attribute (38 to 55 percent). There was more volatility in how much leaders emphasized coordination with other actors as a priority—this was in the top 3 choices in four of six geographic regions. East Asia and Pacific respondents also explicitly cited planning for a transition after the partnership (45 percent) and conducting feasibility assessments (45 percent) as other important considerations.
Leaders in Latin America were more adamant that trustworthiness ( reliably offering sound advice or useful advice or support) was a more critical attribute they valued in a development partner. Twenty percent of leaders from the Latin America region selected this option in 2024 compared to 16 percent globally—a roughly 4 percentage point difference. Further unpacking what this means in practice, leaders who selected trustworthiness as a valuable attribute most often identified that an institution must have a good reputation internationally (57 percent), be straightforward and honest (41 percent), and that its organizational staff must develop trust with domestic stakeholders (34 percent).
Once again, there were some regional differences in how leaders interpreted trustworthiness. South Asian leaders emphasized that a partner should be responsive and communicate regularly, as well as follow through on commitments made in a timely manner. Leaders in sub-Saharan Africa more heavily weighted the transparency of motives and decision-making processes as a core ingredient to what made a partner trustworthy.
Figure 17. What did leaders say they valued most in a development partner?
Percentage of respondents who selected a specific attribute in 2024 as one they valued in a development partner
Table scrolls horizontally
| Partner Attributes | Global | EAP | ECA | LAC | MENA | SA | SSA |
|---|---|---|---|---|---|---|---|
| Close collaboration w gov counterparts | 51.1% | 60.3% | 43.8% | 48.2% | 49.2% | 55.6% | 52% |
| Suplied financial/material resources | 32% | 27.1% | 31.1% | 35.5% | 34.5% | 37% | 32.1% |
| Helped build support among locals | 27.7% | 32.4% | 21.2% | 26% | 22.8% | 24.1% | 30.9% |
| Provided access to highly qualified int'l experts | 17.1% | 15.1% | 20.1% | 19.6% | 18.5% | 12% | 15.7% |
| Translated broad policy guidance into specifics | 17% | 15.7% | 13.9% | 12.5% | 19.7% | 10.3% | 22.1% |
| Identified approaches to overcomoing barriers | 16.9% | 18.4% | 15.1% | 16.5% | 15.9% | 19.9% | 16.9% |
| Exercised careful management of resources | 14.9% | 12.4% | 11.5% | 16.8% | 20.1% | 17.1% | 16.3% |
| Provided implementers w discretion and flexibility | 14% | 17.7% | 12.9% | 11% | 10.7% | 13.3% | 14.8% |
| Provided valuable info for use in M&E | 13.2% | 13.7% | 16.3% | 13.1% | 22.7% | 12.9% | 9.7% |
| Aligned its implementation with those from other orgs | 9.2% | 11.5% | 8.3% | 7.7% | 6.4% | 5.5% | 10.4% |
| Minimized admin burden of implementation | 7.1% | 7.9% | 7% | 6.5% | 6.5% | 6.6% | 7.1% |
| Helped implementers make course corrections | 4.9% | 4.6% | 2.6% | 5.2% | 9.4% | 3.2% | 5.8% |
| don't know | 4.1% | 1.9% | 7.5% | 3.4% | 6.4% | 7.7% | 2.8% |
| other | 2.5% | 1.5% | 3.6% | 2.9% | 0.5% | 1.8% | 2.5% |
| none | 0.8% | 0.7% | 0.8% | 1.1% | 0% | 0% | 0.9% |
Figure 18. What did leaders say made a development partner adaptable?
Percentage of respondents who selected a specific attribute in 2024 as exemplifying what it meant in practice for a partner to “adapt its strategies to country needs”
Table scrolls horizontally
| Contributions | Global | EAP | ECA | LAC | MENA | SA | SSA |
|---|---|---|---|---|---|---|---|
| Willing to adapt approaches and strategies | 64.8% | 68.8% | 56.3% | 70.3% | 79.5% | 54% | 62% |
| Adapting projects to socio-cultural / political environment | 50.2% | 54.4% | 40.6% | 47.6% | 47.4% | 60.1% | 52.4% |
| Willingness to align projects and/or programs with national strategy | 49% | 56% | 46.4% | 42.7% | 30.7% | 53% | 52.5% |
| Adapting financing modalities to the needs | 36.9% | 35.1% | 35.2% | 38.3% | 37.3% | 26.7% | 39.2% |
| Convening stakeholders to co-create solutions | 30.4% | 21.1% | 32.6% | 35.4% | 25% | 36.2% | 32.2% |
| Willing to change their approach in the face of shocks/disasters | 16.3% | 17.3% | 13% | 20.2% | 21.5% | 18% | 14.3% |
Figure 19. What did leaders say made a development partner prioritize long-term planning?
Percentage of respondents who selected a given attribute in 2024 as exemplifying what it meant in practice for a partner to “prioritize long-term planning”
Table scrolls horizontally
| Contributions | Global | EAP | ECA | LAC | MENA | SA | SSA |
|---|---|---|---|---|---|---|---|
| Building institutional capacity for sustainability | 60.2% | 68.7% | 65.2% | 60% | 52.2% | 64.3% | 53.2% |
| Prioritizing long-term impacts | 49.2% | 42.1% | 47.3% | 48.3% | 38.3% | 55.4% | 54.9% |
| Coordinating with other actors in sector/region | 41.7% | 42.6% | 41.4% | 49.5% | 21% | 42.9% | 42.3% |
| Planning a transition for after the partnership | 34.9% | 44.9% | 27.6% | 39.3% | 31.1% | 28.2% | 36.3% |
| Conducting feasibility assessments | 32.3% | 45.4% | 21.6% | 23.5% | 31.5% | 40.8% | 34.3% |
| Ensuring financial flows are recorded in budget | 7.9% | 14.2% | 8.9% | 8.5% | 0% | 9.7% | 4.7% |
5. Conclusion: Reimagining future development cooperation
If the past decade was one of disruption, the next decade does not promise fairer weather for development cooperation. Traditional bilaterals are retreating from earlier official development assistance commitments and shifting money to defense and domestic priorities, while revamping programs to better reflect their national interests. Rising skepticism towards multilateralism and declining core contributions are challenging the viability of the UN system and international finance institutions to serve as robust venues for development cooperation. There has been a growing backlash as Global South countries question whether conventional aid has done more harm than good. Meanwhile, rising powers are challenging the traditional rules of the game and advocating for South-South Cooperation as a more sustainable alternative.
Simply put, development cooperation in this next decade faces a reckoning. Aid is an insufficient and unsustainable fuel to drive development outcomes. As advanced economies grapple with growing inequalities at home, political leaders recognize that it is increasingly untenable for them to make a case for development cooperation based solely on altruism. Their counterparts in low- and middle-income countries, meanwhile, want greater voice and choice in determining what to prioritize and how best to resource, deliver, and evaluate socio-economic progress. The heads of multilateral organizations recognize the need to bolster legitimacy, improve agility, and diversify their resource engines. Knowing and doing are two different things, however. Inertia and vested interests are potent deterrents to change.
In this report, we surfaced a decade's worth of insights from our Listening to Leaders Survey of public, private, and civil society leaders from 148 countries. Using surveys conducted in 2014, 2017, 2020, and 2024, we analyzed who was working with whom, how Global South leaders rated the performance of their development partners, and what factors might explain these perceptions. It is clear from this analysis that while development cooperation is imperfect, the preponderance of Global South leaders view their external partners as delivering value, providing financial resources and technical expertise, and working collaboratively with government and civil society.
In the next decade, development cooperation will likely be reimagined, as governments and international organizations revisit how they create, finance, and deliver value in support of Global South countries. As we conclude this Listening to Leaders 2025 report, we reflect on what our roughly 13,000 survey responses might tell us about how development cooperation can and should evolve. We highlight three opportunities for action.
Opportunity #1. Reorient future cooperation around shared prosperity and mutual benefit
Traditional bilaterals are at a critical juncture. The tendency to position bilateral aid as entirely altruistic—solely for other countries’ benefit—inadvertently raised taxpayer ire and political opposition at home. Political scrutiny and public criticism over aid programs prompted many advanced economies to make abrupt and dramatic changes to their aid architecture in ways that risk squandering critical technical expertise at home and counterpart goodwill abroad. Global South countries are less secure and more vulnerable, as they scramble to find alternative resources and expertise to sustain critical development gains.
There is an alternative path: rather than pure altruism, bilateral development cooperation could be more forthright in identifying areas of shared interest that are still responsive to what Global South counterparts want, while still strategically aligned with a donor’s national interests. As traditional bilaterals reorient their aid programs, it will be important to get the balance right if they want to amplify their ability to translate development assistance into global influence.
For traditional bilaterals that care about projecting influence with foreign leaders and publics, they should also be mindful that financial resources and technical expertise were by far the top two reasons to explain leader perceptions of development partner performance. Rather than reducing aid budgets, they could focus on how to better target and structure this assistance to get the most performance bang for their buck.
Survey responses highlight how traditional bilaterals might advance their priorities while still positioning themselves well in the eyes of Global South leaders. Respect for the host government’s authority, alignment with the host government’s national development strategy, and collaboration with host government and civil society actors were all key to describing why a development partner was influential or helpful. Leaders emphasized adaptability as a desirable attribute in their preferred partners, such as the willingness to adjust approaches in consultation with domestic stakeholders or to modify projects to fit the social, cultural, and political context.
Opportunity #2. Safeguard multilateral venues with an expanded voice for middle powers
Despite waning multilateralism, UN agencies and international finance institutions held steady or expanded their footprints, working with more Global South leaders and countries in 2024 than in 2017. When it comes to performance, these traditional multilaterals have consistently dominated the leaderboard on influence and helpfulness over the last decade, even as Global South leaders have more choice in their development partners than ever before.
Nevertheless, these traditional venues for international cooperation are under tremendous pressure from two directions. OECD DAC donors are reducing their aid commitments and increasingly channeling their assistance bilaterally or via issue-specific vertical funds. In parallel, non-traditional development partners and Global South countries are clamoring for greater voice and vote in the governance of international organizations.
Multilateral organizations have had to tread quite carefully in rebalancing power among their shareholders and member countries, for fear of losing traditional contributors. However, as large traditional bilaterals cut back their aid and engagement in international organizations, the strategic calculus may shift. Non-traditional development partners, smaller DAC bilaterals, and Global South countries may increasingly represent the future of multilateral development cooperation.
In a world characterized by intensified geopolitical competition, traditional multilaterals could position themselves as trustworthy venues to adjudicate between conflicting interests in ways that strengthen the negotiating power of non-traditional development partners, along with other low- and middle-income countries. Survey responses underscore that doubling down on building trust with Global South counterparts could help multilaterals cement their status as preferred partners, even as the broader development ecosystem is disrupted. Leaders pointed to the importance of an institution’s reputation for honesty and transparency and its processes for communicating regularly and timely follow-through on commitments.
Opportunity #3. Get serious about policy coherence and a broader suite of economic tools
Low- and middle-income countries look for partners to unlock financing and expertise to help them build the political institutions, technical capacity, and strong societies necessary to mobilize domestic resources and attract foreign investment. In conflict and crisis, they seek to ensure that short-term emergencies do not derail hard-won progress in the long term.
Official development assistance (aid)—such as that employed by many of the bilateral and multilateral partners assessed in this report—is a critical resource for resource-constrained countries to address challenges that cannot yet attract private sector investment. At the same time, aid is problematic in two respects. It is unpredictable: aid waxes, wanes, and pivots in response to the priorities of government agencies and international organizations. It is also inherently unsustainable. Aid is a temporary, time-bound solution rather than a renewable resource that low- and middle-income countries can or should rely upon.
The survey results indicate that Global South leaders recognize this. They want development partners to prioritize sustainability in building local capacity, prioritizing long-term impacts, and coordinating well with other actors, rather than working in isolation. Some survey respondents also explicitly cited planning for a transition after the partnership as another key consideration. Rather than episodically reacting to short-term crises, development partners should look to create the conditions for countries to transition from aid to trade and investment partners.
As aid is likely to be in increasingly short supply in the coming decade, it will be even more important for development partners to focus on creating synergies between aid and other tools of economic statecraft, such as trade, foreign direct investment, and remittances. These non-aid flows are critical to help low- and middle-income countries expand the available resource envelope to advance development in their societies. This implies that international organizations and government agencies need to walk the talk of “policy coherence,” ensuring broader economic policies are helping, not hindering, this goal (OECD, 2023c).
References
Alayza, N., Laxton, V., Neunuebel, C., and J. Thwaites. Multilateral Development Bank Climate Finance: The Good, The Bad, and the Urgent. November 14, 2024. World Resources Institute. https://www.wri.org/insights/mdb-climate-finance-2023
Aly, H. Gulrajani, N., and J. Pudussery. (2024). Dialogue #1: Crafting a new rationale for northern donorship. ODI Global. December 6, 2024. https://odi.org/en/publications/dialogue-1-crafting-a-new-rationale-for-northern-donorship/
Asmus, G., Fuchs, A., and A. Muller. (2017). BRICS and Foreign Aid. Working Paper 43. AidData Working Paper Series. August 2017. https://docs.aiddata.org/ad4/files/wps43_brics_and_foreign_aid.pdf
Azevedo, Daniel, Saurabh Bakliwal, Cinthia Chen, Marc Gilbert, Iacob Koch-Weser, Nikolaus Lang, and Michael McAdoo. 2024. “An Evolving BRICS and the Shifting World Order.” Boston Consulting Group
Belga. (2025). Belgium to cut development cooperation funding by a quarter. February 6, 2025. https://www.belganewsagency.eu/belgium-to-cut-development-cooperation-funding-by-a-quarter
Bhattacharya, D., Khan, T.I., Mohammed, A., and M. Jannat. (2025). Southern MDBs: More of the Same? Center for Global Development. January 13, 2025. https://www.cgdev.org/blog/southern-mdbs-more-same
Burgess, B. and Custer, S. 2023. Catalytic Partnerships: Opportunities and Challenges in Mobilizing U.S. Private Sector Resources to Scale America’s Contribution to Development Overseas. Williamsburg, VA: AidData at William & Mary. https://www.aiddata.org/publications/catalytic-partnerships-opportunities-and-challenges-in-mobilizing-u-s-private-sector-resources-to-scale-americas-contribution-to-development-overseas
Burgess, B., Custer, J., and S. Custer. 2023. Financing Agenda 2030: Are international aid donors missing the mark on the Sustainable Development Goals? Williamsburg, VA: AidData at William & Mary. https://www.aiddata.org/publications/financing-agenda-2030-are-donors-missing-the-mark-on-the-sustainable-development-goals
Carment, D. and R. Calleja. (2013). Canada in Focus: How Good is Our Foreign Aid Policy. Canadian Global Affairs Institute. October 2013. https://www.cgai.ca/canada_in_focus_how_good_is_our_foreign_aid_policy
CGD. (2025). Southern MDBs: A Multilateral Solution for South-South Cooperation. Center for Global Development. January 13, 2025. Center for Global Development. MDB Reform Accelerator. https://mdbreformaccelerator.cgdev.org/southern-mdbs-a-multilateral-solution-for-south-sout h-cooperation/
Craig, J. (2025). The devastating impact of Trump’s slashing foreign aid, in 3 charts. March 16, 2025. Vox News. https://www.vox.com/future-perfect/404040/foreign-aid-cuts-trump-charts-usaid-pepfar-who-hiv
Custer, S., Heinzel, M., Horigoshi, A., and B. Reinsberg. (2025). Good Governance and the Legitimacy of International Organizations: Evidence from an Elite Survey in 148 Countries. Conference Paper. Political Economy of International Organizations Conference. January 2025 at Harvard University. https://www.peio.me/wp-content/uploads/PEIO17/submission_57.pdf
Custer, S., Horigoshi, A., and K. Marshall. (2023). Chapter: Responding to Global South views on development priorities, progress and partner performance. IN: OECD (2023), Development Co-operation Report 2023: Debating the Aid System, OECD Publishing, Paris, https://doi.org/10.1787/f6edc3c2-en.
Custer, S., Sethi, T., Knight, R., Hutchinson, A., Choo, V., and M. Cheng. (2021). Listening to Leaders 2021: A report card for development partners in an era of contested cooperation. Williamsburg, VA: AidData at the College of William & Mary. https://www.aiddata.org/publications/listening-to-leaders-2021
Custer, S., DiLorenzo, M., Masaki, T., Sethi, T., and A. Harutyunyan. (2018a). Listening to Leaders 2018: Is development cooperation tuned-in or tone-deaf?. Williamsburg, VA: AidData at the College of William & Mary. https://www.aiddata.org/publications/listening-to-leaders-2018
Custer, S., Rice, Z., Masaki, T., Latourell, R., & Parks, B.C. (2015). Listening to leaders: Which development partners do they prefer and why? Williamsburg, VA: AidData at the College of William & Mary. https://www.aiddata.org/publications/listening-to-leaders-which-development-partners-do-they-prefer-and-why
Davies, R. (2025). Burden-shedding: the unraveling of the OECD aid consensus. March 7, 2025. DevPolicyBlog. Australian National University. https://devpolicy.org/burden-shedding-the-unravelling-of-the-oecd-aid-consensus-20250307/
Demirjian, K., Nolen, S., Crowley, M., and E. Dias. (2025). Final Cuts Will Eliminate U.S. Aid Agency in All but Name. March 28, 2025. https://www.nytimes.com/2025/03/28/us/politics/usaid-trump-doge-cuts.html
Donor Tracker. (2024a). France. Donor Profile. Updated December 20, 2024. Retrieved from: https://donortracker.org/donor_profiles/france
Donor Tracker. (2024b). Netherlands. Donor Profile. Updated December 20, 2024. Retrieved from: https://donortracker.org/donor_profiles/netherlands
Donor Tracker. (2025. United States. Donor Profile. Updated January 30, 2025. Retrieved from: https://donortracker.org/donor_profiles/united-states
DoS. (2025). Implementing the President’s Executive Order on Reevaluating and Realigning United States Foreign Aid. January 26, 2025. Press Statement. Department of State. https://www.state.gov/implementing-the-presidents-executive-order-on-reevaluating-and-realigning-united-states-foreign-aid/
Ero, C. and R. Atwood. (2024). 10 Conflicts to Watch in 2024. January 1, 2024. International Crisis Group. https://www.crisisgroup.org/global/10-conflicts-watch-2024
Fabbro, R. and R. Gramer. (2023). Taiwan Isn’t Playing Dollar Diplomacy Anymore. April 24, 2023. Foreign Policy. https://foreignpolicy.com/2023/04/24/taiwan-china-competition-dollar-diplomacy/
Faust, J., Leiderer, L., Masaki, T., Parks, B. C. (2016). German Aid from a Partner Perspective: Experience-based Perceptions from AidData’s 2014 Reform Efforts Survey. Bonn, Germany: German Institute for Development Evaluation (DEval). https://www.aiddata.org/publications/german-aid-from-a-partner-perspective
Fund for Peace. (2022). Fragile States Index: 2022. Retrieved from: https://fragilestatesindex.org/wp-content/uploads/2022/07/22-FSI-Report-Final.pdf
Gaines, 2024. CGD Publishes 2024 Multilateral Development Bank Reform Tracker Ahead of World Bank-IMF Spring Meetings. April 11, 2024. Center for Global Development. https://www.cgdev.org/article/cgd-publishes-2024-multilateral-development-bank-reform-tracker-ahead-world-bank-imf-spring
Graham, E. R. (2024). How funding sidelined multilateralism at the United Nations Then, Now, and Possible Futures. March 12, 2024. Columbia University. https://multilateralism.sipa.columbia.edu/news/how-funding-sidelined-multilateralism-united-nations-then-now-and-possible-futures
Gulrajani, N. and J. Pudussery. (2025). With the knives out on development spending, have we reached ‘peak aid’? January 23, 2025. The Guardian. https://www.theguardian.com/global-development/2025/jan/23/global-development-economics-donor-spending-refugee-oecd-world-bank-peak-aid#:~:text=baseline%20that%20is%20%244,lower
Gulrajani, N. and E. Lundsgaarde. (2023). Navigating core funding frontiers: Assessing options for mobilizing flexible multilateral financing. November 2023. ODI. https://media.odi.org/documents/DPF_WP_Navigating_core_funding_frontiers_Kpjuuom.pdf
G7 Italia. (2024). G7 Partnership for Global Infrastructure and Investment Side Event Co-Chair Statement. June 13, 2024. https://www.g7italy.it/en/g7-partnership-for-global-infrastructure-and-investment-side-event-co-chair-statement/
G20. (2024). G20 Roadmap towards Better, Bigger, and More Effective MDBs. 4th Finance Ministers and Central Bank Governors Meeting. October 2024. https://coebank.org/documents/1577/G20_Roadmap_towards_better_bigger_and_more_effective_MDBs.pdf
GoN. (2025). Foreign trade and development minister Reinetter Klever: Dutch interests at the heart of development policy. February 20, 2025. Government of the Netherlands. https://www.government.nl/latest/news/2025/02/20/minister-reinette-klever-dutch-interests-at-the-heart-of-development-policy
Hendra, J. (2024). Reductions, reallocations, and replenishments — Will this be the year of the big squeeze on the UN Development System? September 2024. Financing UN Report. https://financingun.report/essay/reductions-reallocations-and-replenishments-will-be-year-big-squeeze-un-development-system
Hird, A. (2025). France’s proposed budget cuts set to slash overseas development aid. February 5, 2025. RFI. https://www.rfi.fr/en/france/20250205-france-proposed-budget-cuts-slash-overseas-development-aid-coordinationo-sud
Horigoshi, A. and Custer, S. 2023. Humanitarian-Development-Peace Nexus: Successes, Failures, and Lessons from U.S. Assistance in Crisis and Conflict. Williamsburg, VA: AidData at William & Mary. https://www.aiddata.org/publications/humanitarian-development-peace-nexus-successes-failures-and-lessons-from-u-s-assistance-in-crisis-and-conflict
Higham, A. Marco Rubio Announces Major USAID Cuts. March 10, 2025. Newsweek. https://www.newsweek.com/marco-rubio-major-said-cuts-elon-musk-2042136
Hird, A. (2025). France’s proposed budget cuts set to slash overseas development aid. February 5, 2025. RFI. https://www.rfi.fr/en/france/20250205-france-proposed-budget-cuts-slash-overseas-development-aid-coordinationo-sud
Ikenberry, G. John. (2025). American Foreign Policy at a Crossroads. IN: Great Decisions 2025. Foreign Policy Association. January 8, 2025.
ISDB. (2025). IsDB Member Countries. https://www.isdb.org/isdb-member-countries
Khan, M.S., Meghani, A., Liverani, M., Roychowdhury, I., and J. Parkhurst. (2018). How do external donors influence national health policy processes? Experiences of domestic policy actors in Cambodia and Pakistan, Health Policy and Planning, Volume 33, Issue 2, March 2018, Pages 215–223, https://doi.org/10.1093/heapol/czx145 https://academic.oup.com/heapol/article/33/2/215/4718134
Knickmeyer, E., Lee, M., and M. Sherman. (2025). Trump administration says it’s cutting 90% of USAID foreign aid contracts. February 26, 2025. Associated Press. https://apnews.com/article/trump-usaid-foreign-aid-cuts-6292f48f8d4025bed0bf5c3e9d623c16
Kunert, L., Guffler, K., & Sethi, T. (2021). Development Cooperation from a Partner Perspective (Phase II): How can Germany and other donors perform better in the eyes of their partner countries? (DEval Policy Brief, 3/2021). Bonn: Deutsches Evaluierungsinstitut der Entwicklungszusammenarbeit (DEval). https://www.aiddata.org/publications/development-cooperation-from-a-partner-perspective
Lee, N. and S. Matthews. (2024). CGD’s Updated MDB Reform Tracker. October 18, 2024. Center for Global Development. https://www.cgdev.org/publication/mdb-ships-are-turning-not-yet-course-results-cgds-updated-mdb-reform-tracker
MacKinnon, V. (2024). The Global Safety Net Frays: European Countries Cut Foreign Aid. Global Citizen. December 11, 2024. https://www.globalcitizen.org/en/content/the-global-safety-net-frays-european-countries-cut/#:~:text=powerhouse%20isn%E2%80%99t%20immune%20to%20the, austerity%20wave
Mathew, D. and Custer, S. 2023. Aid in the National Interest: How America’s Comparators Structure their Development Assistance. Williamsburg, VA: AidData at William & Mary. https://www.aiddata.org/publications/aid-in-the-national-interest-how-americas-comparators-structure-their-development-assistance
McVeigh, K. (2025). How much does the UK spend on overseas aid - and where does the money go? Guardian. February 28, 2025. https://www.theguardian.com/global-development/2025/feb/28/how-much-does-the-uk-spend-on-overseas-aid-and-where-does-the-money-go
Meijer, B.H. (2024). Dutch right-wing government cuts development aid as deficit balloons. Reuters. September 17, 2024. https://www.reuters.com/world/europe/dutch-right-wing-government-cuts-development-aid-deficit-balloons-2024-09-17/#:~:text=AMSTERDAM%2C%20Sept%2017%20%28Reuters%29%20,expected%20deterioration%20in%20state%20finances
Mitchell, I. and S. Hughes. (2025). Breaking Down Prime Minister Starmer’s Aid Cut. February 26, 2025. Center for Global Development. https://www.cgdev.org/blog/breaking-down-prime-minister-starmers-aid-cut
OECD. (2024a). Multilateral Development Finance 2024. OECD Publishing, Paris, https://doi.org/10.1787/8f1e2b9b-en.
OECD. (2024b). OECD Development Cooperation Peer Reviews: Finland 2024. December 13, 2024. https://www.oecd.org/en/publications/oecd-development-co-operation-peer-reviews-finland-2024_2a9a43a2-en.html
OECD. (2023a). Global Outlook on Financing for Sustainable Development 2023: No Sustainability Without Equity. https://www.oecd.org/finance/global-outlook-on-financing-for-sustainable-developmen t-2023-fcbe6ce9-en.html
OECD. (2023b). Official Development Assistance (ODA) in 2023. https://www.oecd.org/en/topics/official-development-assistance-oda.html
OECD. (2023c). Development Cooperation Report 2023. Debating the Aid System. February 13, 2023. https://www.oecd.org/en/publications/development-co-operation-report-2023_f6edc3c2-en/full-report.html
Palik, J., Obermeier, A.M., and S.A. Rustad. (2022). Conflict Trends: A Global Overview—1946-2021. PRIO Paper. Retrieved from: https://cdn.cloud.prio.org/files/988284ec-ec0d-4d9b-ba30-006b223ce98e/Palik%20et %20al%20-%20Conflict%20Trends%20A%20Global%20Overview%201946-2021%20PR IO%20Paper%202022.pdf?inline=true
Parks, B. C., Custer, S., Masaki, T., Sethi, T., & Latourell, R. (2016). Danish Development Cooperation from a Partner Country Perspective. Williamsburg, VA: AidData at William & Mary. https://www.aiddata.org/publications/danish-development-cooperation-from-a-partner-perspective
Pham, Quynh N., and Robbie Shilliam. 2016. Meanings of Bandung: Postcolonial Orders and Decolonial Visions. London: Rowman and Littlefield.
Sethi, T. and J. Solis. (2020). Looking West? Gauging Perceptions of the United States in Europe and Eurasia. Unpublished analysis prepared for internal USAID consumption.
Strüver, G. (2016). What Friends Are Made of: Bilateral Linkages and Domestic Drivers of Foreign Policy Alignment with China, Foreign Policy A nalysis, Volume 12, Issue 2, April 2016, Pages 170–191, https://doi.org/10.1111/fpa.12050 ; https://academic.oup.com/fpa/article-abstract/12/2/170/2367626?redirectedFrom=fulltext
UN DESA. (2019). What is ‘South-South Cooperation’ and Why Does it Matter? United Nations Department of Economic and Social Affairs. March 20, 2019. https://www.un.org/development/desa/en/news/intergovernmental-coordination/south-south-cooperation-2019.html
White House. (2025b). Commencing the Reduction of the Federal Bureaucracy. Executive Order. February 19, 2025. https://www.whitehouse.gov/presidential-actions/2025/02/commencing-the-reductionof-the-federal-bureaucracy/
White House. (2025a). Reevaluating and Realigning United States Foreign Aid. Executive Order. January 20, 2025. https://www.whitehouse.gov/presidential-actions/2025/01/reevaluating-and-realigningunited-states-foreign-aid/
White House. (2025c). Withdrawing the United States from the World Health Organization. Executive Order. January 20, 2025. https://www.whitehouse.gov/presidential-actions/2025/01/withdrawing-the-united-stat es-from-the-worldhealth-organization/
Wike, R. and J. Fetterolf. (2021). Global Public Opinion in an Era of Democratic Anxiety. December 7, 2021. Pew Research. https://www.pewresearch.org/global/2021/12/07/global-public-opinion-in-an-era-of-democratic-anxiety/
World Bank. (2023). 2023 in Nine Charts: A Growing Inequality. https://www.worldbank.org/en/news/feature/2023/12/18/2023-in-nine-charts-a-growing-inequality
World Economic Forum. (2025). The Global Risks Report 2025: 20th Edition. Insight Report. https://reports.weforum.org/docs/WEF_Global_Risks_Report_2025.pdf
UN. (n.d.). Inequality - Bridging the Divide. United Nations. https://www.un.org/en/un75/inequality-bridging-divide
UN OSSC. (2024). Asia-Pacific: South-South and Triangular Cooperation Can Boost and Transform Financing for Development. December 23, 2024. UN Office of South-South Cooperation. https://unsouthsouth.org/2024/12/23/potential-of-south-south-and-triangular-cooperation-to-boost-and-transform-financing-for-development/#:~:text= South%2DSouth%20cooperation%20is%20expanding , for%2C%20North%2DSouth%20cooperation
Krutikova, S., & Warwick, R. (2017). The changing landscape of UK aid. Briefing Note BN204, Institute for Fiscal Studies. https://ifs.org.uk/sites/default/files/output_url_files/BN204.pdf
Worley, W. (2020). What went wrong for UK aid? Devex. 21 December 2020. Accessed May 28, 2021. https://www.devex.com/news/whatwent-wrong-for-uk-aid-98802
Troilo, P. Inside the takedowns of AusAID and CIDA. January 19, 2015. DevEx. https://www.devex.com/news/inside-the-takedowns-of-ausaid-and-cida-85278
UNGC and Accenture. (2023). UN Private Sector SDG Stocktake. September 14, 2023. https://www.accenture.com/us-en/insights/sustainability/getting-sdgs-back-on-track
UNSDG. (2023). With trillions needed to achieve SDGs, world leaders urged to rapidly scale up investments. UN Sustainable Development Group. September 20, 2023. https://unsdg.un.org/latest/announcements/trillions-needed-achieve-sdgs-world-leaders-urged-rapidly-scale-investments
World Bank Group and International Monetary Fund. (2015). From Billions to Trillions: Transforming Development Finance. April 2, 2015. https://thedocs.worldbank.org/en/doc/622841485963735448-0270022017/original/DC20150002EFinancingforDevelopment.pdf
Zeng, W. (2024). Climate finance and new multilateral development banks: approaching co-productive dynamics? Climate Policy, 1–14. https://doi.org/10.1080/14693062.2024.2442004
[1] By development cooperation, we refer to helping countries catalyze long-term social and economic progress in their societies.
[2] This classification is based on respondent answers to a question about the type of organization they worked for the longest during the past five years: mid- to senior-level executive branch officials; parliamentarians; civil society representatives; private sector leaders; representatives of universities, think tanks, and media; and the local representatives of development partners.
[3] Burgess and Custer (2023) argued that if we compared bilateral OECD DAC donors and private philanthropies, the Gates Foundation would be the tenth largest donor in the world.
[4] The full list of development partners in each survey wave is included in the technical appendix.
[5] To collapse responses from individual organizations to the donor country level we take the following approach: if the respondent engaged with any one of the organizations we consider that he/she engaged with the donor country. The same logic is applied to the influence and helpfulness measure s: if the respondent considered at least one of the organizations under a donor country’s flag as influential/helpful, we consider that he/she found the donor country influential/helpful. This process is done only for bilaterals.
[6] The 2014 questionnaire had slightly different wording that ask ed about “reform efforts,” rather than policy initiatives.
[7] Respondents could also write in responses.
[8] There was a slight modification between the first and subsequent surveys. In 2014, regional organizations were only presented as options to respondents from the relevant region, while in future waves all respondents were presented with the same set of organizations to consider.
[9] Ratings for the 2017, 2020, and 2024 are based on the percentage of responses evaluating a given partner which rated that partner as “quite influential/helpful” or “very influential/helpful.” In 2014, respondents were asked to score a development partner's influence/helpfulness from 0 (“not influential/helpful at all”) to 5 (“maximum influence/helpfulness”). To harmonize scales for comparison across years, 2014 rankings were re-calibrated by rescaling the average scores for each partner to range between 0 and 1 and by removing country weights.
[10] The first Listening to Leaders report published in 2015 initially used a minimum threshold of responses of 10. Based on helpful feedback from peer reviewers, AidData subsequently increased the threshold to 30 respondents for the 2018 and 2021 reports, in order to avoid overstating a development partner’s scores based on a relatively small sample. In this report, we apply the same threshold of 30 responses for all four survey waves for consistency and comparability.
[11] The World Bank, UNDP, and U.S. were in the top 10 largest footprint donors with leaders from 6 of 6 geographic regions. UNICEF and the EU were among the largest footprint donors in 5 of 6 regions. WHO, FAO, and IMF achieved this in 4 of 6 regions, while Germany did the same in 3 of 6 regions.
[12] The World Bank, UNDP, EU, US, Germany, and Japan were among the largest footprint donors with leaders from all 7 sectors.
[13] The World Bank, UNDP, and EU were among the top three largest footprint donors with leaders from four of five stakeholder groups. The United States was also in the top three largest footprint donors for private sector and NGO leaders.
[14] “Northern-led” is an imperfect shorthand to differentiate multilaterals whose origins and major shareholders are primarily “created, governed, and influenced by developed countries or ‘Global North’ countries” (Zeng, 2024).
[15] The “Southern-led” Islamic Development Bank (ISDB), whose largest shareholders are primarily developing economies (ISDB, n.d.), was the exception, working with only 16 percent of leaders surveyed from the MENA region.
[16] OECD DAC member countries include Australia, Austria, Belgium, Canada, Czechia, Denmark, Estonia, European Union, Finland, France, Germany, Greece, Hungary, Iceland, Ireland, Italy, Japan, Lithuania, Luxembourg, Netherlands, New Zealand, Norway, Poland, Portugal, Slovak Republic, Slovenia, Spain, South Korea, Sweden, Switzerland, United Kingdom, and the United States.
[17] The following OECD DAC member countries were either not included in the survey or had insufficiently large sample sizes to be included in this disaggregated analysis: Czechia, Estonia, Greece, Hungary, Iceland, Lithuania, Poland, Slovak Republic, and Slovenia.
[18] Switzerland and Sweden were among the top 10 largest development partners by footprint in Europe and Central Asia. Australia and Canada achieved the same feat in East Asia and Pacific and Latin America and the Caribbean, respectively.
[19] We test for the magnitude of the effect of aid on the likelihood of a respondent engaging with a development partner by running a binomial regression. We include as explanatory variables a measure of aid calculated as the mean official development assistance (ODA) provided from a given development partner in the three years prior to the year in which the survey was conducted, fixed effects for the survey wave, and interactions between the survey waves and ODA.
[20] Beijing structures its development finance primarily in the form of debt (e.g., export credits and loans approaching market rates) rather than grants or concessional lending (e.g., loans at no- or low-interest rates) (Parks et al., 2023; Custer et al., 2025).
[21] The U.S. dramatically upended a development architecture that dated back to the end of World War II, shuttering multiple aid agencies, and exiting the WHO (White House, 2025a-c, Higham, 2025). France and the UK have announced planned cuts to future aid budgets by 40 and nearly 50 percent, respectively (Hird, 2025; McVeigh, 2025). Advanced economies are no longer only suppliers of aid but recipients as they “spend nearly one in five of their aid dollars at home” (ONE Campaign, 2023).
[22] By one estimate, the World Bank Group and regional development banks are pursuing “39 separate reform agenda items,” comprising the “most ambitious effort to overhaul these institutions” since their inception (Lee and Matthews, 2024).
[23] There were 35 development partners above the average influence score of 72.4 percent.
[24] There were 37 development partners above the average helpfulness score of 81.8 percent.
[25] T he most influential traditional bilateral was New Zealand (87.3 percent) and the least influential was Italy (60.6 percent).
[26] The most helpful traditional bilateral was Portugal (96 percent) and the least helpful was Austria (71.3 percent).
[27] The Islamic Development Bank was the best performing non-traditional multilateral across both measures (68.1 percent influence, 55.9 percent helpful).
[28] Multi-region influencers included: the U.S. and the WB (6/6 regions each), the IMF (5/6 regions), the EU (4/6 regions), the UNDP and the WHO (3/6 regions each). Multi-region helpers included: the EU and the WHO (5/6 regions), the U.S., UNICEF, and the WB (4/6 regions), along with the UNDP and Germany (3/6 regions each). Multi-sector influencers included: the EU, IMF, WB, and U.S. (7/7 sectors each), WHO (6/7 sectors), along with the Global Environment Facility (4/7 sectors) and the AFDB (3/7 sectors). Multi-sector helpers included: UNICEF and the EU (6/7 sectors each) and the WHO (4/7).
[29] Leaders from East Asia and Pacific gave high marks to development partners who were also regional powers: New Zealand (1st influence, 2nd helpful); Japan (3rd influence, 4th helpful); Australia (9th influence, 6th helpful); China (10th influence), along with South Korea (1st helpful).
[30] Portugal also historically orients a large share of its assistance portfolio to least developed countries in general and specifically those in the Sub-Saharan Africa region (OECD, 2020d; (UNCTAD, n.d.).
[31] Linguistic and cultural ties may play a role in the high marks given by leaders from South Asia to India (1st influence, 5th helpful), from Sub-Saharan Africa to Portugal (2nd influence, 1st helpful), and from Latin America and the Caribbean to Spain (8th influence, 2nd helpful).
[32] Germany (9th influence, 10th helpful) and the UK (6th influence, 6th helpfulness) were among the top performing development partners with leaders from Europe and Central Asia.
[33] Ireland was the 23rd most influential in s ub-Saharan Africa and South Korea the 23rd most influential in Latin America and the Caribbean.
[34] Among extremely fragile states, they ranked as follows: UK (1st influence, 4th helpfulness); Japan (13th influence, 6th helpfulness); and France (6th influence, 10th helpfulness)
[35] Among respondents from small island states, they ranked as follows: Portugal (5th influence, 1st helpfulness); New Zealand (1st influence, 2nd helpfulness); Australia (3rd influence, 5th helpfulness); and Taiwan (16th influence, 4th helpfulness)
[36] IFAD ranked 14th in influence and 8th in helpfulness among respondents from the rural development sector, FAO ranked 13th in influence and 6th in helpfulness among respondents in the rural development sector, and UNESCO ranked 8th in influence and 5th in helpfulness among respondents in the infrastructure sector.
[37] In 2022-2023, AidData fielded an online survey of Global South leaders to understand how they think about their preferred partners by sector out of a choice of five bilateral actors and a relevant regional power. The results from this survey signaled that while enthusiasm was strong among leaders surveyed to work with China and Japan as top development partners in the infrastructure sector, that was not the case for the European economies (e.g., France, Germany, the UK) or the U.S.
[38] The U.S. was the most influential and 4th most helpful, Japan was the 6th most influential a nd 3rd most helpful.
[39] GEF ranked 5th in influence and 1st in helpfulness, while UNEP ranked 6th in influence and 9th in helpfulness.
[40] The four development partners whose influence scores declined since 2017 include: Kuwait (-4.7 percentage points), Denmark (-8.3), the Inter-American Development Bank, IDB (-3.6), and Opec Fund for International Development, OFID (-0.7). The seven development partners whose influence scores declined since 2020 include: the Netherlands (-4.6 percentage points), Brazil (-4.1), OFID (-3), Switzerland (-1.6), Turkey (-1.3), China (-1.2), and the IDB (-0.3).
[41] The top 10 most improved on influence since 2014 included South Africa, India, the United Arab Emirates, Russia, Saudi Arabia, China, BADEA, ISDB, Kuwait, and the Global Fund, which tied with OFID. If we consider all development partners that had 20 percentage points or greater improvement on influence, this group becomes more diverse: we start to see more representation across different cohort groups.
[42] The 10 most improved influencers since 2020 were more diverse, including non-traditional bilaterals (India, South Africa), a private foundation (Ford Foundation), traditional multilaterals (GAVI, Global Fund), traditional bilaterals (New Zealand, Finland, Luxembourg), and a traditional multilateral (the Multilateral Investment Guarantee Agency).
[43] Top influencers across survey waves included: the Global Fund (2014, 2017), IMF (2014-2024), WB (2014-2024), New Zealand (2014, 2024), U.S. (2014-2024), GAVI (2024), EU (2014-2024), WHO (2020-2024), EBRD (2020-2024), Portugal (2024), China (2020), IDB (2014, 2020), UNDP (2014-2020), UK (2014-2020), ADB (2014-2017), and Denmark (2014).
[44] There were only three instances of a decline in perceived helpfulness since 2014: Austria (-6.3 percentage points), Turkey (-2.4), and Denmark (-3.8).
[45] The five development partners whose helpfulness scores declined since 2017 include: I DB (-0.4 percentage points), India (-1.6), Denmark (-1.2), Gates Foundation (-1.4), BADEA (-12.6). The ten development partners who saw a decline on this measure between 2020 and 2024 include: Austria (-10.6 percentage points), MIGA (-7.3), EBRD (-3.6), UAE (-2.4), Brazil (-1.8), CDB (-1.7), Netherlands (-1.1), IDB (-0.7), Turkey (-0.6), and Norway (-0.5).
[46] The largest improvements in helpfulness between 2014 and 2024 were: Portugal (+32.1), Kuwait (+21.7), China (+21.2), and South Korea (20.9). Between 2020 and 2024, traditional bilaterals like Belgium and Luxembourg, along with non-traditional development partners such as Saudi Arabia, South Africa, Israel, and the Arab Bank for Economic Development in Africa (BADEA) were among those who made the largest gains, along with the Ford Foundation and the GEF.
[47] Top helpers across surveys included: Portugal (2024), the Global Fund (2017-2024), GAVI (2017, 2024), New Zealand (2014 and 2024), UNICEF (2014-2024), WHO (2024), EU (2014-2024), USA (2017-2024), WB (2014-2024), UNDP (2020), EBRD (2020), ADB (2020) IDB (2017-2020); BADEA (2017), IMF (2014-2017), Gates Foundation (2017), Denmark (2014), GEF (2014), Switzerland (2014), and Austria (2014).
[48] Respondents could select reasons and attributes from a preset list of responses and were then asked follow-up questions to drill down on those preferences.
[49] These results were robust across all model specifications (varying both the method and the covariates). For more information, please see the technical appendix.
[50] This analysis is limited to the provision of grants and concessional lending (no- or low-interest loans), which meet the OECD’s aid criteria and excludes non-concessional lending and export credits (other official flows). For this reason, we restricted this analysis to only include traditional bilateral and multilateral development partners who continue to supply much of their development finance in the form of conventional aid.
[51] This has not always been the case, as we did not find similar evidence of this in our first LtL survey (Custer et al., 2015), nor did a similar study conducted related to perceptions of U.S. performance (Sethi and Solis, 2020).
[52] In constructing each odds ratio, we identified one category as the “baseline” against which the other categories were being compared. For the stakeholder type, we used “local representatives of development partners” as the baseline to compare each of the other groups: government officials, parliamentarians, independent experts, civil society, and private sector.
[53] We did not find a significant effect of being a member of parliament on perceptions of development partner influence.
[54] In constructing each odds ratio, we identified one category as the “baseline” against which the other categories were being compared. For the sector of expertise, we used “economic” as the baseline to compare each of the other groups: social, rural development, governance, infrastructure, environment, and other.
[55] In constructing each odds ratio, we identified one category as the “baseline” against which the other categories were being compared. For geographic regions, we used “East Asia and Pacific” as the baseline to compare each of the other groups: Europe and Central Asia, South Asia, Middle East and North Africa, Latin America and the Caribbean, and Sub-Saharan Africa. None of the other country cohort types (including region, income, fragility, small island state status, and level of democracy) had significant results that held across models for influence.
[56] Note that the results for helpfulness refer to a model specification that includes variables for region as well as country cohort types, unlike the specification for influence which does not include country cohorts.
[57] The baseline for the income category was “h igh income.”
[58] In 2020, 40 percent of leaders selected provision of financial/material resources as a top reason for influence. In 2017, just under 40 percent of leaders selected this reason.
[59] In 2020 and 2017, roughly 38 percent of leaders emphasized financial/material resources as a top reason for helpfulness, and in 2024, between 27 and 36 percent of respondents from different regions did the same.
[60] In 2024, access to int ernational experts was often in the top 3 reasons for influence across regions, with the exception of South Asia and East Asia and the Pacific.
[61] In 2024, 21 percent of leaders from South Asia and 20 percent of leaders from Latin America and the Caribbean emphasized the high quality of advice/assistance as a top reason for influence.
[62] In 2024, 19 percent of leaders from Europe and Central Asia and 21 percent of leaders from Latin America and the Caribbean emphasized “appropriate institution to provide assistance” as a top reason for influence.
[63] The intensity of preference varied from a high of 27 percent in the Middle East and North Africa to 13 percent in Europe and Central Asia.
[64] In 2024, “close collaboration with government counterparts” was selected as a top reason for helpfulness for between 44 and 60 percent of leaders depending on the region, while “building support among locals” was selected by a range of between 21 and 32 percent of leaders across regions.
[65] In 2020, 35 percent of leaders selected “working closely with government officials” as an important reason for influence. That same year, roughly 48 percent emphasized “ close collaboration with government counterparts” as critical to helpfulness (+6 percentage points since 2017 survey). “Building support among locals” was also a popular reason for helpfulness in 2020, selected by roughly 31 percent of respondents that year.
[66] In comparison to global percentages of 13 percent and 15 percent, respectively.
[67] “Willingness to adapt” was always within the top 2 most valued attributes in 2024, but the intensity with which leaders emphasized this varied, from a high of 52 percent of respondents from the Middle East and North Africa to a low of 32 percent in South Asia.
[68] There was generally broad agreement on these attributes of adaptability, which typically were consistently in the top 3 choices across most regions.