Balancing Risk and Reward:
Who benefits from China’s investments in Indonesia?
Samantha Custer, Bryan Burgess, Han Kyeol Kim, Muhammad Faiz Krisnadi, Kelsey Marshall, Divya Mathew, Felix Patrick, Alland Dharma Saputra, Jonathan A. Solis, Narayani Sritharan
June 2025
Acknowledgements
This report was prepared by Samantha Custer, Bryan Burgess, Han Kyeol Kim, Muhammad Faiz Krisnadi, Kelsey Marshall, Divya Mathew, Felix Patrick, Alland Dharma Saputra, Jonathan A. Solis, Narayani Sritharan. John Custer and Sarina Patterson supported this publication’s layout, editing, and visuals. The cover design is by Sarina Patterson, with photos of the Suramadu bridge (left) and the Jakarta–Bandung High-Speed Rail (right) by Dodo Hawe and Habib Farindra, respectively, via Adobe Stock, used under the Standard license. This study was conducted by AidData, a U.S.-based research lab at William & Mary’s Global Research Institute, in collaboration with Indonesia’s Foreign Policy Talks. We acknowledge Noto Suoneto for his helpful review and feedback, which strengthened the analysis and findings of this report. We thank the seven Indonesian experts from media, think tanks, government, civil society, and academia who graciously shared their insights via background interviews. This research was made possible with generous support from the United States Department of State. The findings and conclusions of this report are those of the authors alone and do not necessarily reflect the views of our funders and partners.
Citation
Custer, S., Burgess, B., Kim, H.K., Krisnadi, M.F., Marshall, K., Mathew, D., Patrick, F., Saputra, A.D., Solis, J.A., and N. Sritharan. (2025). Balancing Risk and Reward: Who benefits from China’s investments in Indonesia?. Williamsburg, VA: AidData at William & Mary.
1.1 Indonesia-China relations: An evolving story
1.2 Tracking Beijing’s economic statecraft in Indonesia
2.1 How has the PRC’s development finance changed over time and relative to the alternatives?
2.1.1 How does Beijing compare with other development partners?
2.1.1.1 Comparing the terms of Beijing’s assistance relative to others
2.1.1.2 Comparing Beijing’s assistance trajectory relative to others
2.1.1.3 Comparing Beijing’s sectoral focus relative to others
2.1.2 How do flows of Chinese development finance vary across ASEAN?
2.2 How has Beijing’s financing varied across administrations?
2.2.1 Abdurrahman Wahid (1999-2001)
2.2.2 Megawati Soekarnoputri (2001-2004)
2.2.3 Susilo Bambang Yudhoyono (2004-2014)
2.3 In which communities is China investing—and why?
3.1 Supply side: Who finances and implements PRC-backed development projects?
3.1.1 Views of Chinese implementers in Indonesia
3.2 Demand side: Who are the primary recipients of PRC investment projects in Indonesia?
3.2.1 Which firms and agencies have the greatest exposure to Beijing?
4.1.1 From commitments to delivery: How fast does the money move?
4.1.2 Failure to deliver? Project suspensions and cancellations
4.2.1 Early warning indicators of ESG risk in PRC-financed projects
4.2.2 Exposure to performance risk in Chinese-financed projects
4.3.1 Winning hearts and minds? Perceptions and financing
4.3.2 Public good or public harm? Outcomes of Chinese financing
4.3.2.1 PRC financing and Indonesian economic outcomes
4.3.2.2 PRC financing and Indonesian environmental outcomes
4.3.2.3 PRC financing and Indonesian social and governance outcomes
5.1 Revealed priorities: What projects, when, and where?
5.2 Influence networks: Which players, what roles, and why?
5.3 Weighing trade-offs: Follow-through, costs, and benefits?
Figure 2.2: Total official finance commitments from China to Indonesia, 2000-2023
Table 2.4: Top 10 sectors of PRC-funded development projects in Indonesia, 2000-2023
Table 2.6: Total PRC development finance commitments to ASEAN countries, 2000-2021
Figure 2.7: PRC-funded development projects in Indonesia, 2000-2023
Box 1. Surabaya–Madura (Suramadu) Bridge
Box 2. The Jakarta–Bandung High-Speed Railway (HSR)
Box 3. The Indonesia Morowali Industrial Park (IMIP) and nickel production
Figure 2.9: Chinese-funded development projects in Indonesia by province, 2000-2023
Table 2.10: Official PRC projects in Indonesia by province, 2000-2023
Figure 2.11: Inbound Chinese and global FDI to Indonesia, 2010-2024
Table 2.12: Inbound Chinese and global FDI to Indonesia, 2010-2024
Figure 2.13: Inbound Chinese FDI as a share of total FDI in Indonesia, 2010-2024
Map 2.14: Chinese inbound FDI in Indonesia by region, 2010-2024
Table 2.15: Chinese inbound FDI in Indonesia by region, 2010-2024
Box 4. Exploiting synergies between development finance and Chinese FDI in Sumatra
Table 2.16: Selected sectors, inbound Chinese and global FDI in Indonesia, 2010-2024
Table 3.2: Top 10 financiers of Chinese-funded development projects in Indonesia, 2000-2023
Figure 3.3: Top Chinese financiers and their recipients in Indonesia, 2000-2023
Table 3.4: Top 15 co-financiers of Chinese-funded development projects in Indonesia, 2000-2023
Table 3.5: Top nine implementers of Chinese-funded development projects in Indonesia, 2000-2023
Figure 3.9: Indonesian recipients of Chinese funding by sector, 2000-2023
Table 3.10: Recipients of Chinese-funded development projects in Indonesia, 2000-2023
Table 3.12: Top 15 recipients of Chinese funding in Indonesia by dollar value, 2000-2023
Table 4.1: Average time between stages of PRC-funded development projects in Indonesia, 2000-2022
Table 4.5: PRC-funded development projects in Indonesia with newly identified ESG risks, 2000-2021
Table 4.6: ESG risks in PRC-funded development projects in Indonesia by sector, 2000-2021
Table 4.7: Performance risk and Chinese implementers of development projects in Indonesia, 2000-2023
Table 4.8: Top 10 PRC higher-risk implementers by project count and value, 2000-2023
Table 4.9: Top Chinese financiers of Indonesian development projects and performance risk, 2000-2022
Table 4.12: Chinese development finance, Chinese FDI, and economic outcomes in Indonesia, 2005-2023
Figure 4.14: Vegetation trends in Central Sulawesi, 2010-2020
Figure 4.16: Indonesian attitudes towards democracy and the country’s democracy rating, 2000-2023
Executive Summary
Chinese money has gone from a footnote to a headline in Indonesia’s growth trajectory since the early 2000s. Government agencies, state-owned enterprises, and private companies from China have invested large sums in Indonesia’s roads, power plants, and nickel factories. These financial infusions are erratic: big booms one year, sudden lulls the next. This report assesses the money, relationships, and outcomes from roughly two decades of PRC state-directed development finance and private foreign direct investment.
Money: What projects does the PRC finance, where, when—and why?
Beijing bankrolls ambitious, risky projects in Indonesia’s energy, transport, and extractives sectors that have the potential to generate commercial returns and advance BRI aspirations, while responding to domestic political priorities. The PRC pairs these investments with small-dollar goodwill projects in the social sectors. It deploys state resources strategically (US$69.6 billion in official finance from 2000 to 2023), constructing infrastructure and cultivating goodwill to crowd in market opportunities for Chinese FDI (US$94.1 billion from 2010 to 2024). Inbound investment from Chinese companies has outsized importance, representing one-quarter of new foreign capital expenditures.
As Indonesia’s largest supplier of development finance, Beijing operates more like a commercial lender than a traditional donor, issuing 90 percent of its financing as debt rather than aid. Among its ASEAN peers, Indonesia attracts more of both types of Chinese capital. Regions like Java and Sumatra capture the lion’s share of Beijing’s development finance in absolute terms, but resource-rich West Papua and Central Sulawesi stand out for attracting noticeably more of Beijing’s per capita spending.
Relationships: How many players, who are they, and what roles do they play?
Beijing’s development finance projects in Indonesia are not just made-in-China; they draw upon a global enterprise of 439 discrete entities from 35 countries. Fifty-eight Chinese state-owned policy and commercial banks, government agencies, and diplomatic missions were the primary financiers. These players relied on a multinational pool of 208 co-financiers across Asia, Europe, and North America to raise capital and distribute risk. Chinese state-owned enterprises (SOEs), 14 of whom were sanctioned for questionable financial practices, were the majority but not the totality of Beijing’s 213 implementers.
Just under half of the implementers of PRC projects were Indonesian, including stand-alone firms and participants in joint ventures and special purpose vehicles. Social sector projects capitalize on the credibility and distribution networks of Islamic organizations and universities in Indonesia to win hearts and minds. Six entities received large and frequent infusions of PRC financing, including the Government of Indonesia, Perusahaan Listrik Negara, Lembaga Pembiayaan Ekspor Indonesia, Bank Rakyat Indonesia, Garuda Indonesia, and two telecom companies, Smartel and Smartfren (subsidiaries of the Sinar Mas Group, recently merged with XL Axiata). Indonesian state-owned enterprises were often recipients of funding, but so too were powerful private sector conglomerates like the Bakrie Group (Bumi Resources, Bakrie Telecom, and Bakrie Autoparts) and subsidiaries of Chairul Tanjung’s CT Corp (Trans Retail Indonesia and Trans Media Corpora).
Outcomes: How does Beijing follow through and manage risk, and to what effect?
PRC-financed projects across Indonesia take an average of 2.5 years to move from funds committed to projects delivered, considerably slower than in ASEAN peers like the Philippines. Energy and transport projects are among the riskiest propositions: these activities trigger longer delivery delays (1,000+ days) and greater exposure to environmental and social risks. The choice of implementer is non-trivial, affecting project success and community well-being. Unfortunately, over 40 percent of Beijing’s development finance portfolio (US$30 billion) relied on risky implementers with higher levels of ESG exposure or prior sanctions for questionable business practices. Risky firms were often repeat implementers.
Beijing faces an uphill battle in converting money into reputational gains. Public approval of PRC leadership has soured in Indonesia as economic engagement with China increased. Public, private, and civil society elites attest to Beijing’s influence on domestic development priorities, but have grown more wary of this trend. The potential contribution of Chinese capital to Indonesia’s development has mixed results. Economically, provinces exposed to more Chinese FDI tended to have higher productivity, and those with more of Beijing’s development finance dollars had lower levels of unemployment. Worsening pollution and vegetation levels were not systematically linked to Chinese capital overall, but Indonesia’s Morowali Industrial Park showcases catastrophic impacts in individual projects. Finally, Indonesians may be redefining what it means for democracy to deliver: emphasizing economic development over political rights in ways that are conducive to Beijing’s preferred narratives and value proposition.
1. Introduction
Indonesia’s rapidly growing economy, abundant natural resources, and youthful population make it a sought-after economic partner (ITA, 2023; UNDP, 2024). Geostrategically located next to key maritime trade routes, Indonesia straddles the Strait of Malacca’s western coast (China Power, 2017). Recognizing this, the People’s Republic of China (PRC) has deployed its economic statecraft—trade, aid, and foreign direct investment (FDI)—to position itself as a go-to supplier of capital to fuel Indonesia’s growth. New deals are launched with great fanfare, but with limited details and ample controversy.
Without transparent and credible information about what Beijing is investing in, where, and to what effect, it is difficult for the Indonesian public and its leaders to assess the merits and drawbacks accurately. These information asymmetries can increase vulnerability to deceptive messaging about the cost-benefit trade-offs of these partnerships. This is a timely moment to take stock of the trajectory of economic engagement between the two countries, as Indonesian President Prabowo Subianto, who assumed office in October 2024, shapes his foreign policy priorities.
In this report, Balancing Risk and Reward: Who benefits from China’s investments in Indonesia?, we meticulously piece together data from multiple sources to assess the money, relationships, and outcomes from two decades of PRC state-directed development finance and private foreign direct investment (2000-2023). This research was produced by AidData, a U.S.-based research lab at William & Mary’s Global Research Institute, in partnership with Foreign Policy Talks. This respected Indonesian organization is a cross-border platform to facilitate knowledge exchange and discourse among foreign policy thinkers and practitioners.
Drawing upon historical financial analysis, desk research, and interviews with Indonesian experts, this report aims to answer three critical questions:
- Money: What projects does the PRC finance, where, and when, via its state-directed development finance and private sector FDI in Indonesia?
- Relationships: How many players are involved in these projects, who are they, what roles do they play, and are some more important than others?
- Outcomes: To what extent does Beijing follow through on commitments, how does it manage risk, and what are the downstream outcomes?
1.1 Indonesia-China relations: An evolving story
Indonesia-China relations have not always been smooth. Seventeen years after establishing diplomatic relations with the PRC, Jakarta dramatically severed ties in 1967. It alleged Beijing’s involvement in backing an attempted coup by the Indonesian Communist Party. The coup was unsuccessful, and PRC involvement was later found to be limited (Zhou, 2019); however, the episode resulted in the fall of Indonesian President Sukarno and triggered a presidential transition. It would take more than two decades of diplomatic limbo before the two countries resumed relations in 1990.
In the intervening period, the PRC under Deng Xiaoping made a strategic pivot in its foreign policy, pursuing economic liberalization and stabilization to attract international capital and abandoning support for overseas Communist movements (Visscher, 1993). By the 1990s, these reforms helped to normalize relations with Indonesia and spurred the PRC’s rapid industrialization, export-led growth, and accession to the World Trade Organization. These changes helped to position Beijing as a credible partner when Indonesia sought to rebuild its economy following the 1997 Asian Financial Crisis.
Over the last three decades, Chinese and Indonesian leaders and cabinet officials have made numerous high-level visits to rebuild relations. By 2005, Indonesia and China elevated bilateral relations to a “strategic partnership,” later upgraded to a “Comprehensive Strategic Partnership” in 2013.[1] Indonesia joined the ASEAN[2]-China Free Trade Area in 2010, became a founding member of the Asian Infrastructure Investment Bank (AIIB)[3] in 2015, and officially joined the PRC’s Belt and Road Initiative (BRI) in 2017.
Even as Indonesian leaders pursue closer economic ties with Beijing, their enthusiasm is tempered by maritime disputes in the Natuna Sea (Nabbs-Keller, 2020; Asia Maritime Transparency Initiative, 2024). Jakarta and Beijing have “overlapping claims” to the continental shelf and exclusive economic zone off the coast of Natuna Island (Darmawan, 2020 and 2024). Indonesia has reinforced its military presence in the Natuna Sea and lodged diplomatic protests (Nabbs-Keller, 2020). This initially firm stance was diluted when President Subianto and Chinese President Xi Jinping announced in November 2024 that the two countries would jointly develop the contested areas (Darmawan, 2024).
Economic and political elites, meanwhile, express concerns over competition from cheaper or lower quality Chinese goods[4] and overdependence on Chinese investment in strategic sectors such as nickel (Nabbs-Keller 2020; Sritharan and Rizkallah 2024). Over the last five years, leveraging Chinese investment and technology, Indonesia has positioned itself as a dominant power in nickel production, accounting for 63 percent of the world’s supply (Forbes, 2025). However, there is growing unease over the fact that China effectively controls three-quarters of Indonesia’s smelting operations (Reuters, 2025), critical to the production of stainless steel and electric vehicle (EV) batteries.[5]
President Subianto’s early state visits and speeches signal that the administration wants to double down on economic and security cooperation with China (Liu and Rayi 2024; Secretariat Cabinet of Indonesia, 2025).[6] However, Subianto is actively cultivating relationships with alternative players—from Russia and the United States to the Middle East and Turkey (King, 2025). Following his first trip to China, Subianto visited Washington, wanting to cooperate with both major powers (Reuters 2024).
1.2 Tracking Beijing’s economic statecraft in Indonesia
For thirteen consecutive years, the PRC has been Indonesia’s largest trading partner, a top destination for the archipelago’s exports, and a leading source of imported goods.[7] From a modest start of only US$1.18 billion in 1990, trade between the two countries surged to US$135 billion by 2024 (Chinese Embassy, 2004; Minister of Trade of Indonesia, 2025).
From 2000 to 2023, Indonesia attracted approximately US$69.6 billion in financing from the PRC for over 400 development projects. Following the 2008 global financial crisis, Beijing emerged as one of the leading sources of development finance to Indonesia.[8] These projects vary widely in size and scope, ranging from small-scale social initiatives and goodwill programs, such as support for schools and civil society organizations, to large-scale infrastructure ventures aimed at developing and capitalizing on Indonesia’s substantial nickel reserves.
Beyond trade and aid, China has become a go-to investment source for Indonesia in recent years. The Indonesian Statistics Agency (2025) reported US$8.1 billion in Chinese FDI across 21,464 projects in 2024 alone.[9] Over the past decade, China has invested a total of US$45 billion through 43,702 projects, primarily focused on critical physical and digital infrastructure sectors (e.g., energy, mining, construction, transportation, telecommunications).[10]
In Chapter 2, we follow the money to spotlight Beijing’s revealed priorities in what projects it finances, when, and where in Indonesia. We examine the PRC’s state-directed development finance to Indonesia across grants, loans, debt instruments, and technical assistance to public and private sector actors. This includes Official Development Assistance (ODA)—grants and concessional loans referred to as “aid”—and Other Official Flows (OOF), non-concessional loans and export credits referred to as “debt.” Second, we look at Chinese FDI, where PRC-based firms acquire at least a 10 percent equity stake in Indonesian enterprises, reflecting longer-term commercial interest and operational control.
We draw upon three primary sources for this analysis: (i) AidData’s Global Chinese Development Finance Dataset, Version 3.0, a project-level database of Chinese state-directed aid and debt financing from 2000 to 2021; (ii) supplemental desk research to identify provisional or announced projects post-2021; and (iii) inbound Chinese FDI data from the fDi Markets platform, a cross-border investment database maintained by Financial Times, Ltd, for 2010 to 2024.
Chapter 3 scrutinizes the relationships behind Beijing’s development finance investments: how many players there are, who they are, their roles, and whether some are more important than others. We analyze the supply side of these transactions to trace intricate cross-border networks of financiers, co-financiers, and implementers that bankroll and deliver PRC-financed development in Indonesia. Then, we assess the demand side: which communities, agencies, and organizations receive more and less of these investments, and why?
Without clear and compelling evidence, Indonesian policymakers, journalists, and the public are left in the dark about the long-term costs and benefits of partnering with opaque foreign state investors like the PRC. Chapter 4 assesses Beijing’s performance: to what extent does it follow through on its promised commitments, how does it manage the risk of public harm from its projects, and what early indications do we see of the downstream outcomes across societies?
This analysis draws upon a variety of third-party surveys and subnational data on economic, environmental, social, and governance indicators from reputable sources, including the Gallup World Poll, Varieties of Democracy, the World Bank, Indonesia’s Statistical Agency (BPS), and Asian Barometer, among others. We also incorporate insights from expert interviews conducted virtually by AidData and Foreign Policy Talks.[11]
Chapter 5 concludes with key takeaways arising from this research. A supplemental Technical Appendix provides additional information about the methods, assumptions, and data sources used in this research.
2. Money
Key insights in this chapter:
- Beijing employs a two-track model in Indonesia—it offsets a few risky, hard infrastructure big bets with many small-dollar social development projects
- Indonesia stands out from its Southeast Asian peers, attracting comparatively larger shares of Chinese development finance and foreign direct investment
- PRC-financed projects in energy, transport, and critical mineral processing sought commercial returns, blended public and private sector dollars, and aimed to advance BRI aspirations while responding to domestic political priorities
Over two decades, Chinese money has gone from a footnote to a headline in Indonesia’s economic growth trajectory. Government agencies, state-owned enterprises, and private companies from China have invested large sums in Indonesia’s roads, power plants, and factories. These financial infusions are erratic: big booms one year, sudden lulls the next. This chapter follows the money to uncover what Beijing’s state-directed development finance and private sector foreign direct investment reveal about the PRC’s strategic priorities.
In the remainder of this chapter, we analyze how the PRC’s engagement in Indonesia varies over time, relative to other donors and ASEAN peers (Section 2.1) and across five presidential administrations (Section 2.2). We investigate which regions and communities attract the most Chinese investment (Section 2.3) and how inbound Chinese FDI diverges or converges with Beijing’s state-directed development finance in sector and geography (Section 2.4).
2.1 How has the PRC’s development finance changed over time and relative to the alternatives?
Chinese development finance to Indonesia has expanded significantly over the past two decades, but its trajectory has not followed a straight line. Financial commitments have risen and fallen sharply across key political and economic junctures between the two countries, along with global uncertainties. This raises three questions worth exploring. How does Beijing’s development finance offer compare with the alternatives available to Indonesia? To what extent is Beijing’s economic engagement in Indonesia similar or unique to that observed in other ASEAN countries? And to what extent have Indonesia’s domestic policies and regulatory choices shaped—or constrained—the PRC development financing it receives? We consider each question in turn in the rest of this section.
2.1.1 How does Beijing compare with other development partners?
To contextualize its role relative to others, we benchmarked the PRC against six active development partners in Indonesia. This included the Asian Development Bank (ADB), the World Bank (WB), Australia, Japan, South Korea, and the United States (U.S.). Each of the six comparators reports its development finance by country, sector, flow type, and year to the Organization for Economic Cooperation and Development (OECD) Creditor Reporting System (CRS). Our analysis considers Official Development Assistance (i.e., grants and no- or low-interest loans, commonly referred to as “aid”) and Other Financial Flows (i.e., loans and export credits at market rates referred to as “debt”). We focus this discussion on commitments for comparability.
Between 2000 and 2023, Indonesia received an estimated US$69.6 billion in official development finance from the PRC, its largest bilateral financier (see Table 2.1). Beijing outspent the combined contributions of the four bilaterals:[12] Japan (US$29.3 billion), South Korea (US$15.7 billion), Australia (US$10.3 billion), and the United States (US$7.97 billion). The PRC’s development finance also eclipsed the two multilaterals: the WB (US$47.7 billion) and the ADB (US$36.6 billion).
2.1.1.1 Comparing the terms of Beijing’s assistance relative to others
Beijing operates less like a traditional aid donor and more like a commercial lender-developer. Over 90 percent of Beijing’s development finance is issued as debt (e.g., non-concessional loans and export credits), while only 3 percent is given as concessional (no- or low-interest) loans and grants. Access to Beijing’s financing is often tied to using Chinese contractors, procurement chains, or co-financing arrangements with Chinese firms. Moreover, the profile of Beijing’s assistance in Indonesia became less generous over the last two decades. Its portfolio is increasingly focused on commercially-oriented projects featuring loans to Indonesian businesses or special purpose vehicles (SPVs) (Gelpern et al., 2021).
Although it was also focused on infrastructure, Japan represents the opposite end of the generosity spectrum: 100 percent of its development finance was offered as grants or highly concessional loans.[13] Bilaterals like Australia and the U.S. also assisted Indonesia with highly concessional loans and grants, but they focused on social sector programs such as governance, education, and health. It is important to note that this analysis predates moves that the U.S. and several European donors have made to reduce aid budgets in 2024 and 2025 (Custer et al., 2025a and 2025b).
South Korea was more similar to the PRC in its prioritizing of commercially-tied loans for bankable projects (albeit at a smaller scale) over concessional finance in the social sector. It blends technical assistance from the Korea International Cooperation Agency with tied loans from the Economic Development Cooperation Fund, which supports Korean firms. The volume of South Korea’s assistance to Indonesia is modest, at half the size of Japan’s and less than a quarter of the PRC’s commitments. Its highest profile project was the Karian Serpong Water Supply Project (Susanty, 2017).
Indonesia’s middle-income status means that multilateral development banks like the ADB and WB tend to offer loan terms comparable to market rates, rather than the heavily discounted rates offered to other low-income countries. For example, a 331.3 million euro loan from ADB for programming in the health sector had a 12.5-year maturity and a seven-year grace period (ADB, 2023).[14] In the context of emergency response, multilaterals may use more generous terms. WB and ADB assistance in the wake of the 2018 Sulawesi earthquake and tsunami is a case in point: the two donors pledged US$1 billion with an extended repayment period (32 years) and slightly longer grace period (8 years) (Tang, 2018).
Comparatively, Beijing’s debt terms have been less generous on average than similar lending from the multilateral development banks. For projects where full loan details were available,[15] the average Chinese loan to Indonesia during this period carried an 8.6-year maturity and a 3.6-year grace period. There are exceptions to this rule, particularly in the context of competition with other development finance suppliers. Notably, PRC financing for the Jakarta–Bandung High Speed Rail Project featured more attractive terms than usual in response to a bidding war with Japan.[16] For that project, Beijing extended US$4.5 billion in loans at a 2 percent interest rate, with a 40-year maturity and 10-year grace period (Custer et al., 2023; Dreher et al., 2022). The project used a business-to-business scheme with a 50-year concession to operate the rail. This was later extended to 80 years due to cost overruns (Mahardhika and Wibawa, 2023).
Table 2.1: Total official finance commitments from major development partners to Indonesia, 2000-2023
The table can be sorted by clicking on a column. On small screens, scroll horizontally to view hidden columns.
|
Development partner |
Official Development Assistance (ODA) |
Other Official Flows (OOF) |
Vague (level of concessionality undetermined) |
|---|---|---|---|
|
China (Total: $69.6B; ODA 3%) |
2.08 |
64.93 |
2.61 |
|
Asian Development Bank (Total: $36.6B; ODA 4%) |
1.29 |
35.36 |
N/A |
|
Australia (Total: $10.3B; ODA 97%) |
10.03 |
0.27 |
N/A |
|
Japan (Total: $29.3B; ODA: 100%) |
29.34 |
0.00 |
N/A |
|
South Korea (Total: $15.7B; ODA: 14%) |
2.18 |
13.51 |
N/A |
|
United States (Total: $7.97B; ODA: 100%) |
7.97 |
0.01 |
N/A |
|
World Bank (Total: $47.7B; ODA: 0%) |
0.00 |
47.66 |
N/A |
Notes: All figures in billions of constant 2024 USD. The research team supplemented PRC finance data with limited desk research and media article reviews to identify additional projects and details for 2022 and 2023. Data for these additional years should be considered provisional. Sources: OECD CRS Database, 2000-2023 and AidData’s Global Chinese Development Finance Dataset, Version 3.0 for 2000-2021 (Custer et al., 2023; Dreher et al., 2022).
2.1.1.2 Comparing Beijing’s assistance trajectory relative to others
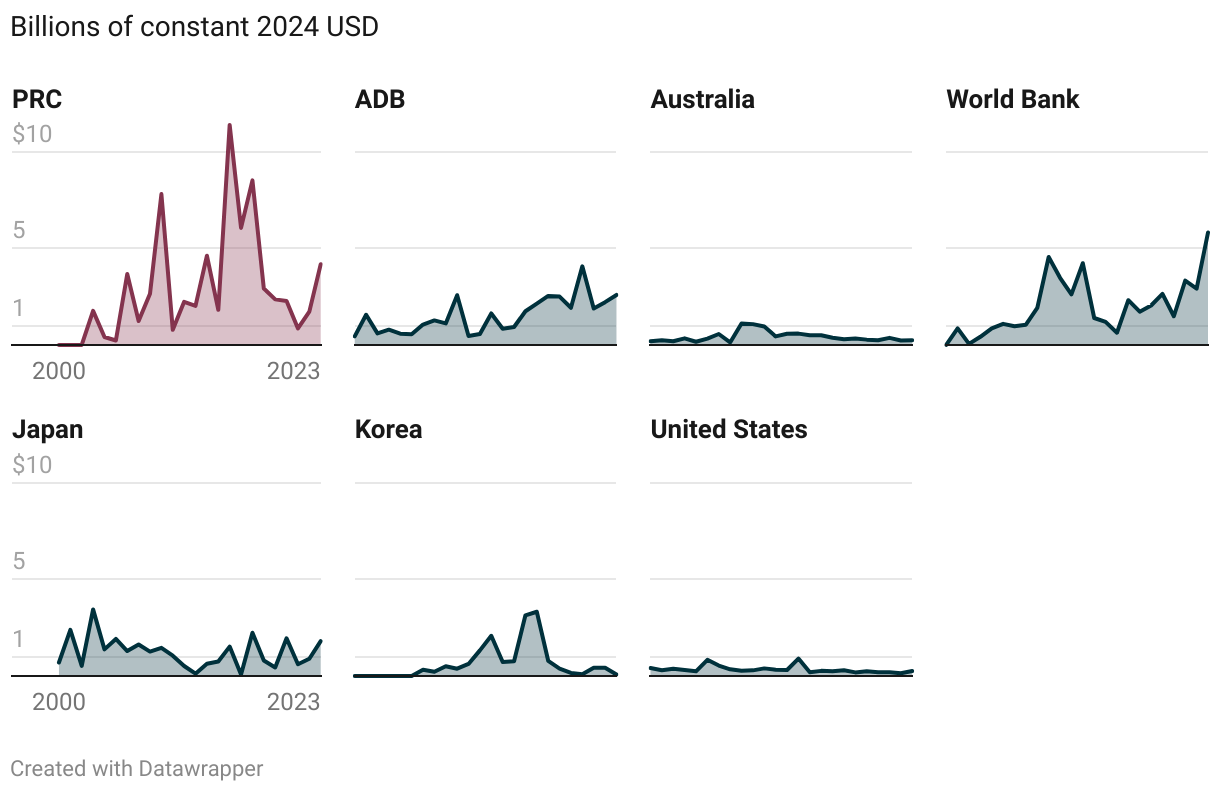
Beijing was not always as dominant a player in Indonesia’s development (see Figure 2.3). Before the 2008 global financial crisis, the PRC’s financing (US$7.3 billion) was on par with multilaterals like the ADB (US$6.9 billion) and the WB (US$5.3 billion) in commitments between 2000 and 2007. All three players were far surpassed by Indonesia’s lead development partner for most of these early years: Japan, which committed US$13.3 billion (Figure 2.3). Two early exceptions to this rule were in 2003 and 2006, when Chinese development finance temporarily surged, positioning Beijing as Indonesia’s largest donor in those years.
This status quo changed dramatically after 2008, as the PRC jumped ahead of the pack to become Indonesia’s single largest development finance supplier from 2011 to 2018. During the COVID-19 pandemic,[17] China’s development finance dropped off significantly, consistent with global trends in its lending. Multilateral development banks such as the World Bank and the Asian Development Bank assumed a more prominent role, allocating hundreds of millions in funding for health infrastructure strengthening (Figure 2.3).
As of 2023, Beijing’s development finance to Indonesia appeared to be on the upswing, based on a preliminary review of announced projects. The PRC announced an estimated US$4.2 billion of financing across 18 energy and industrial projects.[18] However, it remains to be seen whether Beijing will follow through on these plans. Notably, PowerChina’s initial announcement of its intention to fund the US$17.8 billion Kayan Cascade project turned out to be more hype than substance, as it subsequently withdrew from the project (Koswaraputra, 2024).[19]
Figure 2.2: Total official finance commitments from China to Indonesia, 2000-2023

Notes: All figures in billions of constant 2024 USD. The research team supplemented PRC finance data with limited desk research and media article reviews to identify additional projects and details for 2022 and 2023. Data for these additional years should be considered provisional. Sources: AidData’s Global Chinese Development Finance Dataset, Version 3.0 for 2000-2021 (Custer et al., 2023; Dreher et al., 2022)
Figure 2.3: Official finance commitments by year from major development partners to Indonesia, 2000-2023
Notes: The research team supplemented PRC finance data with limited desk research and media article reviews to identify additional projects and details for 2022 and 2023. Data for these additional years should be considered provisional. Sources: OECD CRS Database, 2000-2023 and AidData’s Global Chinese Development Finance Dataset, Version 3.0 for 2000-2021 (Custer et al., 2023; Dreher et al., 2022).
2.1.1.3 Comparing Beijing’s sectoral focus relative to others
Beijing’s development finance to Indonesia has consistently prioritized securing natural resources, expanding industrial capacity, and promoting physical and digital connectivity. Energy investments (US$20.12 billion, 56 projects) initially emphasized coal-fired power generation, later extending to hydropower. Industry, mining, and construction activities (US$17.44 billion, 65 projects) sought to reduce barriers to entry for Chinese companies to invest in Indonesia’s Special Economic Zones. Transport and storage was also a top sector, attracting US$9.38 billion across 37 projects, from high-speed rail to toll roads. Together, these three sectors alone account for over 70 percent of Beijing’s development finance dollars to Indonesia between 2000 and 2023 (Table 2.4).[20]
Table 2.4: Top 10 sectors of PRC-funded development projects in Indonesia, 2000-2023
By millions of USD |
By number of projects |
|||
Energy |
$20,122 |
Industry, mining, construction |
65 |
|
|
Industry, mining, construction |
$17,441 |
Energy |
56 |
|
|
Transport and storage |
$9,378 |
Emergency response |
47 |
|
Other multisector |
$5,837 |
Business and other services |
42 |
|
Communications |
$4,314 |
Transport and storage |
37 |
|
|
Unallocated / unspecified |
$1,888 |
Unallocated / unspecified |
32 |
|
|
Business and other services |
$1,614 |
Education |
28 |
|
|
Banking and financial services |
$1,029 |
Communications |
21 |
|
|
Agriculture, forestry, fishing |
$615 |
Health |
20 |
|
|
Trade policies and regulations |
$590 |
Action relating to debt |
16 |
Notes: This table shows the top 10 sectors of PRC-funded development projects from 2000 to 2023 (including aid and debt instruments) in millions of constant 2024 USD (left) and number of projects (right). The research team supplemented PRC finance data with limited desk research and media article reviews to identify additional projects and details for 2022 and 2023. Data for these additional years should be considered provisional. “Unallocated/unspecified” indicates insufficient detail to assign a sector to the project. Sources: AidData’s Global Chinese Development Finance Dataset, Version 3.0 for 2000-2021 (Custer et al., 2023; Dreher et al., 2022).
Globally, the PRC employs a two-track development model pairing big-ticket infrastructure investments with the expectation of commercial returns alongside small-dollar goodwill projects for reputational gains (Custer et al., 2025). This pattern is also evident in Beijing’s development finance in Indonesia. The Chinese government sent money, food, search and rescue support, and medical teams to aid Indonesia in response to natural disasters. This category of emergency response accounted for the third largest number of projects, though this was heavily concentrated around the December 2004 earthquake and subsequent tsunami.[21] Although it typically allocates fewer dollars than other development partners in these areas, Beijing also financed social sector activities in education (28 projects) and health (20 projects).
Beijing’s development finance is often associated with the idea of infrastructure, given the prominence of the Belt and Road Initiative. However, there are various facets of infrastructure relevant to a country’s growth and prosperity. In this report, we examine the extent to which Beijing (as compared to other development partners) helps Indonesia develop infrastructure in several areas:
- Economic and information infrastructure (i.e., banking and financial services; business services; telecommunications; economic infrastructure and services)
- Physical connectivity infrastructure (i.e., trade policies and regulations; transport and storage)
- Utilities, foods, and power infrastructure (i.e., agriculture, forestry, fishing; energy; industry, mining, construction; production sectors; water supply and sanitation)
- Social and environmental infrastructure (i.e., education; environmental protection; government and civil society; health; social infrastructure and services; population policies/programs; and reproductive health)
South Korea (92 percent), the PRC (76 percent), and Japan (56 percent) share a revealed preference in orienting most of their development finance dollars to hard infrastructure (e.g., physical connectivity; utilities, food and power). By contrast, Australia and the U.S. were much less active in the hard infrastructure sectors, instead directing over half (58 percent each) of their development finance portfolios to supporting Indonesia’s building of social and environmental infrastructure.
Table 2.5: Total official finance commitments from major development partners to Indonesia by sector, 2000-2023
The table can be sorted by clicking on a column. On small screens, scroll horizontally to view hidden columns.
|
Sector |
PRC |
Asian Development Bank |
Australia |
World Bank |
Japan |
South Korea |
United States |
|---|---|---|---|---|---|---|---|
|
Disaster risk reduction, emergency response |
0.08 |
0.00 |
0.36 |
0.28 |
0.61 |
0.02 |
1.42 |
|
Economic and information infrastructure |
6.96 |
5.68 |
0.12 |
6.65 |
0.08 |
0.55 |
0.15 |
|
Physical connectivity infrastructure |
9.97 |
1.75 |
0.79 |
3.31 |
7.81 |
1.92 |
0.15 |
|
Social and environmental infrastructure |
0.43 |
14.53 |
5.95 |
23.71 |
2.72 |
0.64 |
4.60 |
|
Utilities, food, and power infrastructure |
42.88 |
10.98 |
1.08 |
8.92 |
8.58 |
12.44 |
0.51 |
|
Other |
9.30 |
3.71 |
2.00 |
4.79 |
9.54 |
0.11 |
1.13 |
Notes: Commitments are denominated in billions of constant 2024 USD. Darker colors indicate higher volumes of financing from a particular donor in a given sector. The research team supplemented PRC finance data with limited desk research and media article reviews to identify additional projects and details for 2022 and 2023. Data for these additional years should be considered provisional. Sources: OECD CRS Database 2000-2023 and AidData’s Global Chinese Development Finance Dataset, Version 3.0 for 2000-2021 (Custer et al., 2023; Dreher et al., 2022).
Unsurprisingly, the U.S., historically the largest single supplier of humanitarian assistance globally (Custer et al., 2025), channeled a greater share of its portfolio (18 percent) to risk reduction and emergency response funds than other donors.
The two multilateral development banks fell somewhere in between. Hard infrastructure projects still accounted for a quarter to one-third of World Bank (WB) and Asian Development Bank (ADB) financing in Indonesia. Moreover, both institutions shared a common interest with the PRC in bankrolling projects in the economic and information space. That said, the WB (50 percent) and ADB (40 percent) were bigger players than the PRC in supporting Indonesia’s development of social and environmental infrastructure. The WB, for instance, committed US$23.71 billion to social and environmental infrastructure in Indonesia between 2002 and 2023, roughly 54 times China’s contribution, which amounted to US$430 million in the same sector.
As part of the COVID-19 rescue package, the Asian Infrastructure Investment Bank (AIIB) provided a US$1.5 billion loan to Indonesia.[22] The project was co-financed with the ADB and the WB as part of a broader COVID-19 support initiative. In total from 2020 to 2024, Indonesia received more than US$4.19 billion from AIIB, which was dispersed across varying sectors from energy, healthcare, to satellite communications.[23]
2.1.2 How do flows of Chinese development finance vary across ASEAN?
Among its ASEAN neighbors, Indonesia stands out as the top recipient of Beijing’s development finance dollars between 2000 and 2021. Beijing’s global interest in using development finance to open up new markets for Chinese firms likely informs its interest in Indonesia, Southeast Asia’s largest economy and an important hub for regional connectivity. The sectoral composition of Chinese development finance in the country’s transport, energy, and extractives sectors aligns with the PRC’s interests in securing energy and mineral resources. These areas also mirror Indonesia’s domestic development priorities.
Indonesia is the PRC’s flagship partner in advancing Beijing’s regional infrastructure ambitions under the BRI. The Jakarta–Bandung High-Speed Rail is ASEAN’s largest BRI project. Indonesia also hosts other PRC-backed projects in digital networks, ports, and extractives, as part of Beijing’s Digital Silk Road push to expand data infrastructure and e-commerce platforms across ASEAN (Rakhmat, 2022). These efforts are backed by financial instruments such as concessional and commercial loans from China Development Bank and China Eximbank.
More broadly, variation in the PRC’s development finance portfolio across the ASEAN region is likely shaped by a combination of factors. On the demand side, a country’s national development priorities and regulatory frameworks may make working with Beijing more or less attractive across ASEAN members. On the supply side, Beijing also considers the degree to which a prospective recipient is geostrategically important and diplomatically aligned with the PRC in its development finance allocations.
In mainland Southeast Asia, Laos (US$23.8 billion, 306 projects) and Cambodia (US$19.8 billion, 369 projects) are other prominent recipients of PRC development finance over two decades. Despite their smaller economies, both countries have maintained close political ties with Beijing and have been enthusiastic participants in the BRI framework. Their infrastructure portfolios include large-scale transport corridors, power generation, and hydropower assets, often financed through loans from Chinese state policy banks. These flows, while substantial, typically involve limited policy conditionality, distinguishing them from multilateral development financing alternatives.
Vietnam (US$32.4 billion, 178 projects) and Malaysia (US$17.9 billion, 162 projects) have taken a more selective and cautious approach to PRC development finance. Both countries have leveraged Chinese capital to finance strategic projects but have prioritized regulatory due diligence, often renegotiating terms to ensure alignment with domestic political and fiscal priorities. Vietnam was the second-largest recipient of Chinese projects in value. However, it lags behind its Mekong region peers in project implementation, due partly to Hanoi’s skepticism of closer ties to Beijing (Ha, 2022). Vietnam’s historical tensions with the PRC and ongoing maritime disputes in the South China Sea have contributed to a more cautious investment posture, particularly in politically sensitive sectors. Malaysia has similarly restructured major BRI projects, such as the East Coast Rail Link.
Comparatively, the Philippines and Thailand have received lower volumes of Chinese development finance: US$9.1 billion across 219 projects and US$5.8 billion over 99 projects, respectively. In the case of the Philippines, shifts in political leadership and foreign policy alignment have had a measurable effect on investment flows (Custer et al., 2024). Under President Rodrigo Duterte, closer diplomatic ties with Beijing led to an uptick in project approvals, though many remained slow to disburse (ibid). Thailand, a relatively mature middle-income economy with diversified investment sources, has maintained a more conservative portfolio of PRC-financed projects, supplementing rather than depending on Chinese capital.
Table 2.6: Total PRC development finance commitments to ASEAN countries, 2000-2021
Country |
Commitments (2024 USD) |
Project count |
|---|---|---|
Indonesia |
$61.7 billion |
400 |
Vietnam |
$32.4 billion |
178 |
Laos |
$23.8 billion |
306 |
Cambodia |
$19.8 billion |
369 |
Malaysia |
$17.9 billion |
162 |
Myanmar |
$16.3 billion |
444 |
Philippines |
$9.1 billion |
219 |
Thailand |
$5.8 billion |
99 |
Brunei Darussalam |
$2.4 billion |
51 |
Notes: Comparable Chinese development finance data is only available across countries through 2021, so the total value of PRC commitments to Indonesia is lower here than in the rest of the report, which covers through 2023. Source: AidData's Global Chinese Development Finance Dataset, Version 3.0.
2.2 How has Beijing’s financing varied across administrations?
Beijing’s development financing to Indonesia has demonstrated distinct peaks and troughs across different presidential administrations—a gradual rise under Megawati Soekarnoputri (2000-2004), more erratic ups and downs during the tenure of Susilo Bambang Yudhoyono (2004-2014), and record-breaking highs under Joko Widodo’s first term (2014-2019), before tapering off during and following the COVID-19 pandemic (2019-2024) (Figure 2.2). The number of projects has similarly fluctuated substantially within and between administrations (Figure 2.7).
Taken together, these patterns highlight that Beijing’s development financing in Indonesia has not followed a simple upward trajectory. There have been periods of strategic expansion, as Beijing opportunistically sought to respond to the priorities of Indonesian political leaders, followed by noticeable recalibrations. Surges in projects and dollars sometimes corresponded with major diplomatic events such as state visits or bilateral summits, but not always. Nor did the PRC’s investments predictably rise with Indonesia’s chairmanship of ASEAN in 2011 and its hosting of the 18th and 19th summits.
The decline in the volume of China’s state-directed financing to Indonesia between 2019 and 2022 mirrors global trends AidData has observed in PRC investments, as Beijing pivoted to emphasize emergency financing for BRI countries facing difficulty serving debt obligations (Parks et al., 2023). Project counts have not seen as sharp a drop as dollars, which implies that Beijing may be shifting more of its efforts towards “small but beautiful” goodwill activities, while encouraging more private sector engagement, including from Hong Kong (Yeung, 2024).[24] This downward trend could reflect growing caution within Indonesia toward PRC financing, shifting domestic political priorities, and broader global concerns over debt sustainability.
Figure 2.7: PRC-funded development projects in Indonesia, 2000-2023

Notes: The research team supplemented PRC finance data with limited desk research and media article reviews to identify additional projects and details for 2022 and 2023. Data for these additional years should be considered provisional. Sources: AidData’s Global Chinese Development Finance Dataset, Version 3.0 for 2000-2021 (Custer et al., 2023; Dreher et al., 2022).
Table 2.8: Major trends in PRC-funded development projects by presidential administration in Indonesia
Administration |
Trend |
Example projects |
|---|---|---|
|
Megawati Soekarnoputri (2001-2004) |
Energy and infrastructure projects |
Tangguh Liquified Natural Gas and Suramadu Bridge |
|
Susilo Bambang Yudhoyono, first term (2004-2009) |
Disaster relief and energy projects |
2004 Indian Ocean Tsunami and 10.000 MW Fast Track Program I |
|
Susilo Bambang Yudhoyono, second term (2009-2014) |
Diversification into critical industries, telecommunications, and private sector financing |
10.000 MW Fast Track Program II and Palapa Ring |
|
Joko Widodo, first term (2014-2019) |
Transport and infrastructure, energy, and state-owned enterprise financing |
Jakarta–Bandung High-Speed Rail |
|
Joko Widodo, second term (2019-2024) |
COVID-19 recovery and downstream-related industries and investments |
Morowali Industrial Park |
2.2.1 Abdurrahman Wahid (1999-2001)
Only a decade following the reestablishment of bilateral relations, Indonesian President Abdurrahman Wahid emphasized stability and reconciliation in his dealings with China. His administration laid the groundwork for normalizing Sino-Indonesian relations, removing restrictions for the Chinese-Indonesian community to observe religious, cultural, and linguistic traditions such as the Lunar New Year. He formally recognized Confucianism as an official religion and appointed Chinese-Indonesian economist Kwik Kian Gie as Coordinating Minister for the Economy, a meaningful gesture of inclusion. Direct economic engagement with Beijing was minimal, but Wahid’s policies created the conditions for more robust bilateral cooperation in the following years.
Despite serving only 21 months in office, President Wahid spent nearly a quarter of his tenure on state visits.[25] China was Wahid’s first visit in 1999, a signal of his desire to improve bilateral relations, which culminated in a Joint Communiqué.[26] The 1997 Asian Financial Crisis presented China with an opportunity to translate renewed diplomatic ties into tangible support, primarily channeled through multilateral rather than bilateral frameworks. As a goodwill gesture, Beijing contributed US$400 million in standby loans as part of the IMF’s rescue package for Indonesia, US$200 million in export credit facilities, a US$3 million grant in medicines, and 50,000 tons of rice.[27] This positioned China favorably in the eyes of Indonesia (Sukma, 2009). Otherwise, Beijing’s development finance during this period was limited, likely influenced by political sensitivities after the 1998 riots that disproportionately affected Chinese-Indonesians.
2.2.2 Megawati Soekarnoputri (2001-2004)
Assuming office following Wahid’s 2001 impeachment, President Megawati Soekarnoputri continued gradual normalization in Indonesia-China relations. Her administration formally recognized the Chinese New Year as a national holiday. Trade and investment between the two countries grew steadily, reaching US$8.7 billion in 2004,[28] comparable to Indonesia’s trade volume with the U.S. that year (Indonesian Statistics Agency, 2025). Beijing also sent humanitarian and disaster relief to Indonesia following the 2002 Bali Bombing, the Nabire earthquake, and an influenza outbreak, along with donated motorcycles for the Indonesian National Police in 2003. However, most of the PRC’s development finance (US$2.18 billion) was in the form of debt to support hard infrastructure projects with the expectation of commercial returns.[29]
President Megawati’s administration marked a shift in Beijing’s development finance from symbolic gestures to more strategic, sector-specific engagements. Financing was increasingly tied to long-term economic cooperation, particularly in energy and infrastructure. Although modest compared to the scale seen in later years, China’s financial support during this period (nearly US$2.2 billion) demonstrated a growing willingness to invest in Indonesia’s post-crisis recovery and development agenda.
Energy was the cornerstone of growing economic ties, driven partly by China’s increasing consumption needs. China was a net importer of oil products by 1993 and of crude oil by 1996. The China National Offshore Oil Corporation became the largest offshore oil producer in Indonesia, acquiring interests in five national oil and gas assets from the Repsol-YPF Group for US$585 million (Offshore Magazine, 2002).[30] Indonesian officials sought long-term energy export contracts, including direct talks with Chinese Premier Zhu Rongji (Tempo, 2002).
During President Megawati’s March 2002 state visit to Beijing, Chinese President Jiang Zemin pledged US$6 million in grants and US$400 million in soft loans[31] to Indonesia, earmarked for railway development in East and West Java (Liputan 6, 2002) and signed a cooperation agreement between Pertamina and PetroChina, the largest oil and gas companies from each country (Weaver, 2002). The visit paved the way for the inaugural Indonesia-China Energy Forum in 2002. A key outcome of the forum was a landmark US$8.5 billion, 25-year contract to export liquefied natural gas (LNG) from Indonesia’s Tangguh block to China’s Fujian Province (People’s Daily, 2002).[32]
Indonesia’s Minister of Energy and Mineral Resources at the time hailed the LNG agreement as “the biggest project since the New Order era,” underscoring its importance for Indonesia’s post-crisis economic recovery (People’s Daily, 2002). Subsequent administrations criticized and sought to renegotiate the LNG deal, which was considered disadvantageous to Indonesia (Oster, 2006; Detik, 2008; Cahyafitri, 2014; MEMR, 2014). President Megawati defended the agreement, arguing that it opened the door to greater Chinese investment in Indonesia’s infrastructure and domestic processing capacity.
Beijing financed a second signature infrastructure project, the Surabaya–Madura (Suramadu) Bridge, with US$575.5 million via two preferential buyer’s credit loans from China Eximbank. Costing an estimated Rp 4.5 trillion (roughly US$466.6 million at current dollar rates) and spanning 5,400 meters, the Suramadu Bridge was among the most ambitious infrastructure projects of its time and a milestone in Indonesia-China relations. The project aligned closely with Indonesia’s broader national development goals, particularly around inter-island connectivity (The Jakarta Post, 2009).
2.2.3 Susilo Bambang Yudhoyono (2004-2014)
Less than two months after President Susilo Bambang Yudhoyono was sworn into office in 2004, a massive 9.3-magnitude earthquake and tsunami hit Aceh and Nias in Northern Sumatra. Relief operations were complicated, as concerns were raised over the presence of foreigners in Aceh, a conflict zone where the Indonesian military had sought to quell a separatist movement (Fox News, 2005). Nevertheless, President Yudhoyono welcomed international assistance, which he later credited with facilitating a peace agreement that ended the 30-year conflict (Yudhoyono, 2025).
China initially provided US$2.6 million to tsunami-affected countries. Prime Minister Wen Jiabao subsequently pledged US$60 million in relief and reconstruction aid for ASEAN countries.[33] During his state visit to Jakarta, Chinese President Hu Jintao elevated bilateral relations with Indonesia to a strategic partnership (Qin, 2005), pledging an additional US$3.63 million in aid, along with US$300 million in loans to support infrastructure development and the reconstruction of areas affected by the tsunami disaster (China Daily, 2005).[34][35] China also supplied disaster relief to support Indonesia’s response to a series of earthquakes in Alor (2004), Nabire (2005), and Yogyakarta (2006).
Cooperation between China and Indonesia extended beyond the initial relief and reconstruction focus to encompass a deepening of economic ties between Presidents Hu and Yudhoyono. Bilateral trade expanded, moving from raw material exports toward investment in Indonesia’s capacity to domestically process its natural resources. The shift was described as a “honeymoon” phase (The Jakarta Post, 2008). Yudhoyono’s tenure saw a noticeable increase in Chinese loans directed to Indonesia’s private sector. Recipients ranged from large-scale mining corporations to consumer goods companies.
While development finance from Beijing lagged behind Seoul and Tokyo, China’s capital was directed toward several of Indonesia’s strategic priorities (The Jakarta Post, 2008), where there was implicit openness to foreign investment. For example, the Yudhoyono government had identified industrial development, transportation infrastructure, and telecommunications as essential facets of its roadmap for national growth over a 20-year time horizon.[36] Aligned with this, most of Beijing’s development finance during Yudhoyono’s tenure was directed to the energy and industrial sectors. These investments aligned with Indonesia’s urgent infrastructure development priorities, such as the transition from oil- to coal-fired power plants, to help Indonesia’s state-owned utility, Perusahaan Listrik Negara (PLN), overcome supply chain bottlenecks and high financing costs (Sambodo and Oyama, 2010; Ali and Wulandari, 2008).[37]
Beginning in 2006, President Yudhoyono signed several Memoranda of Understanding (MOUs) on energy projects worth US$3.56 billion during the Indonesia-China Energy Forum in Shanghai (Detik, 2006; Antara, 2006).[38] The centerpiece of Yudhoyono’s energy policy was his 10.000 MW Fast Track Program (FTP) to rapidly increase domestic electricity supply.[39] The plan called for the construction of 10 new power plants in Java (7.430 MW) and 25 outside Java (2.121 MW), at an estimated cost of Rp 98.1 trillion.[40] PLN financed 15 percent of the project, with the remaining 85 percent sourced from foreign loans (MEMR, 2008).
Beijing was a fast mover, committing big money to support several projects in the first phase of the Fast Track Program. A reported 22 projects were awarded to Chinese companies, with nearly 90 percent of the project financing sourced from China (Detik, 2009; Kompas, 2009). President Yudhoyono announced a further US$761 million[41] in Chinese financing commitments for energy projects led by PLN in 2009, during an inauguration ceremony for the Suramadu Bridge. This included US$468 million[42] from China Development Bank for the Adipala power plant in Cilacap, Central Java, and US$293 million[43] from the Export-Import Bank of China for the Pacitan plant in East Java (Alfian, 2009).
Energy, particularly hydropower, would remain a focus of Indonesia-China collaboration in Yudhoyono’s second term, which secured US$3.6 billion in Chinese financing across 10 projects. The largest was a US$883 million buyer’s loan[44] for the second expansion of the 660 MW Cilacap Power Plant. Three of the nine power plants financed were part of phase two of Yudhoyono’s Fast Track Program, which aimed to rapidly expand the nation’s electricity generation capacity. This included the 110 MW Jatigede Hydropower Dam, backed by a US$147.6 million loan from China Eximbank.[45] Funding was distributed to projects across Indonesia, with several serving specific industrial needs as captive power sources (e.g., the Sulawesi Mining Power Station Project in the Morowali Industrial Park) or private sector projects under the Independent Power Producer scheme.
Projects related to refining and processing facilities—from establishing smelters and paper factories to expanding palm oil production—gained traction by Yudhoyono’s second term. Most financing was directed toward private sector entities to support business growth. A notable example is in 2013, when China Development Bank (CDB) provided a US$2.3 billion loan to PT OKI Pulp and Paper Mills, a subsidiary of Asia Pulp and Paper, for the construction of one of Indonesia’s largest paper mills (Antara, 2013).[46] The loan agreement was one of nearly two dozen signed during President Xi’s 2013 state visit to Indonesia,[47] collectively worth US$28.2 billion.[48] These cooperative agreements spanned critical minerals processing, transportation, telecommunications, training and capacity building, aviation, banking, and plantation development.
Digital connectivity was another recurring theme of China’s investments during Yudhoyono’s tenure. Buyer’s credit facilities—lending to finance the acquisition of equipment and services from Chinese companies such as ZTE and Huawei—was a popular modality for Beijing’s investments in Indonesian firms such as Axis, PT Smart Telecom, PT Indosat, and Telekom Indonesia. This telecommunications emphasis was also responsive to a presidential priority, as the sector’s development featured prominently in Yudhoyono’s national budget plans and commitment to see all Indonesian villages connected to the internet by 2010. His administration launched key connectivity programs such as Desa Internet (Internet Village), Desa Berdering (Ringing Village), and Palapa Ring. These projects blended domestic private and public finance, with sizable sums bankrolled by China, along with implementation by private and state-owned telecommunications companies.
Following the success of the Suramadu Bridge (see Box 1 above), this period also saw increased investment in more diversified transport and logistical infrastructure projects, including toll roads, railways, and bridges. There was also a significant uptick in business loans, with 36 separate instances amounting to nearly US$1 billion.[49] Merpati Airlines, established to serve Indonesia’s most remote regions, received one such loan to facilitate the purchase of 15 MA60 aircraft from China’s Xi'an Aircraft Industrial Corporation. However, the company experienced difficulty repaying the loan, eventually filing for bankruptcy in 2014.
China-Indonesia relations were at a relative high point during Yudhoyono’s tenure, with the inauguration of the Suramadu bridge, along with the spate of financing for energy, connectivity, and industrial development. In a landmark moment, during his 2013 state visit, President Xi addressed the Indonesian parliament, where he announced plans to build the “21st Century Maritime Silk Road,” the establishment of the Asian Infrastructure Investment Bank, and the signing of the China-Indonesia Comprehensive Strategic Partnership. In line with its two-track development model of pairing big-ticket infrastructure projects with small-dollar goodwill efforts, Beijing provided in-kind support and financing for Mandarin language courses, Confucius Institutes across six universities in Indonesia, and scholarships for Indonesian students to study abroad in China.
However, Chinese development finance was not without controversy. Signs of strain emerged over disbursement delays, which triggered setbacks in project implementation,[50] while some cabinet officials raised concerns that China’s dollar-denominated loans could increase foreign exchange costs and create an onerous financial burden for Indonesia to repay.[51] Beijing-backed energy projects (e.g., Parit Baru Power Plant Project, Celukan Bawang Coal-Fired Power Plant) were scrutinized over labor and environmental concerns. A syndicated loan for Krakatau Steel was beset with delays and cost overruns before it was ultimately deemed economically unviable and closed a mere six months after construction was completed (Pratama, 2022). This led to the arrest of senior executives[52] and state losses amounting to Rp 6.9 trillion (Tempo, 2022).[53]
2.2.4 Joko Widodo (2014-2024)
Assuming office in 2014, President Joko Widodo inherited a relationship with China that was on the rise. The previous year, the two countries had signed a Comprehensive Strategic Partnership, and Chinese President Xi Jinping chose Jakarta to launch the Belt and Road Initiative (BRI) and the Asian Infrastructure Investment Bank. However, this cooperation was tempered by frequent maritime disputes between the two countries over fishing rights near the Natuna Islands (Lalisang and Candra, 2020). Widodo was pragmatic in his approach to Beijing, viewing China as a useful partner in helping Indonesia advance its national development and economic growth. Positioning Indonesia as a central node in global maritime trade and security was the cornerstone of Widodo’s foreign policy agenda, which he coined the “Global Maritime Fulcrum” (GMF).
The Widodo administration made infrastructure development—including an integrated mass public transportation system across sea, air, and land—a featured element of the president’s nine-point agenda known as the NawaCita.[54] Indonesia and China signed a Memorandum of Understanding (MoU) in 2018, formalizing maritime and logistics infrastructure cooperation. The MoU combined elements of BRI and GMF to enhance Indonesia’s inter-island and regional connectivity, drive economic growth, and meet rising domestic demand while hedging risk.[55] In several respects, the agreement attempted to mitigate concerns over indebtedness and dependence that had plagued Beijing’s BRI projects elsewhere (Bisnis.com, 2019; Cheang, 2019b).
Chinese development finance reached record levels in the number of projects (233) and dollars (US$40.3 billion) to help resource President Widodo’s ambitious infrastructure agenda. Notably, these investments were heavily concentrated during Widodo’s first term and were more frequently financed using debt-like instruments rather than conventional aid. The early years of Widodo’s presidency saw the return of large-scale Chinese energy investments in Indonesia.
Under his NawaCita agenda, President Widodo sought to install an additional 35,000 MW of electricity generation capacity across 210 locations over five years to meet growing demand.[56] Most of Beijing’s energy-focused development finance was oriented toward three projects, each exceeding US$1 billion in investment: (1) the 1,000 MW Cilacap Power Plant Phase 3 Expansion; (2) the 1,200 MW Bangko Tengah Mine-Mouth Power Plant; and (3) the 2,100 MW Java-7 Coal-Fired Power Plant. A smaller portion of Chinese financing was directed toward geothermal and gas projects, though these remained on a more limited scale.
The transport and logistics sector also attracted ample attention from Beijing, with the majority of financing directed toward the Jakarta–Bandung High-Speed Rail Project (HSR), the first of its kind in Indonesia and Southeast Asia (see Box 3 below).[57] The project triggered competing proposals from Japan and the PRC before Indonesia ultimately chose Beijing’s proposal, funded by the China Development Bank through a 75 percent debt and 25 percent equity structure (Brummitt and Chatterjee, 2015). Other PRC-financed transport investments included 16 toll road projects (US$2.45 billion), four railway projects (US$414.1 million), and the leasing of two 737-800 jets by BOC Aviation Limited to PT Lion Mentari Airlines.
Under the Widodo administration, and much like in its dealings with President Yudhyono, Beijing continued to direct a substantial portion of its development finance to projects in the industry, mining, and construction sector (US$6.5 billion). Critical minerals were a priority, aligning with Beijing’s hunger for natural resources and Jakarta’s interest in capturing more added value from these exports. Notable projects included a US$1.26 billion loan for the Xiamen Xiangyu Integrated Stainless Steel Plant Project in South Sulawesi and financing related to projects based in the Morowali Industrial Park, including smelters, steel plants, and captive coal power plants across four phases worth US$ 2.8 billion in total (see Box 3 below). Other projects focused on processing lithium and cobalt, but some also went to basic materials such as cement.
During the COVID-19 pandemic, the PRC’s development finance to Indonesia was primarily focused on supporting the country’s response efforts, from personal protective equipment (PPE) and vaccines to liquid oxygen and other medical supplies worth roughly US$85 million. Beijing also supplied a capital injection to Bank Rakyat Indonesia in October 2020, allowing it to restructure more than 2.9 million debtors, with a total loan value of Rp190 trillion (Sidik, 2020).
With just a few months into Prabowo Subianto’s presidency, we can only make educated guesses as to how the PRC’s development finance might evolve. The Subianto administration has set out an ambitious goal of 8 percent growth for Indonesia and views Beijing as a crucial economic partner (Cabinet Secretariat of Indonesia, 2025). Chinese officials warmly characterized Indonesia as a model partner in the Global South and vital to China’s industrial value chains (Liu and Rayi, 2024). Indonesia was the first in Southeast Asia to join the BRICS+[58] as of January 2025, a hedge against uncertainty over U.S. tariff policies (King, 2025).
Rather than a full embrace of China, Subianto’s approach appears to build upon the foreign policy of his predecessor, Joko Widodo, who practiced “pragmatic equidistance” (Laksmana, 2017), balancing relationships with competing powers without aligning fully with either side in order to reap economic benefits but with diplomatic autonomy. This is not a new idea. Indonesia was an early leader of the non-aligned movement, promoting collective self-reliance and solidarity of developing countries to pursue shared economic goals (Pedersen, 2021). Beijing has sought to burnish its status as a developing country to ingratiate itself with other emerging economies like Indonesia (Strangio, 2025).
2.3 In which communities is China investing—and why?
In this section, we explore whether and how PRC development finance may vary in another respect: geography. To answer this question, we draw upon the location information in AidData’s project-level data on Chinese development finance to identify the subnational distribution of Beijing’s activities within Indonesia across 36 provinces and two special regions for Jakarta and Yogyakarta (the first-level administrative division). Between 2000 and 2023,[59] Beijing bankrolled activities across both large and small provinces. While PRC actors directed the most money to highly populated areas on Java and Sumatra, they also financed projects in more sparsely populated provinces such as West Papua to access strategically important minerals or waterways.
Java attracted the lion’s share of Beijing’s development finance that could be traced to the subnational level, in terms of both financial commitments (47 percent) and projects bankrolled (43 percent).[60] These activities were relatively equally spread across the island’s four administrative regions and two special capital regions: West Java (US$6.58 billion, 24 projects), Central Java (US$5.56 billion, 12 projects), Banten ($4.28 billion, 22 projects), the Jakarta Special Capital Region (US$3.53 billion, 21 projects), and East Java (US$3.42 billion, 22 projects). The notable exception was the Yogyakarta Special Region, which only received US$10 million, though its five projects still indicate a moderate amount of diplomatic outreach. Figure 2.9 and Table 2.10 below disaggregate projects across Indonesia’s provinces.
Economically dynamic and populous, Java represents attractive market opportunities for Chinese firms. Proximate to the historical seat of government and the home regions of Indonesia’s presidents, these geographies also provide an opportunity for the PRC to exert political influence with local elites.[61] Beijing’s economic engagement in Java illustrates its two-track development model. It financed expensive, commercially oriented projects, such as the Jakarta–Bandung High Speed Rail. In parallel, it also bankrolled relatively cheap goodwill projects in the social sector to win hearts and minds and build “people-to-people” ties. For example, Beijing oriented much of its support for Indonesia’s COVID-19 response (e.g., medical teams, donated medical supplies, and vaccines) to Jakarta and the surrounding areas.
Home to several large metropolises,[62] Sumatra attracted the second largest concentration of activity, receiving roughly one-quarter of Beijing’s development finance dollars and projects across its 10 provinces. South Sumatra captured relatively more money: Beijing directed over US$7 billion to the region, nearly US$800 per province resident. Much of this financing was oriented around a few big-ticket infrastructure projects related to paper pulp production, telecommunications, and power plants. Comparatively, North Sumatra and Aceh received a higher share of PRC projects, but with ostensibly lower dollar values.
Although Papua accounted for a relatively small share of Beijing’s development finance dollars and projects in absolute terms, the picture changes dramatically if we consider per capita investment. West Papua is a case in point: the province attracted only five projects worth US$3.69 billion during the period; however, this represents over three thousand dollars in per capita spending by Beijing to the resource-rich area. PRC investments focused on tapping West Papua’s natural gas reserves through a series of projects dating back to a 2006 investment by a consortium of Chinese banks[63] in the Tangguh Liquified Natural Gas Project.
Figure 2.9: Chinese-funded development projects in Indonesia by province, 2000-2023
Notes: These maps show total counts and dollar values for PRC-funded development projects in Indonesia aggregated to the province level. Multiple PRC projects could not be linked to a region, either because the project was national in nature or there was insufficient information to determine the precise location. The research team supplemented PRC finance data with limited desk research and media article reviews to identify additional projects and details for 2022 and 2023. Data for these additional years should be considered provisional. Sources: AidData’s Global Chinese Development Finance Dataset, Version 3.0 for 2000-2021 (Custer et al., 2023; Dreher et al., 2022).
Chinese official entities invested over US$3 billion into exploring and exploiting the offshore oil fields in resource-rich areas off Berau Gulf. The Tangguh gas field attracted a renewed round of investment in 2016, when the Bank of China and China Construction Bank invested US$415.6 million in the third wave of expansion. China’s growing appetite for energy and raw materials fueled interest in investments to build Indonesia’s liquefied natural gas export capacity; however, these projects are better understood as multinational ventures, rather than exclusively Chinese. Japan International Finance Management Corporation was the direct receiving agency for the 2016 wave of investment, and PRC-affiliated entities crowded in syndicated financing from Brazilian, Chinese, and Japanese banks. By contrast, Beijing paid negligible attention to other provinces in Papua, such as Maluku, Kalimantan, and Nusa Tenggara.
Sulawesi was in the middle of the pack as a destination for PRC development finance. Its six provinces attracted 17 percent of Beijing’s money and 12 percent of its funded projects. However, the spread of this attention was far from even. Central Sulawesi province accounted for most of Beijing’s portfolio in the region (US$5.76 billion, 15 projects), emphasizing export capacity for industrial goods. The PRC-backed Morowali Industrial Park was a cornerstone of this investment portfolio, with a consortium of Chinese lenders bankrolling the Sulawesi Mining Power Station Project to the tune of US$2.5 billion from 2013 to 2018. These investments sought to build the steel and nickel production capacity of smelters in the industrial park, and by extension, build the industrial base of Indonesia’s largest nickel-producing industrial site (see Box 4 above).
Table 2.10: Official PRC projects in Indonesia by province, 2000-2023
The table can be sorted by clicking on a column. On small screens, scroll horizontally to view hidden columns.
|
Province name |
Region |
Project value in billions of 2024 USD |
Project count |
Per capita USD |
|---|---|---|---|---|
|
Aceh |
Sumatra |
0.23 |
12 |
42.20 |
|
Bali |
Nusa Tenggara |
0.60 |
7 |
135.07 |
|
Bangka Belitung Islands |
Sumatra |
0.00 |
0 |
0.00 |
|
Banten |
Java |
4.28 |
22 |
344.05 |
|
Bengkulu |
Sumatra |
0.36 |
3 |
168.86 |
|
Central Java |
Java |
5.56 |
12 |
146.75 |
|
Central Kalimantan |
Kalimantan |
0.03 |
1 |
11.01 |
|
Central Papua |
Papua |
0.00 |
2 |
Missing population data |
|
Central Sulawesi |
Sulawesi |
5.76 |
15 |
1,844.92 |
|
East Java |
Java |
3.42 |
22 |
81.90 |
|
East Kalimantan |
Kalimantan |
0.27 |
5 |
66.51 |
|
East Nusa Tenggara |
Nusa Tenggara |
0.02 |
2 |
4.28 |
|
Gorontalo |
Sulawesi |
0.00 |
1 |
1.30 |
|
Highland Papua |
Papua |
0.00 |
0 |
Missing population data |
|
Jakarta Special Capital Region |
Java |
3.53 |
21 |
330.54 |
|
Jambi |
Sumatra |
0.00 |
1 |
0.43 |
|
Lampung |
Sumatra |
0.03 |
2 |
3.24 |
|
Maluku |
Maluku Islands |
0.02 |
1 |
12.38 |
|
North Kalimantan |
Kalimantan |
0.02 |
1 |
21.32 |
|
North Maluku |
Maluku Islands |
0.71 |
6 |
523.21 |
|
North Sulawesi |
Sulawesi |
0.42 |
6 |
155.90 |
|
North Sumatra |
Sumatra |
3.17 |
25 |
203.56 |
|
Papua |
Papua |
0.02 |
2 |
5.31 |
|
Riau |
Sumatra |
0.30 |
2 |
44.36 |
|
Riau Islands |
Sumatra |
0.26 |
1 |
117.18 |
|
South Kalimantan |
Kalimantan |
0.41 |
4 |
94.78 |
|
South Papua |
Papua |
0.00 |
0 |
Missing population data |
|
South Sulawesi |
Sulawesi |
0.58 |
5 |
61.32 |
|
South Sumatra |
Sumatra |
7.04 |
9 |
797.14 |
|
Southeast Sulawesi |
Sulawesi |
1.46 |
2 |
521.81 |
|
Southwest Papua |
Papua |
0.00 |
0 |
Missing population data |
|
Special Region of Yogyakarta |
Java |
0.01 |
5 |
2.68 |
|
West Java |
Java |
6.58 |
24 |
130.79 |
|
West Kalimantan |
Kalimantan |
0.53 |
6 |
93.18 |
|
West Nusa Tenggara |
Nusa Tenggara |
0.06 |
3 |
11.28 |
|
West Papua |
Papua |
3.69 |
5 |
3,063.52 |
|
West Sulawesi |
Sulawesi |
0.00 |
0 |
0.00 |
|
West Sumatra |
Sumatra |
0.23 |
2 |
39.97 |
Notes: This table shows Chinese-funded development projects by province between 2000 and 2023 (inclusive of aid and debt instruments) by project count, dollar value, and dollar value per capita, based on 2024 population statistics. The research team supplemented PRC finance data with limited desk research and media article reviews to identify additional projects and details for 2022 and 2023. Data for these additional years should be considered provisional. Sources: AidData’s Global Chinese Development Finance Dataset, Version 3.0 for 2000-2021 (Custer et al., 2023; Dreher et al., 2022) and BPS-Statistics Indonesia 2024.
2.4 How has Chinese FDI changed over time, both in absolute terms and in relation to the PRC’s development finance?
China has been the largest source of inbound foreign direct investment (FDI) to Indonesia over the past fifteen years (2010-2024), totaling US$94.1 billion and far exceeding Beijing’s state-directed development finance.[64] By definition, FDI projects carry comparatively longer-lasting ownership stakes or financial interests between corporate investors across economies (OECD, n.d.a and n.d.b).[65] Chinese companies, including inbound finance from mainland China and Hong Kong, accounted for nearly a quarter of new foreign capital expenditures (capex) in Indonesia. However, this alternative capital operates distinctly from development finance—sometimes complementing it, other times diverging from it.
Chinese FDI tends to follow the herd, mirroring trends in broader capital markets data. Inbound capital flows to Indonesia from all source countries peaked early in 2015 at US$14.7 billion in new deals (Figure 2.11). Chinese FDI to Indonesia also hit a high at that time, with new deals worth US$20.8 billion. At other times, Chinese investors appeared more willing to pass on Indonesian investments than the market as a whole. This pattern is noticeable at two different periods: new Chinese FDI to Indonesia dropped by 98 percent between 2011 and 2012 and by 83 percent from 2018 to 2019, while there were smaller or no dips in all source FDI to the country.[66]
Following a global slowdown related to COVID-19, there was renewed interest in overseas investments in Indonesia. Chinese investors were particularly keen to engage, responsible for one third of every new FDI dollar directed to Indonesia in 2023—the equivalent of over US$20 billion in new capex (Figure 2.11). This investment boom was not unique to Indonesia, and other ASEAN markets such as Vietnam, the Philippines, and Thailand still attracted more Chinese FDI overall (IMF, 2024). Two factors may have been consequential in fueling this boom: Beijing’s “Zero-COVID” policy depressed the domestic market,[67] and strained relations with the U.S. created pressure to diversify manufacturing overseas.
Figure 2.11: Inbound Chinese and global FDI to Indonesia,
2010-2024
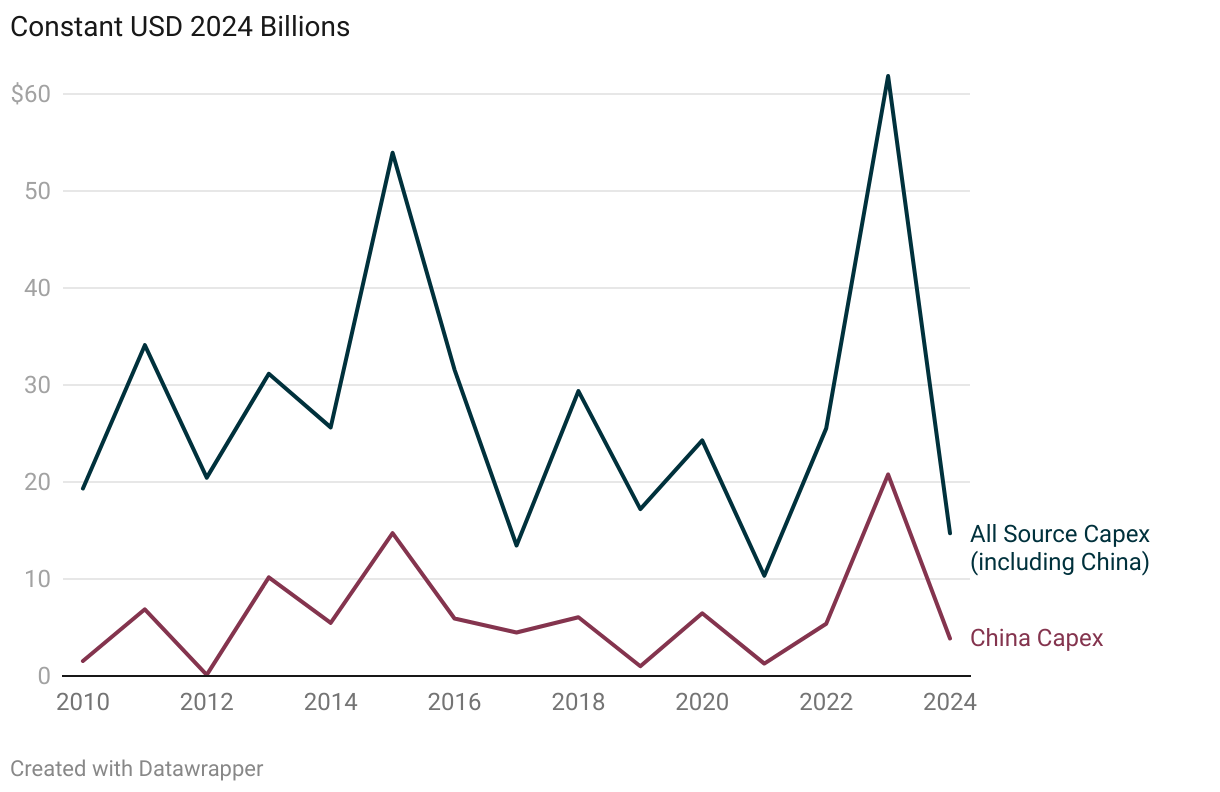
Notes: This figure shows annual inbound commitments of new foreign direct investment (FDI) in Indonesia from 2010 to 2024. The red line represents Chinese sources, while the blue line represents all sources (including China). FDI dollars represent capital expenditures (capex) in billions of 2024 USD. Sources: fDi Markets, from the Financial Times Ltd.
Table 2.12: Inbound Chinese and global FDI to Indonesia, 2010-2024
The table can be sorted by clicking on a column. On small screens, scroll horizontally to view hidden columns.
|
Year |
All source capex, billions of constant 2024 USD |
China capex, billions of constant 2024 USD |
Chinese capex percent |
|---|---|---|---|
2010 |
19.32 |
1.55 |
8.02% |
2011 |
34.09 |
6.87 |
20.14% |
2012 |
20.44 |
0.12 |
0.57% |
2013 |
31.14 |
10.17 |
32.68% |
2014 |
25.62 |
5.47 |
21.35% |
2015 |
53.92 |
14.72 |
27.31% |
2016 |
31.58 |
5.93 |
18.76% |
2017 |
13.45 |
4.48 |
33.32% |
2018 |
29.36 |
6.06 |
20.63% |
2019 |
17.20 |
1.01 |
5.86% |
2020 |
24.28 |
6.46 |
26.61% |
2021 |
10.33 |
1.28 |
12.40% |
2022 |
25.52 |
5.39 |
21.12% |
2023 |
61.83 |
20.77 |
33.59% |
2024 |
14.71 |
3.87 |
26.32% |
Notes: This table shows total inbound commitments of new Chinese foreign direct investment (FDI) and all source FDI in Indonesia from 2010 to 2024. FDI dollars represent capital expenditures (capex) in billions of 2024 USD. Sources: fDi Markets, from the Financial Times Ltd.
Figure 2.13: Inbound Chinese FDI as a share of total FDI in Indonesia, 2010-2024

Notes: This figure shows Chinese-sourced inbound commitments of new foreign direct investment (FDI) as a share of total annual inbound FDI in Indonesia from 2010 to 2024. FDI dollars represent capital expenditures (capex) in billions of 2024 USD. Sources: fDi Markets, from the Financial Times Ltd., calculations by AidData.
Map 2.14: Chinese inbound FDI in Indonesia by region, 2010-2024
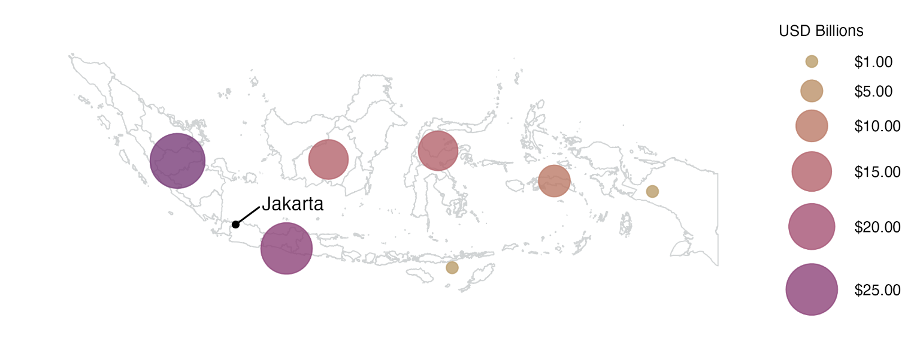
Notes: This map shows the total inbound commitments of new Chinese foreign direct investment (FDI) in Indonesia from 2010 to 2024. FDI dollars represent capital expenditures (capex) in billions of 2024 USD. Several FDI projects did not have a specified location. Sources: fDi Markets, from the Financial Times Ltd.
Chinese FDI, much like Beijing’s state-directed development finance, does not flow in equal measure across all geographies. That said, there are differences, underscoring that these flows are not monolithic. Java (US$20.8 billion) and Sumatra (US$26.1 billion) attracted relatively more Chinese FDI than other regions (Table 2.15), much like the PRC’s development finance. However, as a share of overall FDI, Chinese investors were far more dominant in Sumatra (56 percent) than in Java (11 percent). Sulawesi attracted only moderate Chinese FDI, despite capturing extremely high per capita levels of development finance (Table 2.15).
Table 2.15: Chinese inbound FDI in Indonesia by region, 2010-2024
Destination region |
Included provinces |
All source capex, billions of constant 2024 USD |
China capex, billions of constant 2024 USD |
Java |
Banten, Central Java, East Java, DKI Jakarta, DI Yogyakarta, West Java |
181.10 |
20.75 |
Kalimantan |
Central Kalimantan, East Kalimantan, North Kalimantan, South Kalimantan, West Kalimantan |
28.07 |
11.21 |
Maluku |
Maluku, North Maluku |
12.87 |
7.58 |
Nusa Tenggara |
Bali, West Nusa Tenggara, East Nusa Tenggara |
10.01 |
0.77 |
Papua |
Central Papua, Highland Papua, Papua, South Papua, Southwest Papua, West Papua |
2.62 |
0.60 |
Sulawesi |
Central Sulawesi, Gorontalo, North Sulawesi, South Sulawesi, Southeast Sulawesi, West Sulawesi |
36.01 |
13.24 |
Sumatra |
Aceh, Bangka Belitung Islands, Bengkulu, Jambi, Lampung, North Sumatra, Riau, Riau Islands, South Sumatra, West Sumatra |
46.70 |
26.06 |
Not specified |
NA |
95.41 |
13.92 |
Notes: This table shows the total inbound commitments of new Chinese foreign direct investment (FDI) in Indonesia from 2010 to 2024 by region. Data were not reported at the province-specific level. FDI dollars represent capital expenditures (capex) in billions of 2024 USD. Several FDI projects did not have a specified location. Sources: fDi Markets, from the Financial Times Ltd.
Much like its development finance, China’s FDI in Indonesia favored extractives, manufacturing, and construction more than other sectors (Table 2.16).[68] According to data from fDi Markets, Chinese firms accounted for 98 percent of new investments in mineral projects, and half of all capital directed to metals investments. Even when the overall dollars are small, Chinese investors have positioned themselves as a formidable force and account for the vast majority of FDI in specialized sectors such as wood products (95 percent) and ceramics and glass (62 percent).
Looking at specific sectors and geographies, we can pinpoint synergies between China’s FDI and its state-directed development finance. The PRC can use its state resources to lay early groundwork in strategic locales through infrastructure and relationships, which in turn crowd in market opportunities for Chinese FDI to build upon and scale (see Box 4).
A single Chinese FDI investment can also be catalytic in crowding in others. In 2022, the Hong Kong-based Xinyi Glass Holdings was awarded an 80-year concession to build a US$11.6 billion photovoltaic glass factory in Rempang, the largest Chinese FDI project to date in Indonesia (Hodge and Septiari, 2023). In 2023, the project partners announced plans to make the concession a cornerstone for the “Rempang Eco-City industrial park,” which will export multiple gigawatts of renewable energy yearly (Soeriaatmadja, 2023). Designated as one of Indonesia’s national strategic projects, development of the Eco-City provoked controversy over the government’s eviction of Rempang’s longtime residents to make way for the industrial park’s construction (Rahayu, 2025; Jong, 2023; Irham and Ajengrastri, 2023).
The potential scale of Chinese FDI can be attractive to Indonesian partners, but these promises do not always materialize in practice. Contemporary Amperex Technology Co., Limited (CATL), a Chinese manufacturer and technology company known for producing lithium-ion batteries, was planning to invest in Indonesia’s domestic nickel processing capacity—a strategic priority for the Indonesian government. The investment was predicted to be worth nearly US$6 billion, emphasizing sub-projects such as nickel mining and processing, battery materials, battery manufacturing, and recycling (Shanghai Nonferrous Metals Network, 2022).[69] Early in 2025, however, CATL announced that it would cut funding to the project, citing weak global demand (Juwita, 2025). This underscores the risk to Indonesia of relying exclusively on Chinese capital to develop critical infrastructure capacity, such as metals and mineral processing, to support the green energy transition.
Table 2.16: Selected sectors, inbound Chinese and global FDI in Indonesia, 2010-2024
The table can be sorted by clicking on a column. On small screens, scroll horizontally to view hidden columns.
|
Sector |
All Source Capex Total, Constant USD 2024 Billions |
China Capex Total, Constant USD 2024 Billions |
Chinese Capex Percent |
|---|---|---|---|
|
Metals |
83.47 |
41.55 |
50% |
|
Minerals |
12.06 |
11.78 |
98% |
|
Electronic components |
31.07 |
8.84 |
28% |
|
Coal, oil and gas |
67.72 |
7.14 |
11% |
|
Real estate |
34.65 |
6.14 |
18% |
|
Automotive OEM |
18.69 |
2.42 |
13% |
|
Building materials |
5.9 |
2.23 |
38% |
|
Hotels and tourism |
10.84 |
2.13 |
20% |
|
Renewable energy |
22.81 |
2.11 |
9% |
|
Rubber |
8.62 |
2.09 |
24% |
|
Ceramics and glass |
1.66 |
1.03 |
62% |
|
Industrial equipment |
1.79 |
0.65 |
36% |
|
Wood products |
0.19 |
0.18 |
95% |
|
Pharmaceuticals |
0.48 |
0.14 |
30% |
Notes: This table shows selected sectors for (i) total inbound Chinese FDI and (ii) FDI from all sources, including China, in Indonesia from 2010 through 2024. FDI dollars represent capital expenditures (capex) in billions of 2024 USD. The table includes sectors which represented the highest capex from China, or sectors where the percentage of global capex from China exceeded 20 percent. Shading corresponds to each column. Sources: fDi Markets, from the Financial Times Ltd. For full sector details, please refer to Table C-3 in the Technical Appendix.
3. Relationships
Key insights in this chapter:
- Beijing’s development finance in Indonesia relies on a global network of 208 financiers and co-financiers to raise capital and distribute risk
- PRC reliance on Chinese state-owned enterprises for implementation has risks, as 14 of these were associated with questionable financial practices
- Beijing’s projects are not just made-in-China: Indonesian firms are often implementers or participate in joint ventures and special purpose vehicles
- Universities and Islamic organizations in Indonesia allow Beijing to borrow credibility and leverage distribution networks to win hearts and minds
The PRC is a leading development finance supplier in Indonesia, but it does not act alone. What once involved a small number of Chinese policy banks and state-owned enterprises has mushroomed into an extensive and disparate network of actors with varying reputations for transparency, execution, and outcomes. Moreover, there are two sides to the international development equation: the supply side and the demand side. For every project Beijing bankrolls in Indonesia, there must be willing beneficiaries, implementers, and often co-financiers.
In this chapter, we explore who finances and delivers Chinese development finance investments in Indonesia. How many entities are involved? Who are they and where are they headquartered? Who partners with whom? How is the money distributed among the different players? What roles do each play? We began with the project-level information described in Chapter 2 to identify entities involved in Chinese development projects as financiers, co-financiers, or implementers (supply side) and as direct or indirect recipients (demand side). We then accessed large industry databases (e.g., LSEG Data and Analytics) to produce profiles of these entities, supplemented by desk research. We also analyzed media coverage of some of these actors to understand how they are perceived locally.
3.1 Supply side: Who finances and implements PRC-backed development projects?
Beijing’s support for development projects in Indonesia is a complex enterprise. Between 2000 and 2023, an estimated 439 discrete entities were involved in financing, co-financing, or implementing such activities in Indonesia. Far from monolithic, these players were headquartered in 35 countries or territories (see Figure 3.1 below). While most were headquartered in China (168) or Indonesia (158), a quarter of these entities hailed from economies across Asia, the Pacific, the Middle East, Europe, and North America.
Since we are tracking PRC-financed development investments, all 58 of the primary financiers were affiliated with Chinese institutions. These entities included state-owned commercial or policy banks, government ministries, and diplomatic missions. Fifty-two entities were headquartered in mainland China, while the other six were Chinese state-owned banks or government entities operating in Indonesia, Singapore, and Taiwan.[70] The top 10 financiers were involved in eight or more projects (Figure 3.2); however, this type of repeat business is inconsistent across all financiers. Notably, 34 primary financiers bankrolled just one project in Indonesia over two decades.
Four of the five largest primary financiers, in terms of the number of projects funded, include two state-owned commercial banking groups (Bank of China and Industrial and Commercial Bank of China) and two state-owned policy banks (Export-Import Bank of China and China Development Bank). These entities mobilize funding at scale for ambitious infrastructure projects costing millions of dollars. Each of them, and their subsidiaries, also show up as co-financiers of multiple projects: Bank of China financed 39 projects, Industrial and Commercial Bank of China financed 35, China Development Bank financed 15, and China Eximbank financed nine. Some illustrative example projects are referenced following Figure 3.1.
Figure 3.1: Headquarters of financiers, co-financiers, and implementers of PRC-led development projects in Indonesia, 2000-2023

Notes: This figure illustrates the number of financiers, co-financiers, and implementers (i.e., the supply-side) of Chinese-funded development projects in Indonesia, and their headquarters. The research team supplemented PRC finance data with limited desk research and media article reviews to identify additional projects and details for 2022 and 2023. Data for these additional years should be considered provisional. Sources: AidData’s Global Chinese Development Finance Dataset, Version 3.0 for 2000-2021 (Custer et al., 2023; Dreher et al., 2022).
The Industrial and Commercial Bank of China (ICBC) disbursed US$50 million to connect Soekarno-Hatta International Airport to Manggarai Train Station. ICBC and its subsidiaries contributed financing and co-financing across at least 157 projects in Indonesia, including syndicated loans for telecommunications (e.g., the Palapa Ring East Package) and housing (e.g., One Million Houses) via an IDR 1 trillion credit line to Bank Tabungan Negara. China Development Bank (CDB) lent US$150 million to construct the 100 MW Kendari-3 Power Plant and underwrote components of the Jakarta–Bandung HSR and the Morowali Industrial Park. Bank of China (BOC) was involved in multiple syndicated loans for toll roads with PT Wijaya Karya and an IDR 1 trillion loan to PT Sarana Multi Infrastruktur to boost national infrastructure financing capacity. China Eximbank backed large-scale energy and water projects in coordination with Indonesia’s Ministry of Public Works and Housing.
Diplomatic entities such as the Chinese embassy in Jakarta and consulates in Surabaya and Medan play a different role, in comparison to the deep pockets of state-owned policy and commercial bank groups. Frontline players in Beijing’s “hearts and minds” strategy, these diplomatic missions bankroll an array of high visibility and low cost activities to build goodwill—from donated supplies for schools and hospitals (e.g., books and tablets for the Bandung Institute for Technology, and masks and vehicles to support COVID-19 response) to post-disaster assistance (e.g., US$35,000 to tsunami affected regions in 2018) and cultural diplomacy (e.g., two pandas for Taman Safari Bogor, and Ramadan break-the-fast ceremonies). Chinese consular offices frequently served as intermediaries for grant-based cooperation, coordinating through Indonesia’s Ministry of Foreign Affairs or the National Disaster Management Agency (BNPB).
Another key financier of educational cooperation is the Center for Language Education and Cooperation (CLEC, formerly Hanban).[71] CLEC partners with local universities to support Mandarin language education, skills development, and foreign exchange, such as the flagship Confucius Institutes (CIs) program. Illustrative CLEC partnerships in Indonesia include those brokered with Universitas Negeri Surabaya, Maranatha Christian University, Hasanuddin University, Tanjungpura University, Malang State University, and the University of Al-Azhar. These institutes were co-financed through multi-year grant agreements, usually underpinned by Chinese universities such as Hainan Normal University.
The PRC’s Ministry of Commerce (MOFCOM) has long been active in Indonesia’s development landscape, especially in the early 2000s and post-tsunami periods. One of MOFCOM’s flagship programs was the China-Indonesia Hybrid Rice Technical Cooperation Project, launched via a bilateral agreement in 2008. The project trained over 40 Indonesian agricultural officers and introduced high-yield Chinese rice varieties to experimental plots in seven provinces. MOFCOM oversaw the post-2004 Aceh tsunami reconstruction package, including RMB 60 million (US$7.5 million) in grants to rebuild schools and offices. These projects were implemented under generous concessional terms, deviating from the norm of market-rate debt instruments often associated with the PRC’s financing.
Unlike many other bilateral lenders and donors, China does not publish its development finance activities via international portals such as the OECD’s Creditor Reporting System or the International Aid Transparency Initiative. To remedy this gap, AidData triangulates multiple data sources to track trends in PRC aid and debt flows to Indonesia.[72] Limits in publicly available information mean that the identities of primary financiers (and other actors) are sometimes unknown. In this respect, it is unsurprising that the second-most frequently mentioned financier is “unspecified Chinese Government Institution” (see Table 3.2 below).
Table 3.2: Top 10 financiers of Chinese-funded development projects in Indonesia, 2000-2023
Financier |
Number of projects |
|
Industrial and Commercial Bank of China (ICBC)[73] |
122 |
|
Unspecified Chinese government institution |
80 |
|
Bank of China (BOC)[74] |
78 |
China Development Bank |
58 |
|
Export-Import Bank of China (China Eximbank) |
55 |
|
Chinese embassy and consulate general |
21 |
|
China Construction Bank Corporation (CCB)[75] |
16 |
|
Hanban (Confucius Institute Headquarters) and Center for Language Education and Cooperation (CLEC)[76] |
13 |
|
China Ministry of Commerce |
9 |
|
China CITIC Bank Corporation Limited[77] |
8 |
Notes: This figure illustrates the number of projects involving each of the top 10 financiers of Chinese-funded development projects in Indonesia. Project counts have been aggregated across branches of the same institution (detailed in footnotes). Sources: AidData’s Global Chinese Development Finance Dataset, Version 3.0, for 2000-2021 (Custer et al., 2023; Dreher et al., 2022). Supplemented by limited desk research and media article review to identify additional projects and details for 2022-2023.
Co‑financing has become a common feature of PRC‑backed development in Indonesia, enabling Chinese policy banks to share credit risk and leverage international expertise. The number of co-financiers per project varies widely, from double-digits for larger projects to no co-financiers for others. We identified 208 co-financiers of Chinese-funded development projects in Indonesia, 63 percent of which were private sector entities. This finding is consistent with the global trend of China increasingly collaborating “with Western commercial banks and multilateral institutions” in its lending agreements (Parks et al., 2023).[78]
Figure 3.3: Top Chinese financiers and their recipients in Indonesia, 2000-2023

|
|
|
State-owned Policy Bank |
|
|
|
|
State-owned Commercial Bank; |
|
|
|
|
Government Agency |
|
|
|
|
Indonesian Government |
|
|
|
|
Other Recipients |
|
Notes: Line weights are based on project counts. This figure illustrates broad trends in the ties between top Chinese financiers of development projects and their recipients in Indonesia. It does not represent the entirety of the data on financiers and recipients of Chinese-funded development projects in Indonesia. Sources: AidData’s Global Chinese Development Finance Dataset, Version 3.0 for 2000-2021 (Custer et al., 2023; Dreher et al., 2022). Supplemented by limited desk research and media article review to identify additional projects and details for 2022-2023.
Further afield, institutions from Germany (9), the United States (7), and the United Kingdom (5) were also active co-financiers of Chinese-funded development projects in Indonesia. Most of these co-financing institutions belong to the financial services sector, operating as both commercial and investment banks with a significant international presence and capacity. While there are many repeat co-financiers in the roster, not all institutions are consistent in their participation. Roughly one-third of the co-financiers were involved with only one project in Indonesia.
Based on the number of projects in which they were involved, the most active co-financiers each contributed to 20 projects or more between 2000 and 2023 (see Table 3.4 below). The list features global banking heavyweights like the United Kingdom’s Standard Chartered Bank, Belgium’s BNP Paribas, and Citibank from the U.S. Co-financiers include prominent regional players like Japan’s Sumitomo Mitsui Banking Corporation (SMBC Group), Singapore’s DBS Bank, the ANZ Group from Australia, and Cathay Bank and CTBC, both from Taiwan. Indonesia Eximbank and Bank Mandiri were the two most prolific domestic co-financiers. The large number and diverse origins of the co-financiers demonstrate the highly integrated and interrelated nature of international development finance.
The multinational nature of this network of repeat co-financiers showcases the evolution of China’s development finance, as Beijing has embraced a syndicated financing model in which its state-owned policy and commercial banks still anchor large transactions but routinely share exposure with international banking institutions worldwide. Blending state‑directed capital with market‑based co‑financing has allowed the PRC to optimize deal size, diversify credit risk, and secure host‑country buy-in by incorporating domestic banks.
Table 3.4: Top 15 co-financiers of Chinese-funded development projects in Indonesia, 2000-2023
Co-financier |
Number of projects |
|
Sumitomo Mitsui Banking Corporation[79] |
48 |
|
DBS Bank[80] |
47 |
|
MUFG Bank, Ltd. (Formerly Bank of Tokyo-Mitsubishi UFJ, Ltd. (BTMU)) |
40 |
|
Bank of China (BOC)[81] |
39 |
|
Standard Chartered Bank PLC[82] |
36 |
|
Industrial and Commercial Bank of China (ICBC)[83] |
35 |
|
Oversea-Chinese Banking Corporation, Limited (OCBC Bank) |
35 |
|
BNP Paribas S.A.[84] |
31 |
|
PT Bank Mandiri (Persero) Tbk[85] |
30 |
|
CTBC Bank[86] |
26 |
|
Citibank N.A.[87] |
24 |
|
Indonesia Eximbank[88] |
23 |
|
Australia and New Zealand Banking Group (ANZ)[89] |
22 |
|
United Overseas Bank Limited (UOB)[90] |
22 |
Cathay United Bank |
20 |
Notes: This table lists the number of projects involving the top 15 financiers of Chinese-funded development projects in Indonesia. Project counts have been aggregated across branches of the same institution (detailed in footnotes). Sources: AidData’s Global Chinese Development Finance Dataset, Version 3.0 for 2000-2021 (Custer et al., 2023; Dreher et al., 2022). Supplemented by limited desk research and media article review to identify additional projects and details for 2022-2023.
Having traced how the financing for Chinese development projects is structured, we next turn to the firms and agencies that critically deliver these activities on the ground: the implementation partners. In Indonesia, this group includes 213 identified implementers, hailing from 12 countries. Since China has a reputation for “circular lending,” the practice through which a country uses its firms, labor, and supplies to implement international development projects (Horn et al., 2019), it is not entirely surprising that the second largest group of implementers are Chinese (92).
Nevertheless, Beijing’s development finance projects in Indonesia appear to be less reliant on Chinese implementation expertise than we would expect to see based on stereotypical news headlines. While Chinese state-owned companies tend to dominate the list of implementers globally,[91] in Indonesia, we see an almost equal split between Chinese implementers (90 entities) and domestic ones (102 entities).
Fifty-five percent of Chinese project implementers in Indonesia were state-owned enterprises. This trend is part of the design and delivery of the Belt and Road Initiative (BRI), which seeks to export excess capacity in China’s construction, steel, and cement industries and put it to productive use abroad, in ways that advance national interests (Mathew and Custer, 2023). China MCC17 Group (an engineering construction services provider) and ZTE Corporation (a telecommunications solutions provider) were involved in the most projects (see Table 3.5 below). Other players include Sinohydro (hydropower plants) and government agencies, including China’s Ministry of Commerce (MOFCOM), the Civil Aviation Administration, and China Scholarship Council, among others.
Many Chinese entities on the list of top implementers report to the same oversight body: the State-Owned Assets Supervision and Administration Commission of the PRC’s State Council (SASAC), ultimately directed by the Chinese Communist Party (CCP). SASAC plays an outsized role in China’s state-planned economy, guiding the productivity and direction of Chinese state-owned enterprises (SOEs) and their estimated US$976.22 billion in total assets (SASAC, 2025).[92] Other Chinese SOEs involved in multiple projects across Indonesia include SinoHydro, Power Construction of China (POWERCHINA), and Dongfang Electric Corporation (DEC).
Beijing turned to 102 Indonesian government agencies, state-owned enterprises and banks, private companies, and civil society organizations to help implement its projects. The Indonesian implementers are primarily state-owned enterprises (28 percent), private sector companies (27 percent), and government agencies (20 percent). The Government of Indonesia (ministry unspecified) implemented 26 projects, from distributing COVID-19 vaccines and earthquake relief to building sanitation facilities. The state-owned electric utility, Perusahaan Listrik Negara, implemented nine projects, partnering with Chinese firms SinoHydro and Dongfang Electric Corporation to improve power generation and distribution nationwide. Key economic institutions such as Indonesia’s Export-Import Bank (Lembaga Pembiayaan Ekspor Indonesia) and the Ministry of Trade, along with Bank Rakyat Indonesia, implemented multiple projects.
Table 3.5: Top nine implementers of Chinese-funded development projects in Indonesia, 2000-2023
Implementer |
Number of projects |
|
Government of Indonesia |
26 |
|
Perusahaan Listrik Negara (PLN) |
9 |
|
PT Lembaga Pembiayaan Ekspor Indonesia (LPEI) |
9 |
|
World Health Organization (WHO) |
9 |
|
PT Bank Rakyat Indonesia (Persero) Tbk |
6 |
China MCC17 Group Co. |
5 |
|
Indonesia Ministry of Public Works and Housing |
5 |
|
Indonesia Ministry of Trade |
5 |
ZTE Corporation |
5 |
Notes: This table shows the number of projects involving the top nine implementers of Chinese-funded development projects in Indonesia. Only entities that implemented five or more projects were included. Sources: AidData’s Global Chinese Development Finance Dataset, Version 3.0 for 2000-2021 (Custer et al., 2023; Dreher et al., 2022). Supplemented by limited desk research and media article review to identify additional projects and details for 2022-2023.
Another indication of enhanced coordination and alignment between PRC and Indonesian actors is the presence of 52 joint ventures (JVs)[93] or special purpose vehicles (SPVs)[94] involved in PRC-financed development projects in Indonesia. One illustrative example is PT Kereta Cepat Indonesia China (KCIC), a JV between Indonesian and Chinese entities that is responsible for the Jakarta–Bandung HSR. In theory, there are benefits and risks associated with these mechanisms.
Positively, JVs and SPVs allow smaller or specialized entities to expand their markets efficiently (Yu and Tang, 1992), pool risks and share resources (Stuart and Maughn, 2012), and ease the transfer of technology and intellectual property in ways that catalyze innovation (Costa and Forte, 2019). On the negative side, international JVs and SPVs require skilled negotiation and dispute resolution (Miller et al., 1997) and the ability to adjudicate and overcome conflicting incentives, priorities, and strategies across geopolitical boundaries (Yu and Tang, 1992). The risks may be intensified in the case of power asymmetries, as may be the case for PRC-Indonesian JVs and SPVs, given China’s larger resource base with which it can wield influence. When members of JVs or SPVs are state-owned enterprises, these mechanisms can obscure the national debt by keeping certain liabilities off the government’s balance sheet, challenging transparency and accountability (IMF, 2020).
In the social sectors, the PRC has made use of partnerships with local Islamic organizations (e.g., NU CARE-LAZISNU[95] and Muhammadiyah) and multilateral institutions (e.g., the World Health Organization) to implement some of its humanitarian assistance-focused projects. These social sector institutions offer invaluable distribution networks for emergency supplies, particularly in isolated areas. Additionally, such partnerships could provide reputation-enhancing benefits for the PRC, by allowing it to borrow credibility and build goodwill from institutions with strong bases of local support.
Figure 3.6: Recipients and implementers of Chinese-funded
development projects in Indonesia, 2000-2023
|
|
|
Indonesian Government |
|
|
|
|
Other Recipients |
|
|
|
|
Indonesian |
|
|
|
|
Chinese |
|
|
|
|
Other Implementers |
|
Notes: Line weights are based on project counts. This figure illustrates broad trends in ties between top Indonesian recipients of Chinese-funded development projects and their project implementers. It does not represent the entirety of the data on recipients and implementers. Sources: AidData’s Global Chinese Development Finance Dataset, Version 3.0 for 2000-2021 (Custer et al., 2023; Dreher et al., 2022). Supplemented by limited desk research and media article review to identify additional projects and details for 2022-2023.
Of the different supply-side roles, implementers have a more diversified set of sector focus areas than financiers and co-financiers (see Table 3.7 below). However, several revealed areas of priority align with the types of development projects Beijing most often funds. High concentrations of implementers worked in the areas of physical infrastructure (e.g., energy and utilities, construction and real estate, transportation, extractives and mining) and industrial capacity (e.g., industry). This aligns with one of Beijing’s stated motivations for its overseas development finance and the Belt and Road Initiative: to open up raw materials, energy supplies, and export markets for Chinese goods and services through increased connectivity within and between countries (Mathew and Custer, 2023; Hillman and Sacks, 2021).
Table 3.7: Suppliers of Chinese-funded development projects in Indonesia, by sector and role, 2000-2023
The table can be sorted by clicking on a column. On small screens, scroll horizontally to view hidden columns.
|
Entity sector |
Financiers |
Co-financiers |
Implementers |
|---|---|---|---|
|
Agriculture |
0 |
1 |
7 |
|
Construction and real estate |
3 |
1 |
44 |
|
Education |
3 |
0 |
16 |
|
Energy and utilities |
8 |
0 |
29 |
|
Extractives and mining |
2 |
0 |
16 |
|
Financial services |
21 |
201 |
8 |
|
Food, beverage and tobacco |
0 |
0 |
0 |
|
Government |
14 |
1 |
37 |
|
Industry |
1 |
2 |
25 |
|
Social |
0 |
1 |
7 |
|
Telecommunications |
3 |
1 |
6 |
|
Transportation |
3 |
0 |
15 |
|
Water supply and sanitation |
0 |
0 |
3 |
Notes: This table lists the number of financiers, co-financiers, and implementers of Chinese-funded development projects in Indonesia by sector. An entity may serve more than one role. Sources: AidData’s Global Chinese Development Finance Dataset, Version 3.0 for 2000-2021 (Custer et al., 2023; Dreher et al., 2022). Supplemented by limited desk research and media article review to identify additional projects and details for 2022-2023.
3.1.1 Views of Chinese implementers in Indonesia
Over the last two decades, the PRC has financed and delivered infrastructure projects, both physical and digital, at scale in Indonesia and around the world. These projects hold transformative potential for markets and societies, but they are not without risks for the communities proximate to them. Implementers aiming for speedy delivery may overlook protocols to mitigate negative environmental, social, or governance outcomes. Limited transparency and competition in how firms are selected to implement PRC-financed projects can also create perverse incentives to engage in questionable financial practices. Chapter 4 details some of these risks and outcomes at the portfolio level for PRC-funded development in Indonesia. Here we examine this from the perspective of specific implementers.
How risky is it to work with a given supply-side entity on a development project? To assess the risks associated with the entities involved, we used the World Bank’s (n.d.)[96] and the Asian Development Bank’s (n.d.)[97] respective databases on sanctioned, debarred, and suspended firms and individuals. If an entity is currently sanctioned—or has been in the past—it does not prevent them from engaging directly with the government or private companies in Indonesia. The sanctions databases serve merely to evaluate the reputation of these entities with two intergovernmental financial institutions.[98]
Table 3.8: Chinese implementers in Indonesia sanctioned or debarred by the World Bank or the Asian Development Bank, 2000-2025[99]
Entity name |
Sanctioned/debarred by the World Bank or the Asian Development Bank? |
|
Chengdu Engineering Corp., Ltd. (CEC) |
Yes, indirect sanction as an affiliate of PowerChina, which was debarred by ADB for sanction violation |
|
China Construction Botswana Co. Ltd. |
Yes, indirect sanction as an affiliate of CSCEC, debarred by the World Bank for sanctions violation (Reuters, 2009) |
|
China Construction Eighth Engineering Division Corp.,
Ltd. (CCEED)
|
Yes, indirect sanction as an affiliate of CSCEC, debarred by the World Bank for sanctions violation (Reuters, 2009) |
|
China Construction Fourth Engineering Division
Corporation Ltd.
|
Yes, indirect sanction as an affiliate of CSCEC, debarred by the World Bank for sanctions violation (Reuters, 2009) |
|
China Gezhouba Group Cement Co., Ltd. [aff. CEEC, Energy China] |
Yes, indirect sanction as an affiliate of CEEC and Energy China, debarred by the World Bank on the grounds of fraud and corruption |
|
China Gezhouba Group Company Ltd. (CGGC) |
Yes, indirect sanction as an affiliate of CEEC and Energy China, debarred by the World Bank on the grounds of fraud and corruption |
|
China Harbour Engineering Co., Ltd. (CHEC) [aff. CCCC] |
Yes, directly debarred by the World Bank in 2011 |
|
China Railway International Group Co Ltd (CRIG) |
Yes, indirectly sanctioned as an affiliate of the CRCC, debarred by the World Bank in 2019 |
|
China Road and Bridge Corporation (CRBC) |
Yes, directly debarred by the World Bank, along with six other firms and one individual, for eight years, beginning January 12, 2009. |
|
China State Construction Engineering Corp Ltd. (CSCEC) |
Yes, directly debarred by the World Bank for sanctions violation (Reuters, 2009) |
|
CSCEC Road and Bridge Group |
Yes, directly debarred by the World Bank for sanctions violation (Reuters, 2009) |
|
Energy China |
Yes, indirect sanction as an affiliate of CEEC and Energy China, debarred by the World Bank on the grounds of fraud and corruption |
|
Guangdong Power Engineering Corp (GDSBD) |
Yes, indirect sanction as an affiliate of CEEC and Energy China, debarred by the World Bank on the grounds of fraud and corruption |
JO CHEC-CSCEC-HK |
Yes, indirect sanction as an affiliate of CSCEC, debarred by the World Bank for sanctions violation (Reuters, 2009) |
|
Power Construction Corporation of China (PowerChina) |
Yes, directly debarred by ADB for sanction violation |
Notes: Sanctions information was obtained from the World Bank and the Asian Development Bank’s online databases of recorded sanctioned and debarred firms and supplemental press releases from those institutions. Sources: AidData’s Global Chinese Development Finance Dataset, Version 3.0 for 2000-2021 (Custer et al., 2023; Dreher et al., 2022). Supplemented by limited desk research to identify additional projects and details for 2022-2023.
We cross-checked each of the 439 known suppliers of PRC-financed projects in Indonesia (including financiers, co-financiers, and implementers) against the World Bank (n.d.) and Asian Development Bank (n.d.) sanctions databases to identify whether any of these entities were currently or historically debarred or suspended (see Table 3.8 above). Fourteen of the fifteen sanctioned entities operating in Indonesia are Chinese state-owned companies. One is a JV between Hutama Karya (an Indonesian state-owned construction company), the China State Construction Engineering Corporation (CSCEC), and China Harbor Engineering Company (CHEC).
To assess the degree to which there are debates about the performance and contributions of these sanctioned or debarred implementers in the media, we conducted a limited review of articles using the Factiva Dow Jones News and Analytics Database. Strikingly, few media articles profiled either these firms, the PRC-financed development projects they supported in Indonesia, or outcomes for local communities.[100] This (non)-finding is interesting, because it stands in stark opposition to a similar exercise conducted for the Philippines in 2024, where local media coverage and public discourse about PRC-financed development have been more heated and visible (Custer et al., 2024).
Limited and superficial coverage of PRC-financed projects and implementers in Indonesia could reflect lower visibility into these activities or apathy regarding the relevance of past sanctions on present performance. Alternatively, this could be more of a reflection of differences in the Indonesian media environment compared to the Philippines. Local experts interviewed for this research, for example, indicated that while media freedom has improved in the post-Suharto era, the environment is still fraught for journalists.[101] Further analysis on China’s use of state-owned media, diplomatic channels, and social media to influence the narratives on its development projects in Indonesia will be available in an upcoming report later in 2025.
One case in point is local coverage of China State Construction Engineering Corp Ltd. (CSCEC), sanctioned by the WB in 2009 for colluding to fix prices when bidding for a road construction project in the Philippines (Reuters, 2009). This reputational black mark on its profile did not appear to have much influence on media articles about CSCEC-implemented projects in Indonesia, which date back to at least 2005.
Media coverage mentioned examples of CSCEC projects, ranging from a partnership with PT Hexa Prima Mekanikal to build energy infrastructure (IDX Channel, 2024) to the construction of a lithium battery anode factory for PT Indonesia BTR New Energy Material (Perwata, August 2024). CSCEC also attracted positive stories profiling its group bicycling activities to promote environmentally-friendly lifestyles (Sebayang, 2022) and extolling the job creation and investment potential of an MoU between the Batang Industropolis Special Economic Zone and CSCEC to develop the Two Countries Twin Park[102] (Antara, 2025).
3.2 Demand side: Who are the primary recipients of PRC investment projects in Indonesia?
The supply side of Beijing’s development finance, summarized in section 3.1, is only one half of the equation. Those who finance or implement these projects must have willing recipient partners. Between 2000 and 2023, there were 206 known recipients of Chinese-funded development projects in Indonesia, and 87 percent of these entities were Indonesian agencies or organizations. Forty-seven percent of the recipients of PRC-funded development projects were associated with the physical infrastructure (construction and real estate, energy and utilities, extractives and mining, transportation) or telecommunications sectors (Figure 3.9). Other prominent recipient sectors include industry (15 percent), financial services (11 percent), government (10 percent), and education (7 percent).
Figure 3.9: Indonesian recipients of Chinese funding by sector, 2000-2023

Notes: This figure illustrates the number of direct and indirect recipients—the demand side—of Chinese development finance in Indonesia by sector. Sources: AidData’s Global Chinese Development Finance Dataset, Version 3.0 for 2000-2021 (Custer et al., 2023; Dreher et al., 2022). Supplemented by limited desk research and media article review to identify additional projects and details for 2022-2023.
Beijing most frequently partnered with Indonesian private sector actors (see Table 3.10 below) in the extractives and mining, telecommunications, and financial services sectors. Indonesian public sector players—including line ministries, local governments, state-owned enterprises, commercial banks, and public universities—were common recipients. There were 13 Islamic organizations and groups (including mosques, faith-based NGOs, and educational institutions) on the list of recipients. Beijing’s cultivation of this category of local partners could hold strategic importance, as a form of religious diplomacy to win favor with Muslim communities and deter international criticism over its domestic policies related to Uyghurs’ human rights in Xinjiang province (Rakhmat, 2022). Notably, this relationship building was not limited to money but also included scholarships for Muslim students and visits to China for the leadership of more prominent Muslim organizations.
In prior research, we found that PRC development finance favored recipients who had affinity for the Chinese language, culture, or had diaspora ties to the mainland (Custer et al., 2024). This pattern holds in Indonesia, albeit more muted than in the Philippines.[103] Forty-four direct recipients of Chinese funding had notable language, culture, or diaspora ties. These included Indonesian universities that hosted Confucius Institutes, Chinese technology companies, and JVs/SPVs sponsoring Mandarin language training as part of their corporate social responsibility. Additionally, 34 direct recipients had ownership ties to Chinese companies or individuals. This group included companies and JVs/SPVs with a Chinese majority stakeholder. Sinar Mas Group, which was named as a recipient in multiple projects along with its subsidiaries, is one example. One of Indonesia’s largest conglomerates,[104] Sinar Mas Group was founded by Eka Tjipta Widjaja, who emigrated from China as a child.
Table 3.10: Recipients of Chinese-funded development projects in Indonesia, 2000-2023
Notes: This figure illustrates the number and types of entities that received Chinese development funding in Indonesia. Sources: AidData’s Global Chinese Development Finance Dataset, Version 3.0 for 2000-2021 (Custer et al., 2023; Dreher et al., 2022). Supplemented by limited desk research and media article review to identify additional projects and details for 2022-2023.
Beijing has a history of subnational targeting to prioritize natural resource-rich and politically strategic regions in its global development finance (Escobar et al., 2025). This trend holds in Indonesia. Sixty-eight percent of Indonesian recipients are located in the Jakarta Special Capital Region (see Table 3.11 below).[105] This is not entirely surprising, given that most financial institutions, corporate offices, and central government ministries tend to be headquartered in the historical capital.
Other provinces in Indonesia that emerged as subnational priorities for Chinese financiers included East Java (14 recipients), Central Java (7 recipients), West Java (9 recipients), North Sumatra (11 recipients), and South Sumatra (8 recipients).[106] These revealed preferences highlight another pattern of the PRC’s overseas development finance: channeling money to the home constituencies of the president (Dreher et al., 2022). Indonesia’s current President, Prabowo Subianto, and his predecessors, Joko Widodo and Susilo Bambang Yudhoyono, have strong familial ties to Java.
Java’s significance becomes more apparent if we consider how provinces in this region attract other forms of PRC public diplomacy, which aims to cultivate people-to-people ties with local leaders and publics. In our analysis, we considered the subnational distribution of several standard instruments of PRC public diplomacy: Confucius Institutes, Luban Workshops, and sister city agreements (see Table 3.11 below). Java was among the most common destinations for these activities to win hearts and minds. Its four provinces and two special capital regions collectively attracted 28 of the PRC’s public diplomacy overtures, roughly 60 percent of its portfolio across the country.[107]
Table 3.11: Recipients of Chinese-funded development projects and Chinese public diplomacy overtures by region, 2000-2023
The table can be sorted by clicking on a column. On small screens, scroll horizontally to view hidden columns.
|
Region |
Province |
Number of recipients |
Number of overtures |
|---|---|---|---|
|
Java |
Banten |
7 |
0 |
|
Java |
Central Java |
7 |
4 |
|
Java |
East Java |
14 |
11 |
|
Java |
Jakarta Special Capital Region |
181 |
2 |
|
Java |
Special Region of Yogyakarta |
2 |
1 |
|
Java |
West Java |
9 |
10 |
|
Kalimantan |
Central Kalimantan |
1 |
0 |
|
Kalimantan |
East Kalimantan |
2 |
0 |
|
Kalimantan |
North Kalimantan |
1 |
0 |
|
Kalimantan |
South Kalimantan |
1 |
2 |
|
Kalimantan |
West Kalimantan |
1 |
4 |
|
Maluku Islands |
Maluku |
1 |
1 |
|
Bali |
Bali |
3 |
4 |
|
Nusa Tenggara |
East Nusa Tenggara |
0 |
1 |
|
Nusa Tenggara |
West Nusa Tenggara |
1 |
0 |
|
Papua |
Papua |
1 |
0 |
|
Papua |
West Papua |
1 |
0 |
|
Sulawesi |
Central Sulawesi |
2 |
0 |
|
Sulawesi |
Gorontalo |
1 |
0 |
|
Sulawesi |
North Sulawesi |
3 |
0 |
|
Sulawesi |
South Sulawesi |
4 |
2 |
|
Sumatra |
Bengkulu |
1 |
0 |
|
Sumatra |
Jambi |
1 |
0 |
|
Sumatra |
North Sumatra |
11 |
1 |
|
Sumatra |
Riau |
2 |
2 |
|
Sumatra |
Riau Islands |
1 |
1 |
|
Sumatra |
South Sumatra |
8 |
1 |
|
Sumatra |
West Sumatra |
1 |
1 |
Notes: This table shows the number of organizations from a subnational region named as recipients of Chinese development finance projects. Public diplomacy overtures record the number of recipients from that same region that received one or more of the following: a Confucius Institute or Classroom, a sister city/province agreement, or a Luban Workshop. Sources: AidData’s Global Chinese Development Finance Dataset, Version 3.0 for 2000-2021 (Custer et al., 2023; Dreher et al., 2022). AidData Global Chinese Public Diplomacy Dataset, 2021. Supplemented by limited desk research and media article review to identify additional projects and details for 2022-2023.
3.2.1 Which firms and agencies have the greatest exposure to Beijing?
Indonesian state-owned enterprises and JVs/SPVs in four sectors—transportation, energy and utilities, extractives and mining, and financial services—attract a significant share of PRC development finance. Kereta Cepat Indonesia China (KCIC), the joint venture responsible for the Jakarta–Bandung High Speed Rail, received more funding than the next three highest-paid recipients combined. Other state-owned enterprises, such as Perusahaan Listrik Negara (the national electric company), PT Bank Rakyat Indonesia, and Garuda Indonesia (the national airline), were among the largest recipients.
Indonesian SOEs or specific government agencies may be the legal borrower or direct beneficiary of a PRC development finance project. However, this does not imply complete autonomy of action. From 2018 to 2024, Indonesia’s Coordinating Ministry for Maritime and Investment Affairs (Kemenko Marves) provided strategic direction and risk management in multiple projects. All prospective development projects were reviewed by the Indonesia-China Joint Steering Committee (JSC) before an individual SOE or government ministry could sign on to a loan or joint venture agreement. Once cleared by the JSC, the Ministry of Finance would assess fiscal risk and, as needed, issue a sovereign guarantee before the debt is booked on the SOE’s balance sheet.
Cooperation is sometimes less successful between national and local levels. Experts interviewed for this research noted that local governments sometimes feel sidelined and uninformed about PRC-financed projects in their regions. Meanwhile, national processes are not immune to indirect influence. Beijing’s support for the Del Institute of Technology is a case in point. Del Institute is a higher education foundation in North Sumatra established by Luhut Binsar Pandjaitan, the former Coordinating Minister of Maritime Affairs and Investment under President Widodo. The Institute received a donation of books and tables from the Chinese embassy in 2018, and Chinese universities were invited to engage in research cooperation with the Institute in 2024.
The biggest funding recipients (in dollars) are not necessarily those with the highest number of projects. This phenomenon is not unique to Indonesia, as the PRC bankrolls many small-dollar goodwill projects globally in the social and educational sectors alongside fewer, more expensive megaprojects in power generation, critical mineral extraction, and mass transport. Only 7 percent of recipient entities were involved in five or more projects, while two-thirds participated in a single project (see Table 3.13).
Six entities defied the odds by receiving large and frequent infusions of Beijing’s development finance. This exclusive class includes: the Government of Indonesia (ministry unspecified), Perusahaan Listrik Negara, Lembaga Pembiayaan Ekspor Indonesia (LPEI), Bank Rakyat Indonesia, Garuda Indonesia, and two private telecom companies (Smart Telecom and Smartfren). Combined with Sinar Mas Group (the parent company), subsidiaries Smart Telecom and Smartfren would rank fourth on the list of highest-paid recipients.[108] Indonesian state-owned enterprises were often recipients of funding, but so too were powerful private sector conglomerates like the Bakrie Group (Bumi Resources, Bakrie Telecom, and Bakrie Autoparts) and subsidiaries of Chairul Tanjung’s CT Corp (Trans Retail Indonesia and Trans Media Corpora).
Table 3.12: Top 15 recipients of Chinese funding in Indonesia by dollar value, 2000-2023
Entity name |
Entity type |
Sector |
Chinese funding, USD millions |
|
Kereta Cepat Indonesia China (KCIC) |
Joint venture/special purpose vehicle |
Transportation |
22,525 |
|
Government of Indonesia |
National government |
Government |
8,478 |
|
Perusahaan Listrik Negara (PLN) |
State-owned company |
Energy and utilities |
7,494 |
|
Bumi Resources Tbk (Bumi) |
Private sector |
Extractives and mining |
3,981 |
|
Japan International Finance Management (Tangguh) Corporation |
Joint venture/special purpose vehicle |
Financial services |
3,667 |
|
Sumber Segara Primadaya (S2P) |
Joint venture/special purpose vehicle |
Energy and utilities |
3,446 |
Garuda Indonesia |
State-owned company |
Transportation |
2,456 |
|
OKI Pulp and Paper Mills (OKI) |
Joint venture/special purpose vehicle |
Industry |
2,271 |
|
Smart Telecom (Smartel) + Smartfren |
Private sector |
Telecommunications |
2,229 |
Aneka Tambang Tbk |
State-owned company |
Extractives and mining |
2,061 |
Sinar Mas Group |
Private sector |
Financial services |
1,896 |
|
Bank Rakyat Indonesia (Persero) Tbk |
State-owned bank |
Financial services |
1,809 |
|
Shenhua Guohua Power Jawa Bali |
Joint venture/special purpose vehicle |
Energy and utilities |
1,742 |
|
Huadian Bukit Asam Power (HBAP) |
Joint venture/special purpose vehicle |
Energy and utilities |
1,536 |
|
Lembaga Pembiayaan Ekspor Indonesia (LPEI) |
State-owned bank |
Financial services |
1,489 |
Notes: This table ranks the top 15 recipients of Chinese development funding. Smart Telecom (Smartel) and Smartfren, both telecom subsidiaries of the Sinar Mas Group (also listed, separately), have been aggregated in this table. Sources: AidData’s Global Chinese Development Finance Dataset, Version 3.0 for 2000-2021 (Custer et al., 2023; Dreher et al., 2022). Supplemented by limited desk research and media article review by the research team to identify additional projects and details for 2022-2023
Table 3.13: Top 15 recipients of Chinese development funding in Indonesia by project count, 2000-2023
|
Entity name |
Entity type |
Project count |
Chinese funding, USD millions |
|---|---|---|---|
|
Government of Indonesia* |
National government |
77 |
8,478 |
|
Perusahaan Listrik Negara (PLN)* |
State-owned company |
19 |
7,494 |
|
Lembaga Pembiayaan Ekspor Indonesia (LPEI)* |
State-owned bank |
10 |
1,489 |
|
Bank Rakyat Indonesia (Persero) Tbk* |
State-owned bank |
8 |
1,809 |
|
Solusi Tunas Pratama (STP) |
Private sector |
8 |
62.5 |
|
World Health Organization (WHO) |
Intergovernmental organization |
8 |
5.94 |
|
Garuda Indonesia* |
State-owned company |
6 |
2,456 |
|
Profesional Telekomunikasi Indonesia (Protelindo) |
State-owned company |
6 |
229 |
|
Smart Telecom (Smartel) + Smartfren Telecom Tbk* |
Private sector |
6 |
2,229 |
|
Medco Energi Internasional Tbk |
Private sector |
5 |
102.6 |
|
MNC Cable Mediacom (MKM) |
Private sector |
5 |
335 |
|
MNC Finance (MNCF) |
Private sector |
5 |
20.97 |
|
Pertamina (Persero) |
State-owned company |
5 |
493 |
|
Radana Bhaskara Finance Tbk (formerly PT HD Finance Tbk) |
Private sector |
5 |
41.05 |
|
Trans Retail Indonesia |
State-owned company |
5 |
279 |
Notes: This table ranks the top 15 recipients of Chinese development funding by project count. Entities followed by an asterisk also appeared in the top 15 entities with the largest dollar amounts of Chinese funding (Table 3.12, above). Smart Telecom (Smartel) and Smartfren, both telecom subsidiaries of the Sinar Mas Group, have been aggregated in this table. Sources: AidData’s Global Chinese Development Finance Dataset, Version 3.0 for 2000-2021 (Custer et al., 2023; Dreher et al., 2022). Supplemented by limited desk research and media article review to identify additional projects and details for 2022-2023.
4. Outcomes
Key insights in this chapter:
- Within Beijing’s portfolio, energy and transport projects are the riskiest propositions, with more delivery delays and negative ESG exposure
- More than 40 percent of Beijing’s development finance portfolio (US$30 billion) in Indonesia relied on risky implementers, based on our measures
- Beijing faces an uphill battle in converting money into reputational gains: public approval ratings are declining, while elites are wary of its influence
- Indonesians may be redefining what it means for democracy to deliver, emphasizing economic development over political rights in ways that are conducive to Beijing’s preferred narratives and value proposition
China’s willingness to finance large-scale infrastructure presents opportunities and risks. These investments can help accelerate progress toward a country’s development goals: expanding access to essential services, boosting agricultural and industrial productivity, and enhancing connectivity via upgraded roads, ports, and railways. Nevertheless, such projects may carry significant downsides: degrading sensitive ecosystems, displacing poor and Indigenous populations, and weakening governance via increased corruption and reduced transparency. As Indonesia moves toward OECD accession, there may be opportunities to promote greater accountability through mechanisms like the OECD’s Common Reporting Standard (CRS), which can enhance transparency in development finance.
In this chapter, we assess Beijing’s performance as a development partner in Indonesia—to what extent does it follow through on its commitments, how does it manage the risk of public harm from its projects, and what early indications signal potential long-term outcomes? To answer these questions, we leverage AidData’s project-level data on PRC development finance,[109] paired with supplemental desk research and information on environmental, social, and governance risk mitigation measures in PRC-financed projects.
4.1. To what degree does China follow through on promised investments on time and in line with its advertised commitments?
Beijing’s development finance investments in Indonesia have been championed by government officials and media outlets for their transformative potential to generate high-value jobs, increase trade flows, and drive gains in economic productivity. Yet this potential hinges on Beijing’s ability to deliver on its commitments: advancing projects from initial pledges to tangible outcomes.
Given the PRC’s tendency to fund large-scale, technically complex, and politically sensitive infrastructure, such follow-through is often challenging and protracted. In this section, we evaluate Beijing’s ability to follow through on its promises from two angles: the average time it takes to move from funding commitment to project delivery (section 4.1.1) and the frequency of project suspensions or cancellations (section 4.1.2).
4.1.1 From commitments to delivery: How fast does the money move?
Beijing is often lauded for delivering infrastructure projects quickly. However, the story in Indonesia is more uneven: there is wide variation in how consistently investments are implemented on time and in line with advertised commitments. PRC-financed projects across Indonesia take an average of 2.5 years to move from funds committed to projects delivered: 155 days from commitment to begin implementation and 706 days from implementation start to completion. This delivery schedule is considerably slower than in peer ASEAN countries like the Philippines (see Custer et al., 2024). Table 4.1 below breaks down the average wait times at each project phase.
These averages can conceal dramatic subnational differences.[110] In provinces like Bengkulu, Gorontalo, and Jambi, the average PRC-financed development project took more than five years to complete (from commitment to completion). The degree to which project locations are easily accessible and benefit from strong local infrastructure could be a factor in delays. However, that does not explain the slower-than-expected delivery of projects in provinces like Central or West Java, which took about three years, on average. On the opposite end of the spectrum, projects in Central Papua demonstrate a breakneck pace that stands out, breaking ground and wrapping up within a matter of weeks.[111] Projects in Aceh and Yogyakarta also tended to have a more expedited time frame, moving from start to finish well under a year.
The types of delays are also not necessarily uniform across provinces. In cases like Riau Islands (830 days) and South Kalimantan (457 days), PRC-financed development projects hit early snags due to delays between the initial commitment of funds (often the signing of an MOU or another agreement) and when project activities commenced. Other projects may have gotten off to a quick start, only to face slowdowns during implementation. East Kalimantan is a case in point: its five projects had the longest wait times in implementation (3877 days), despite getting off the ground reasonably quickly (139 days), on average.
Table 4.1: Average time between stages of PRC-funded development projects in Indonesia, 2000-2022
The table can be sorted by clicking on a column. On small screens, scroll horizontally to view hidden columns.
|
Province |
Commitment → implementation (days) |
Implementation → completion (days) |
Commitment → completion (days) |
Projects with incomplete timing data |
|---|---|---|---|---|
|
Indonesia, nationally |
155 |
706 |
678 |
381 |
|
Aceh |
136 |
248 |
312 |
3 |
|
Bali |
163 |
545 |
591 |
4 |
|
Banten |
400 |
1332 |
1027 |
16 |
|
Bengkulu |
126 |
1952 |
2078 |
0 |
|
Central Java |
150 |
1188 |
1132 |
6 |
|
Central Kalimantan |
- |
- |
- |
1 |
|
Central Papua |
16 |
6 |
21 |
0 |
|
Central Sulawesi |
188 |
638 |
654 |
11 |
|
East Java |
142 |
1010 |
816 |
18 |
|
East Kalimantan |
139 |
3877 |
970 |
5 |
|
East Nusa Tenggara |
0 |
0 |
0 |
1 |
|
Gorontalo |
276 |
1562 |
1838 |
1 |
|
Jakarta Special Capital Region |
286 |
612 |
505 |
17 |
|
Jambi |
276 |
1562 |
1838 |
0 |
|
Lampung |
120 |
1290 |
864 |
1 |
|
Maluku |
- |
- |
- |
1 |
|
North Kalimantan |
334 |
- |
- |
3 |
|
North Maluku |
124 |
874 |
1210 |
6 |
|
North Sulawesi |
305 |
1495 |
1002 |
5 |
|
North Sumatra |
101 |
768 |
663 |
15 |
|
Papua |
0 |
0 |
0 |
1 |
|
Riau |
- |
2821 |
995 |
3 |
|
Riau Islands |
830 |
611 |
1441 |
2 |
|
South Kalimantan |
457 |
976 |
1126 |
4 |
|
South Sulawesi |
60 |
1040 |
838 |
2 |
|
South Sumatra |
81 |
991 |
877 |
7 |
|
Southeast Sulawesi |
97 |
1144 |
1241 |
2 |
|
Special Region of Yogyakarta |
139 |
14 |
188 |
1 |
|
West Java |
280 |
1415 |
1126 |
19 |
|
West Kalimantan |
179 |
1624 |
1328 |
4 |
|
West Nusa Tenggara |
0 |
0 |
592 |
2 |
|
West Papua |
- |
1588 |
630 |
5 |
|
West Sumatra |
- |
- |
1317 |
3 |
Notes: Given the limitations of publicly available information, not every PRC-financed project is geocoded at the province level. Some projects are missing implementation or completion dates; in these instances, the averages from commitment to completion do not perfectly align. Dashes indicate provinces where only partial date information is available, preventing the calculation of average durations for one or more phases. Sources: AidData’s Global Chinese Development Finance Dataset, Version 3.0 (Custer et al., 2023; Dreher et al., 2022).
As described in Chapter 2, Beijing bankrolls development projects in diverse sectors. This raises the possibility that what is being built could be equally or more consequential than where it is built, influencing how fast PRC-financed projects break ground and get delivered. Table 4.2 below breaks down the average number of days between key stages of the project lifecycle—commitment, implementation, and completion—for each sector.
Overall, Beijing appears capable of delivering quick results in narrowly targeted sectors or emergency contexts, but experiences more significant delays when delivering large-scale infrastructure projects. Sectors highly associated with physical and digital infrastructure (e.g., energy, transport, telecommunications) saw significant delays of more than 1,000 days between commitment and completion. This makes intuitive sense: these complex projects involve several factors (land acquisition, environmental assessments, coordination across contractors, and local capacity to absorb large-scale investments) that can push timelines beyond expectation. By contrast, the short-term, time-sensitive nature of food aid or emergency response may explain why projects in these sectors were comparatively much faster.
One of Beijing’s flagship projects, the Jakarta–Bandung High-Speed Rail, is a good example of how complexity can confound ambitious plans. Announced in 2015, the project became mired in delays related to challenges in land acquisition, environmental reviews, and COVID-19 (see Box 2 in Chapter 2). Completion, initially slated for 2019, was pushed back to October 2023. Costs similarly mushroomed, rising from US$4.3 billion to US$7.3 billion (Ibrahim and Karmini, 2023). As one expert who was interviewed noted, the project may have been driven more by ambition than economic rationale, citing overinflated expectations but a lack of realized benefits.
Table 4.2: Average time between stages of PRC-funded development projects in Indonesia by sector, 2000-2022
The table can be sorted by clicking on a column. On small screens, scroll horizontally to view hidden columns.
|
Sector name |
Commitment → implementation (days) |
Implementation → completion (days) |
Commitment → completion (days) |
Projects with incomplete timing data |
|---|---|---|---|---|
|
Action relating to debt |
- |
2070 |
597 |
10 |
|
Agriculture, forestry, fishing |
195 |
1173 |
1440 |
8 |
|
Banking and financial services |
0 |
- |
1100 |
20 |
|
Business and other services |
8 |
96 |
197 |
34 |
|
Developmental food aid/food security assistance |
0 |
0 |
102 |
4 |
|
Education |
85 |
84 |
204 |
17 |
|
Emergency response |
72 |
14 |
87 |
12 |
|
Energy |
194 |
1583 |
1566 |
39 |
|
General environmental protection |
345 |
0 |
345 |
0 |
|
Government and civil society |
72 |
0 |
72 |
4 |
|
Health |
132 |
20 |
218 |
8 |
|
Industry, mining, construction |
319 |
1240 |
1035 |
62 |
|
Other multisector |
306 |
1158 |
710 |
13 |
|
Other social infrastructure and services |
804 |
- |
- |
7 |
|
Reconstruction relief and rehabilitation |
571 |
30 |
822 |
1 |
|
Telecommunications |
308 |
835 |
1825 |
16 |
|
Trade policies and regulations |
- |
- |
486 |
6 |
|
Transport and storage |
161 |
1696 |
1088 |
36 |
|
Unallocated/unspecified |
0 |
776 |
776 |
25 |
|
Water supply and sanitation |
- |
- |
714 |
2 |
Notes: Zeros denote imperceptible wait times between project stages, suggesting that these projects were likely implemented and completed almost immediately. Dashes indicate sectors where only partial date information is available, preventing the calculation of average durations for one or more phases. This table includes all sectors with at least some available date data; sectors with entirely missing information are excluded. Sources: AidData’s Global Chinese Development Finance Dataset, Version 3.0 (Custer et al., 2023; Dreher et al., 2022).
Variation in project timelines can also be shaped by the type of financing used. Aid-like assistance (e.g., grants, in-kind support, and no- or low-interest loans) can move quickly through the project cycle. On average, these projects are completed in 294 days, with minimal time between commitment, implementation, and delivery (see Table 4.3 below). Debt-like assistance (commercially-oriented, less concessional loans) has more protracted timelines, averaging over 1,000 days from commitment to completion.
Table 4.3: Average time between stages of PRC-funded development projects in Indonesia by flow type, 2000-2022
|
Flow class |
Commitment → implementation (days) |
Implementation → completion (days) |
Commitment → completion (days) |
Projects with incomplete timing data |
|---|---|---|---|---|
|
ODA-like |
95 |
129 |
294 |
54 |
|
OOF-like |
210 |
1267 |
1007 |
239 |
|
Vague (official finance) |
71 |
1168 |
1013 |
31 |
Sources: AidData’s Global Chinese Development Finance Dataset, Version 3.0 (Custer et al., 2023; Dreher et al., 2022).
This underscores an important point: longer implementation periods are not always indicative of delays due to poor execution or lack of commitment. As discussed in Chapter 2, Beijing typically employs a two-track model for its development finance projects. It often pairs big-ticket infrastructure projects financed with debt alongside goodwill social sector projects financed with aid. In this respect, it is unsurprising that Beijing can deliver more quickly on aid-like activities (e.g., donating supplies, providing training, and supplying emergency funds) than syndicated loans to support commercially-oriented projects like power plants, roads, and rail.
4.1.2 Failure to deliver? Project suspensions and cancellations
In addition to speed of delivery, another way to assess follow-through is by monitoring whether planned development projects are suspended or cancelled along the way. Suspensions and cancellations can and do occur in PRC-financed development projects. One of Indonesia’s ASEAN neighbors, the Philippines, had at least six cases each of suspended or cancelled projects (Custer et al., 2024). When these instances occur, they can signal waning appetite on the part of Beijing or misgivings among local counterparts about proceeding according to plan.
Notably, Indonesia had a lower level of project attrition, with only one known case of a suspended PRC-financed development project between 2000 and 2022. In 2008, China Eximbank issued a concessional loan valued at RMB 1.8 billion (approximately US$240 million) to support Indonesia’s state-owned Merpati Nusantara Airlines in acquiring fifteen MA60 aircraft from China’s Xi'an Aircraft Industrial Corporation (Custer et al., 2023; Dreher et al., 2022). The National Air Bridge Project, as it was named, was intended to strengthen regional air connectivity. Financing was offered with favorable terms, including a 2.5 percent interest rate, a 14.5-year maturity, and a five-year grace period.
After delivery of just two aircraft, the project was suspended, even though roughly 86 percent of the loan had already been disbursed. The breakdown stemmed from both supply-side and demand-side challenges. China Eximbank halted further disbursements after Merpati failed to meet its contractual payment obligations. Seeking to pressure the Indonesian government to help resolve the dispute, China Eximbank, China Development Bank, and the Bank of China jointly suspended disbursements to unrelated PRC-financed projects in Indonesia. This episode prompted a high-level diplomatic delegation to Beijing. Ultimately, Merpati’s deepening financial distress derailed the project, despite temporary government intervention. Limited commercial viability, weak institutional management, and creditor pressure eventually led the Indonesian government to abandon plans to revive the airline in 2015.
Compared with the Philippines, where multiple projects were derailed due to governance failures, legal disputes, and political unrest, Beijing’s Indonesia portfolio appears to have experienced fewer disruptions and invited less political scrutiny (Custer et al., 2024). This may or may not be a good thing. One expert interviewed for this project argued that PRC-financed projects may be seen as too big to fail, explaining: “It’s hard for the government to say no to Chinese projects, as they are too large to be let go or closed down.” This can be especially when projects are designated as part of Indonesia’s Proyek Strategis Nasional (PSN), which prioritizes high-impact infrastructure.
4.2. How are PRC investment projects implemented within and experienced by recipient communities in Indonesia?
Beijing’s development finance projects have made meaningful contributions to supporting Indonesia in expanding its industrial base and improving infrastructure. At the same time, we have identified numerous instances where Beijing’s projects have faced delays, failed to materialize, or sparked public concern. In this section, we analyze the environmental, social, and governance (ESG) risks associated with PRC-financed projects in Indonesia—risks that, when realized, can have important implications for recipient communities (section 4.2.1). We additionally assess risks related to Beijing’s preference for contracting Chinese firms as implementers, using various performance metrics (section 4.2.2).
4.2.1 Early warning indicators of ESG risk in PRC-financed projects
Major investments in infrastructure and key industries—whether initiated by local governments, private companies, or development partners like China—can reshape communities in profound ways. While such projects hold transformative potential, they also carry substantial risks, particularly regarding ESG outcomes. To mitigate these risks, leading development actors such as the World Bank have established stringent ESG safeguards, applying them from project design through implementation.
Beijing is frequently criticized for favoring speed and cost-efficiency over strong ESG performance in its overseas development finance (Parks et al., 2023). Yet, distinguishing objective fact from subjective perception is not straightforward. To address this gap, Parks et al. (2023) introduced a structured methodology to evaluate how Chinese state-owned financiers incorporate ESG risk management protocols into the projects they support.
Their framework consists of 27 criteria assessing whether projects include: (i) clear ESG rules and standards; (ii) oversight mechanisms to ensure compliance; and (iii) enforcement provisions to respond to violations. These criteria span eight environmental, seven social, and twelve governance safeguards, offering a comprehensive lens for evaluating ESG risk as of 2021, the most recent year for which data is available (see the Technical Appendix for more details).
Over half of the PRC’s global development finance portfolio (by dollar value) is associated with at least one type of ESG risk (Parks et al., 2023). Indonesia fares somewhat better than the global average, but not by a wide margin: 26 percent of its projects carry some form of ESG risk (Figure 4.4). Indonesia’s exposure to environmental and social risks is slightly below the global average. Its exposure to governance risk is dramatically lower.
Figure 4.4: Percentage of the PRC’s development finance portfolio facing ESG risks in Indonesia versus the global average, 2000-2021

Notes: This figure compares average ESG risk levels for all other recipients in AidData’s GCDF 3.0 dataset globally versus Indonesia. This data is only available through 2021. Sources: Methodology adapted from Parks et al. (2023), as applied to AidData’s Global Chinese Development Finance Dataset, Version 3.0 (Custer et al., 2023; Dreher et al., 2022).
Several factors could help explain this divergence. The Indonesian government may have stronger mechanisms than its global peers to monitor and manage governance risks in externally funded projects. Alternatively, the composition of China’s portfolio in Indonesia could skew toward sectors less prone to governance challenges, such as infrastructure projects with state-owned implementers rather than public-private partnerships. Over time, Chinese lenders have gradually strengthened their ESG practices (Parks et al., 2023), so the relatively newer vintage of many PRC-financed projects could also contribute to these lower risk profiles in Indonesia.
It is important to note that lower recorded risk does not necessarily mean lower actual risk—variation in disclosure quality or risk detection could also be at play. Some observers argue that PRC-financed development projects frequently bypass environmental due diligence altogether. One interviewee contrasted Beijing’s practice with that of other foreign investors, stating that the PRC is quite willing to proceed without environmental assessments in its projects, unlike Japan, which routinely applies such requirements.
To what extent is Beijing learning from past mistakes and improving ESG safeguards in its Indonesia portfolio over time? The data tells a story of uneven progress. Most years saw relatively few PRC-financed projects flagged for ESG risks. Two years, 2016 and 2017, were outliers, as a few large projects triggered serious environmental, social, and, at times, governance alarm bells (Table 4.5 below). ESG risks were not evenly spread across Beijing’s portfolio; instead, they were overwhelmingly concentrated in the energy and transport sectors (Table 4.6 below). This suggests ESG compliance may not be consistent across all sectors or project implementers.
Flagged in six different years, energy projects were frequent offenders for both environmental (e.g., air pollution and flooding) and social (e.g., safety incidents and displacement) risks. In one example, Batam residents demanded that the Tanjung Kasam coal-fired power plant, financed by China Eximbank, be shut down after the installation released large volumes of ash, leading to respiratory and skin ailments (Custer et al., 2023; Dreher et al., 2022). The Sorik Marapi geothermal power project is another cautionary tale: a high-pressure burst of hydrogen sulfide gas killed five people and injured 24 others in 2021 (ibid). The disaster highlighted lapses in risk management and emergency response.
Table 4.5: PRC-funded development projects in Indonesia with newly identified ESG risks, 2000-2021
The table can be sorted by clicking on a column. On small screens, scroll horizontally to view hidden columns.
|
Year |
At least 1 ESG risk |
Environmental |
Social |
Governance |
Sum of ESG component |
|---|---|---|---|---|---|
|
2000 |
0 |
0 |
0 |
0 |
0 |
|
2001 |
0 |
0 |
0 |
0 |
0 |
|
2002 |
0 |
0 |
0 |
0 |
0 |
|
2003 |
0 |
0 |
0 |
0 |
0 |
|
2004 |
0 |
0 |
0 |
0 |
0 |
|
2005 |
0 |
0 |
0 |
0 |
0 |
|
2006 |
0 |
0 |
1 |
0 |
0 |
|
2007 |
0 |
0 |
0 |
0 |
0 |
|
2008 |
5 |
1 |
1 |
4 |
6 |
|
2009 |
0 |
0 |
0 |
0 |
0 |
|
2010 |
0 |
0 |
0 |
0 |
0 |
|
2011 |
0 |
0 |
0 |
0 |
0 |
|
2012 |
2 |
1 |
2 |
0 |
3 |
|
2013 |
1 |
0 |
1 |
0 |
1 |
|
2014 |
0 |
0 |
0 |
0 |
0 |
|
2015 |
0 |
0 |
0 |
0 |
0 |
|
2016 |
3 |
2 |
3 |
0 |
5 |
|
2017 |
7 |
7 |
7 |
0 |
14 |
|
2018 |
0 |
0 |
0 |
0 |
0 |
|
2019 |
1 |
1 |
1 |
0 |
2 |
|
2020 |
1 |
1 |
0 |
0 |
1 |
|
2021 |
0 |
0 |
0 |
0 |
0 |
Notes: Methodology adapted from Parks et al. (2023), as applied to AidData’s Global Chinese Development Finance Dataset, Version 3.0 (Custer et al., 2023; Dreher et al., 2022) for all Indonesian projects. This data is only available until 2021.
The transport sector also included several high-risk projects, most notably the Jakarta–Bandung High-Speed Rail, a US$5.29 billion initiative co-financed by the China Development Bank (Custer et al., 2023; Dreher et al., 2022). The project faced criticism over flawed environmental assessments, worker fatalities, and community disruption (ibid). Additionally, it was associated with severe flooding, compromised drainage, and collateral damage to nearby homes (ibid).
Other sectors, like industry, mining, and construction, accounted for fewer risks but still registered ESG concerns, particularly around labor conditions and protests by affected communities. Governance risks were comparatively rare, occurring only once, in a 2008 energy project involving alleged embezzlement during land acquisition. However, this lower frequency could suggest that procedural irregularities may be harder to detect or are less often documented.
Table 4.6: ESG risks in PRC-funded development projects in Indonesia by sector, 2000-2021
Commitment year |
Sector |
ESG risk |
2008 |
Energy |
E, S, G |
2012 |
Transport |
E, S |
2012 |
Energy |
S |
2013 |
Energy |
S |
2016 |
Energy |
E, S |
2016 |
Industry, mining, construction |
S |
2017 |
Energy |
E, S |
2017 |
Transport |
E, S |
2019 |
Industry, mining, construction |
E, S |
2020 |
Energy |
E |
Notes: This table shows ESG risks detected by year and then by sector in Indonesia. Years excluded from the table had no known projects from our sample showing ESG risk that year. This data is only available until 2021. Sources: Methodology adapted from Parks et al. (2023) as applied to AidData’s Global Chinese Development Finance Dataset, Version 3.0 (Custer et al., 2023; Dreher et al., 2022) for all Indonesia’s projects.
4.2.2 Exposure to performance risk in Chinese-financed projects
The ability of Chinese implementers to deliver PRC-financed development projects in Indonesia on time and responsibly varies widely. The choice of implementer is therefore not a trivial one—it can have significant implications for project success and the well-being of communities affected by construction and land use. In this section, we analyze how Chinese firms compare across three dimensions of performance risk: (i) timeliness of delivery from start to completion; (ii) exposure to ESG risks; and (iii) history of financial misconduct, as captured by sanctions from major multilateral development banks.
Some implementers experienced moderate delays; others performed far worse. For instance, PT Kereta Cepat Indonesia China (KCIC), the joint venture behind the Jakarta–Bandung High-Speed Rail, recorded an average delay of 1,295 days, over three and a half years behind schedule. Chinese firms, including Dongfang Electric Corporation (DEC), Suzhou Thvow Technology Co., Ltd., China Harbour Engineering Company (CHEC), and China Road and Bridge Corporation (CRBC), faced delays of several hundred days each (see Table 4.7 below). These patterns suggest persistent challenges across a range of state-owned and joint venture actors.
Thirteen top implementers of PRC-financed projects in Indonesia were previously sanctioned (directly or through a parent company) by the World Bank or Asian Development Bank for fraudulent or corrupt practices. Others were flagged in Parks et al. (2023) for significant ESG risks, such as weak environmental safeguards or adverse social impacts on local populations. Given the scale and strategic importance of PRC development finance in Indonesia, these performance issues are non-negligible.
Table 4.7: Performance risk and Chinese implementers of development projects in Indonesia, 2000-2023
Implementing agency |
Implementing agency type |
Avg delay, number of days |
ADB or WB sanctions/debarred (yes/no) |
ESG issues identified by Parks et al. (2023) |
AECOM |
Other private sector |
No |
E |
|
AF Dealer Consulting |
Other private sector |
No |
E |
|
Black and Veatch |
Other private sector |
No |
E |
|
|
Chengdu Engineering Corp., Ltd. (CEC) [aff. PowerChina] |
State-owned company |
Yes |
None |
|
|
China Construction Eighth Engineering Division Corp., Ltd. (CCEED) [aff. CSCEC] |
State-owned company |
Yes |
None |
|
|
China Construction Fourth Engineering Division Corporation Ltd. [aff. CSCEC] |
State-owned company |
Yes |
None |
|
|
China Gezhouba Group Cement Co., Ltd. [aff. CEEC, Energy China] |
State-owned company |
Yes |
S |
|
|
China Gezhouba Group Company Ltd. (CGGC) [aff. CEEC, Energy China] |
State-owned company |
Yes |
None |
|
|
China Harbour Engineering Co., Ltd. (CHEC) [aff. CCCC] |
State-owned company |
-527 |
Yes |
None |
|
China Huadian Engineering Co., Ltd. |
Chinese state-owned company |
No |
S |
|
|
China National Electric Engineering Co., Ltd. (CNEEC) |
Chinese state-owned company |
No |
G |
|
|
China National Machinery and Equipment Import and Export Corporation |
Chinese state-owned company |
No |
G |
|
|
China Railway International Group Co Ltd (CRIG) |
State-owned company |
Yes |
None |
|
|
China Road and Bridge Corporation (CRBC) |
State-owned company |
-527 |
Yes |
None |
|
China State Construction Engineering Corp Ltd. (CSCEC) |
State-owned company |
Yes |
None |
|
|
CSCEC Road and Bridge Group |
State-owned company |
Yes |
None |
|
|
Dongfang Electric Corporation (DEC) |
Chinese state-owned company |
-384.5 |
No |
G |
|
Doosan Heavy Industries and Construction |
Other private sector |
No |
E |
|
|
Energy China [China Energy Equipment Corp. Ltd. (CEEC)] |
State-owned company |
Yes |
None |
|
|
Environmental Resources Management (ERM) |
Other private sector |
No |
E |
|
|
Guangdong Power Engineering Corp (GDSBD) [aff. CEEC] |
State-owned company |
Yes |
E,S |
|
|
Harbin Boiler Company Ltd. (HBC) |
Chinese state-owned company |
No |
E,S |
|
|
Indonesia Ministry of Public Works and Housing |
Recipient government agency |
-247 |
No |
S |
JGC Corporation |
Other private sector |
No |
S |
|
JO CHEC-CSCEC-HK |
Joint venture/special purpose vehicle |
Yes |
None |
|
|
Korea Electric Power Corporation (KEPCO) |
Other state-owned company |
No |
E |
|
|
Perusahaan Listrik Negara (PLN) |
Recipient state-owned company |
No |
S |
|
|
Power Construction Corporation of China (PowerChina) |
State-owned company |
Yes |
E,S |
|
Pöyry PLC |
Other private sector |
No |
E |
|
PT Connusa Energindo |
Recipient private sector |
No |
E |
|
PT Hutama Karya |
Other private sector |
No |
E |
|
|
PT Kereta Cepat Indonesia China (KCIC) |
Other joint venture/special purpose vehicle |
-1295 |
No |
E,S |
|
PT Lintas Marga Sedaya |
Other joint venture/special purpose vehicle |
No |
E,S |
|
|
PT Penta Adi Samudera |
Recipient state-owned company |
No |
G |
|
|
PT Pertafenikki Engineering |
Recipient private sector |
No |
S |
|
|
PT Pertafenikki Engineering |
Recipient private sector |
No |
S |
|
PT Praba Indopersada |
Recipient private sector |
No |
S |
|
PT Saipem Indonesia |
Recipient private sector |
No |
S |
|
PT Saipem Indonesia |
Recipient private sector |
No |
S |
|
|
PT. Priamanaya Djan International |
Recipient private sector |
-785 |
No |
G |
|
Shandong Electric Power Engineering Consulting Institute Corp., Ltd. (SDEPCI) |
Chinese private sector |
-263 |
No |
E,S |
|
Suzhou Thvow Technology. Co., Ltd. |
Chinese private sector |
-730 |
No |
E,S |
|
Tokyo Electric Power Services Co., Ltd. (TEPSCO) |
Other private sector |
No |
E |
|
Tronoh |
Other private sector |
-785 |
No |
G |
|
Zelan Holdings (M) Sdn Bhd (Zelan) |
Other private sector |
-785 |
No |
G |
|
Zhejiang Kaishan Compressor Co., Ltd (Kaishan) |
Chinese private sector |
No |
E,S |
|
|
Zhongtian Guoneng Power Engineering |
Chinese state-owned company |
-730 |
No |
E,S |
Notes: This list of implementation agencies is limited to only those that were flagged as either sanctioned (directly or indirectly through their parent company) or evidenced higher ESG risk exposure in their projects. Average delays are calculated by the number of days of deviation from planned implementation or completion. Sources: Sanctions information was obtained from the World Bank and the Asian Development Bank registries of debarred firms, along with desk research to identify additional cases of sanctions noted in these institutions’ press releases and reported in third-party articles. ESG risk methodology was adapted from Parks et al. (2023) as applied to AidData’s Global Chinese Development Finance Dataset, Version 3.0 (Custer et al., 2023; Dreher et al., 2022).
This raises a critical question: how much of Beijing’s development finance portfolio in Indonesia is associated with risky implementers, based on ESG risk and sanctions for financial practices? The answer is in the billions. We estimate that 43 percent (US$30 billion) of Beijing’s commitments to Indonesia between 2000 and 2023 were channeled via firms with documented ESG exposure or prior sanctions (see Table 4.8 below). Prominent examples include: US$4.9 billion to China Energy Equipment Engineering, Ltd. (CEEC) and its affiliates; US$1.9 billion to China Road and Bridge Corporation (CRBC); and US$2.4 billion to Shandong Electric Power Engineering Consulting Institute Corp. (SDEPCI).
These implementers not only received large sums of money, but they also did so repeatedly. A subset of implementers—such as China Harbour Engineering, China Road and Bridge Corporation, and PowerChina—have been sanctioned for questionable business practices and/or flagged for ESG risks. Collectively, these firms account for a substantial share of China’s project portfolio in Indonesia.
This continued reliance on high-risk firms suggests that Beijing does not always treat past performance—measured by delays, ESG issues, or sanctions—as a disqualifying factor. Strategic priorities, cost, or political ties may outweigh risk considerations in China’s overseas contracting decisions. Table 4.8 below highlights the top ten Chinese implementers by project count and value.
Table 4.8: Top 10 PRC higher-risk implementers by project count and value, 2000-2023
Implementing agency |
Project count |
Project value, billions USD |
|
Perusahaan Listrik Negara (PLN) |
12 |
5.25 |
|
Indonesia Ministry of Public Works and Housing |
10 |
1.59 |
|
China Road and Bridge Corporation (CRBC) |
6 |
1.9 |
|
Power Construction Corporation of China (PowerChina) |
5 |
1.38 |
|
China Harbour Engineering Co., Ltd. (CHEC) [aff. CCCC] |
4 |
0.75 |
JGC Corporation |
4 |
3.45 |
|
Shandong Electric Power Engineering Consulting Institute Corp., Ltd. (SDEPCI) |
4 |
2.41 |
|
Dongfang Electric Corporation (DEC) |
4 |
1.57 |
|
Energy China [China Energy Equipment Corp. Ltd. (CEEC)] |
3 |
4.9 |
|
Guangdong Power Engineering Corp (GDSBD) [aff. CEEC] |
3 |
0.67 |
Notes: These firms have documented ESG exposure or prior sanctions. Sanctions information was obtained from World Bank and Asian Development Bank registries of debarred firms, along with desk research to identify additional sanctions cases noted in these institutions’ press releases and reported in third-party articles. ESG risk methodology was adapted from Parks et al. (2023) as applied to AidData’s Global Chinese Development Finance Dataset, Version 3.0 (Custer et al., 2023; Dreher et al., 2022).
Financiers that channel Beijing’s development dollars also shape risk exposure (see Table 4.9). Some, such as the Industrial and Commercial Bank of China and China Development Bank, had relatively few projects flagged for ESG concerns (6-12 percent). Yet these projects accounted for a disproportionate share of total finance value (32-45 percent). Others, like China Construction Bank and the Agricultural Bank of China, exhibited high exposure across project count and value: over 80 percent of their portfolios were tied to flagged projects. Power Construction Corporation of China (PowerChina) is a top financier that also appears as a sanctioned implementer, underscoring the blurred lines between financier and contractor roles in some PRC-financed projects.
Taken together, these patterns suggest that ESG risk is not limited to a few problematic implementers but reflects a broader financing ecosystem in which high-risk projects continue to receive backing from major state-owned banks.
Table 4.9: Top Chinese financiers of Indonesian development projects and performance risk, 2000-2022
The table can be sorted by clicking on a column. On small screens, scroll horizontally to view hidden columns.
|
State-owned enterprise |
Project count |
Total value, billions USD |
Percent of projects associated with risk |
Percent of total value associated with risk |
|---|---|---|---|---|
|
China Development Bank (CDB) |
57 |
30.74 |
12% |
32% |
|
PowerChina |
2 |
17.41 |
|
0% |
|
Export-Import Bank of China (China Eximbank) |
55 |
16.59 |
9% |
20% |
|
Industrial and Commercial Bank of China (ICBC) |
102 |
16.36 |
6% |
45% |
|
Bank of China (BOC) |
63 |
11.01 |
8% |
12% |
|
China Construction Bank Corporation (CCB) |
13 |
6.05 |
31% |
80% |
|
Agricultural Bank of China (ABC) |
3 |
4.36 |
67% |
86% |
|
China Investment Corporation (CIC) |
2 |
3.19 |
|
0% |
|
Shandong Xinhai Technology Co. Ltd. (Xinhai) |
1 |
2.98 |
|
0% |
|
Taiyuan Iron and Steel Co. Ltd. (Tisco) |
1 |
2.98 |
|
0% |
|
ICBC Indonesia |
20 |
2.6 |
5% |
43% |
|
China CITIC Bank Corporation Limited |
4 |
2.45 |
50% |
72% |
|
ICBC Financial Leasing Co., Ltd. (ICBC Leasing) |
2 |
2.14 |
|
0% |
|
Unspecified Chinese Government Institution |
80 |
1.79 |
|
0% |
|
State Development and Investment Corporation Power (SDIC Power) |
1 |
1.72 |
|
0% |
|
Bank of China (Jakarta Branch) |
8 |
1.55 |
13% |
72% |
|
Bank of China (Singapore branch) |
1 |
1.26 |
100% |
89% |
|
China Merchants Bank Co., Ltd. |
1 |
1.26 |
100% |
89% |
|
Tai Fung Bank Limited |
1 |
1.26 |
100% |
89% |
|
China Energy Engineering Corp (CEEC) |
1 |
1.21 |
|
0% |
|
China International Development Cooperation Agency (CIDCA) |
2 |
0.66 |
|
0% |
|
Bank of China (Hong Kong) Limited (BOCHK) |
6 |
0.57 |
|
0% |
|
Industrial and Commercial Bank of China (Asia) Limited (ICBC (Asia)) |
2 |
0.26 |
|
0% |
|
ZTE Corporation |
2 |
0.17 |
|
0% |
Notes: This table summarizes Chinese state-owned enterprises (SOEs) with the largest financial footprint in Indonesia, based on project count and total commitment values. The table includes only those SOEs with at least two projects or over US$100 million in total commitments. Shading corresponds to each column. Risks include environmental, social, or governance (ESG) risks, and blank cells indicate that none of the SOE’s projects were associated with ESG risk. Sources: Risk classifications are based on AidData’s ESG risk assessment methodology, adapted from Parks et al. (2023) and applied to AidData’s Global Chinese Development Finance Dataset, Version 3.0 (Custer et al., 2023; Dreher et al., 2022).
4.3. How does Chinese financing shape perceptions and contribute to development outcomes in Indonesia?
Beijing funds high-profile infrastructure projects with the potential to reshape Indonesia’s economy, environment, governance, and society, for better or worse. Beyond the immediate impacts of individual projects, the broader pattern of China’s engagement may also influence how it is perceived by both the Indonesian public and political elites as a global power and a development partner. In this section, we move beyond specific projects, financiers, or contractors to assess how Beijing’s overall investment portfolio may shape its perceptions in Indonesia (section 4.3.1) and influence the country’s development path (section 4.3.2).
4.3.1 Winning hearts and minds? Perceptions and financing
Earlier chapters of this report emphasized that Beijing employs a two-track model in its development finance in Indonesia. It uses debt financing to bankroll the ambitious infrastructure priorities of Indonesian leaders, and it supplies traditional aid to build goodwill with local communities. Beijing has intentionally deployed its state-directed development finance to crowd in Chinese foreign direct investment from the private sector to open markets and amplify influence. The PRC has many goals for its economic statecraft, one of which is to influence public perceptions and project soft power (Mathew and Custer, 2023). China’s engagement in Indonesia has evolved over time, reflecting diverse strategies pursued under different Indonesian presidencies (see section 2.2 in Chapter 2). Although leaders are critically important to advancing Beijing’s national interests, so are the attitudes of foreign publics, particularly in electoral democracies like Indonesia, where the public’s preference for candidates can influence government policy and relations with foreign powers (Freedom House, 2024).
All things being equal, if money buys love, one might expect to see a dramatic improvement in the Indonesian public’s perceptions of China over the last two decades, tracking with the sizable growth in Beijing’s economic engagement. Yet public attitudes towards China, as measured by the Gallup World Poll (2006-2024), did not live up to this rosy expectation (Figure 4.10). Instead, approval of the leadership of the PRC peaked around 2008. It subsequently declined, even though the post-2008 period is when Indonesia began seeing much larger inflows of Beijing’s development finance and Chinese FDI.
Importantly, Indonesian citizens’ reactions to Beijing do not appear to reflect broader pessimism toward other leaders. Public approval of Indonesian leaders surged just before President Yudhoyono’s 2009 re-election (nearly 90 percent), remaining relatively high and stable through presidential transitions to Widodo and Subianto (65-80 percent). These high approval levels could reflect general satisfaction with Indonesia’s maturation as a democracy (Yudhoyono being the country’s first directly elected president) or the specific policies pursued by leaders. Indonesians may be more inclined to attribute the benefits of infrastructure-led growth to domestic politicians than to Chinese investment.
Beijing was not alone in contending with declining favorability. Indonesians’ attitudes toward Tokyo and Washington also soured between 2006 and 2024. Japan, the best performer among the three foreign powers, still only earned the approval of one-third of the Indonesians surveyed. Nevertheless, Tokyo’s approval ratings consistently outperformed others over the 18-year period, perhaps buoyed by Japan’s visibility as a long-standing, uncontroversial, and generous development partner. Intriguingly, Japan’s favorability did not suffer, even as it was displaced by the PRC as Indonesia’s top development finance supplier.
The competition for hearts and minds was much tighter between China and the United States. Forty-five percent of Indonesians approved of U.S. leadership in 2008; only 24 percent said the same by 2024. Washington’s position in the eyes of Indonesians was also more volatile relative to Beijing; at times, public opinion gravitated toward the U.S., while at other times, the PRC had the upper hand.
Figure 4.10: Indonesian citizen perceptions of the leadership of China, the U.S., Japan, and their own government, 2006-2024
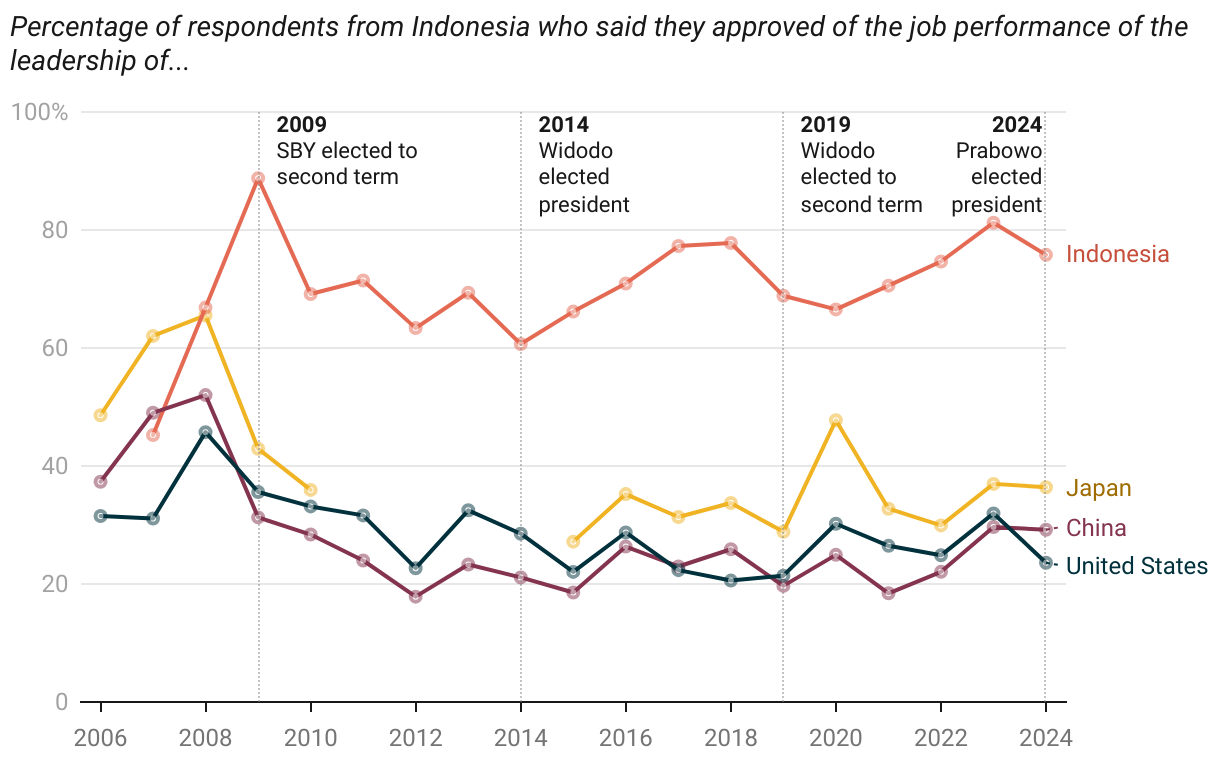
Notes: This figure shows the percentage of respondents from Indonesia who said they approved of the job performance of the leadership of China, Japan, and the United States, as well as their own government (respondents could select approve, disapprove, or did not know how they felt). Vertical dashed lines indicate presidential election years in Indonesia. Sources: Gallup World Poll (2006-2024). All figures use Gallup’s provided weights to ensure a representative sample.
To examine these trends more closely, we ran statistical models to test how exposure to PRC development finance (DF) or Chinese foreign direct investment (FDI) may influence Indonesian public opinion about their own political leadership and that of Beijing. We considered four inputs: (i) the level of PRC DF dollars (including aid and debt instruments); (ii) the number of DF projects Beijing bankrolled; (iii) the level of inbound FDI from China to Indonesia; and (iv) the number of FDI projects from China to Indonesia. We examined two outcomes: (i) Indonesian approval of the PRC’s leadership; and (ii) Indonesian approval of their own government.
The statistical model tests whether these two dimensions of Indonesian public opinion appear to move in relation to our four financial measures (the value and number of DF and FDI projects) at the subnational level.[112] The model accounts for individual attributes such as age, gender, education, employment status, rural or urban location, and household income.[113] This process identifies whether a relationship exists, but does not tell us why that is the case. Detailed results and additional information about how the statistical model was constructed are available in the Technical Appendix to this report.
If Beijing was hoping to convert economic statecraft into more favorable public opinion, then the results will be a disappointment. None of the tests yielded a statistically significant relationship between provinces’ exposure to Beijing’s development finance or Chinese FDI and approval of the PRC’s political leaders, for better or worse.[114] There was a discernible negative relationship worth noting: exposure to Beijing’s development finance and FDI projects consistently corresponded (across all model specifications) with lower levels of approval among Indonesians for their government in Jakarta.[115] These results, though worth investigating further, should be interpreted cautiously, as they were not statistically significant.
In short, Beijing faces an uphill battle in converting its considerable financial resources (via development finance and FDI) into measurable reputational gains with Indonesia’s public. Why might this be? Stepping back from the models to reflect on the broader context, we put forward three possible explanations.
First, Indonesians may be exposed to other facets of Beijing’s decision-making beyond its development finance and FDI investments. If these other interactions are predominantly negative, such as in public backlash to Beijing’s maritime claims in the Natura Sea or its treatment of Uyghur Muslim minorities in China’s Xinjiang province, that could potentially cannibalize approval gains China might otherwise have made.
Second, as Indonesians have expressed concerns over whether the country has become too reliant or dependent on Chinese investment in critical industries, this growing unease could neutralize appreciation for Beijing’s financial support. Relatedly, the Asian Barometer, another citizen survey, found that the share of Indonesians who said that China had a “good influence” in their country had declined by 28 percentage points between 2011 and 2021.[116]
Third, it is uncertain whether and how Indonesians’ attitudes towards the ethnic Chinese-Indonesian minority may color their perceptions of mainland China, regardless of Beijing’s economic overtures. Two-and-a-half decades after the May 1998 riots disproportionately targeted Chinese-Indonesians in Jakarta, Sinophobia and inter-ethnic tension are still visible, with occasional bouts of unrest and lingering suspicions of ethnic Chinese as outsiders beholden to Beijing for direction (Sritharan and Rizkillah, 2024; Herlijanto, 2017).
Citizen attitudes matter, but the perceptions of Beijing held by Indonesian public, private, and civil society elites may be more consequential to advancing the PRC’s interests. AidData fields surveys to monitor perceptions of the PRC as a development partner in 100+ countries, including Indonesia (Custer et al., 2025). While the data on Indonesian elites is insufficient for a standalone quantitative analysis, the broader survey offers valuable insights into regional perspectives on China as a development partner, and we can pair this with qualitative insights from the sample of Indonesian respondents.[117]
Nearly 85 percent of leaders across East Asia and the Pacific who worked with the PRC said it was quite or very influential in shaping domestic priorities in their country. This held steady across surveys in 2020 and 2024. The PRC’s regional influence was less perceptible in similar surveys conducted in 2014 and 2017. In recent years, Beijing has sought to professionalize its capacity to deliver development (Mathew and Custer, 2023), which may have contributed to dramatic gains (+40 percentage points) in its perceived helpfulness among regional leaders in implementing policies and programs, which skyrocketed from a meager 47 percent in 2020 to 86.7 percent by 2024.
Compared to their regional peers, Indonesian leaders saw Beijing as more influential in shaping the development agenda in Indonesia. However, the share of leaders who viewed this influence as positive plummeted by half between 2020 and 2024 (Figure 4.11). Their perspectives on Beijing’s helpfulness likewise soured in recent years.
Figure 4.11: Perceptions of the PRC as a development partner held by leaders in Indonesia, 2020 and 2024

Notes: This visual shows the percentage of public, private, and civil society leaders in Indonesia surveyed in 2020 and 2024 who: (i) identified the PRC as quite or very influential in shaping domestic policy priorities in their country (agenda-setting influence); (ii) said the PRC’s influence was quite or very positive for their country (influence seen positively); and (iii) rated the PRC as quite or very helpful in the design and implementation of policy reforms (helpfulness in implementation) during the five years preceding each survey. Leaders could only evaluate the PRC’s performance on helpfulness and positivity if they had previously reported receiving advice or assistance from it in the past five years. Source: Listening to Leaders Survey, Waves 3 and 4. Custer et al., 2021; Custer et al., 2025.
4.3.2 Public good or public harm? Outcomes of Chinese financing
Over two decades, Beijing’s state-directed development finance and private Chinese foreign direct investment (FDI) have poured into Indonesia’s strategic sectors—from energy and extractives to transportation and telecommunications—at a scale that few external actors can match. Advocates and naysayers alike point to individual projects as generating benefits or costs for Indonesia’s communities, institutions, and physical environment. However, the broader influence of economic engagement with China on Indonesia’s development trajectory is not well understood.
In this section, we use a series of statistical models[118] to assess whether and how the PRC’s portfolio of development finance (DF) and FDI investments is associated with key economic, environmental, social, and governance outcomes in Indonesia.
4.3.2.1 PRC financing and Indonesian economic outcomes
China is an indisputable economic powerhouse. Indonesia is not alone in placing high expectations on the ability of PRC development finance and Chinese FDI to catalyze broad-based economic gains (Custer et al., 2024). Nor is Beijing shy about amplifying these narratives via its state-run broadcasting (Burgess et al., 2024). Less certain is whether Chinese capital can live up to this hype.
To test these assumptions, we assess the relationship between Chinese financing (the dollar amount and number of DF and FDI projects) and four economic outcomes: domestic productivity from goods and services produced in the country (gross regional domestic product, or GRDP), economic growth across society (GRDP per capita), basic socioeconomic outcomes (unemployment rate and poverty percentage), and Indonesians’ perceptions of their economic prospects (food security, confidence in the economy, and job climate).
Of the two financing modalities, Chinese private sector FDI appears to be most strongly associated with short-term growth. The number and dollar value of Chinese FDI projects were significantly and positively associated with increased gross regional domestic product (Table 4.12). In other words, provinces exposed to more Chinese FDI appeared to enjoy higher economic productivity than those with less of this investment. The PRC’s state-directed development finance was also positively associated with GRDP; however, this relationship was not statistically significant.
The long-run effects of Chinese capital on provincial unemployment, poverty, food security, and economic sentiment were mixed. Beijing’s DF was associated with lower unemployment: the relationship is consistent, and became statistically significant in later years. This contradicts a common critique that Beijing uses Chinese (not local) labor and suppliers. However, this does align with our Chapter 3 observation that Beijing’s DF draws more on Indonesian implementers than expected. In several specifications, Chinese DF may contribute positively to perceived local economic conditions (job security, economic climate, food security); however, results were less stable and not significant.
The influence of Chinese FDI on unemployment rates is less easily interpretable. FDI projects were positively associated with lower unemployment and poverty rates after year one, but those gains reversed and became statistically significant in later years. Similarly, provinces exposed to more Chinese FDI initially reported higher confidence in local economic conditions, only for sentiment to sour by year five. Perceptions of food security improved within a year of new Chinese FDI project commitments, but this did not remain significant over time.
Table 4.12: Chinese development finance, Chinese FDI, and economic outcomes in Indonesia, 2005-2023
Table can be scrolled horizontally.
|
|
Generally observed economic aggregates |
Perceived economic experiences of Indonesians |
||||||
|
Input |
Lag |
Gross Regional Domestic Product (GRDP) |
GRDP per capita |
Unemployment rate |
Poverty rate |
Food security |
Local economic conditions |
Local job climate |
|
DF amount |
5 yrs |
(+) |
(+) |
(-) |
(+) |
(+) |
(+) |
(+) |
|
DF projects |
5 yrs |
(+) |
(+) |
(-) |
(+) |
(+) |
(+) |
(+) |
|
FDI amount |
5 yrs |
(+) |
(+) |
(+) |
(+) |
(+) |
(-) |
(-) |
|
FDI projects |
5 yrs |
(+) |
(+) |
(+) |
(+) |
(+) |
(-) |
(-) |
Notes: The models use province-year data. In addition to the four types of Chinese financing as inputs (independent variables), they include demographic control variables and fixed effects for both year and province. The +/- signs indicate the direction of the relationship. Cells in green indicate that the association between the type of PRC financing and the outcome of interest is significant at conventional levels (p < 0.001, < 0.01, or < 0.05). Due to variation in data availability, the number of observations, the provinces included, and the years covered differ across models. Additional specifications were run with a lag of 1 and 3 years. See the Technical Appendix for more details. Sources: BPS (Indonesian Statistics Agency, 2025); Gallup World Poll (Gallup, 2025).
4.3.2.2 PRC financing and Indonesian environmental outcomes
Despite the prospect of economic gains, many Indonesians associate Chinese investment with visible environmental harm. Over forty percent of Indonesians surveyed in 2024 felt that Chinese-financed development projects degraded the environment and damaged local ecological systems (Rakhmat et al., 2024). This sentiment was echoed by some Indonesian experts interviewed for this research. As one interviewee expressed, the revenue gains from Chinese-funded projects accrue to the central government; local communities bear the costs of environmental harms without a boon to local jobs.[119]
Does China’s economic footprint leave an observable environmental mark? To answer this question, we applied the same statistical techniques described in the previous section to assess whether and how Chinese capital (the number and amount of DF and FDI projects) was associated with four environmental outcomes. This included two satellite-derived indicators of vegetation loss and carbon dioxide emissions across Indonesian provinces, as well as two survey-based measures of public dissatisfaction with air and water quality.
One of the clearest signals of possible environmental harm in the data was related to observable vegetation loss (measured via a Normalized Difference Vegetation Index, or NDVI) within a year following new Chinese FDI commitments. Intuitively, this makes sense, in light of the strong focus of Chinese FDI on physical and digital infrastructure projects (see Chapter 2), which involve clear-cutting or generating pollutants that degrade local vegetation stocks. This negative relationship does not retain its initial statistical significance and actually changes direction in later years. Although carbon dioxide emissions appeared to rise over time among provinces exposed to more Chinese FDI, none of these results were statistically significant at conventional levels.
At the start of this section, we cited findings from a survey of Indonesians that highlighted concerns about the potential for negative environmental impacts on local communities from Chinese-financed development projects. Interestingly, this general sense of foreboding does not readily translate into dissatisfaction, specifically with local water and air quality (Table 4.13).
Table 4.13: Chinese development finance, Chinese FDI, and social and governance outcomes in Indonesia, 2005-2023
Table can be scrolled horizontally.
|
|
Generally observed environmental indicators |
Perceived environmental changes for Indonesians |
|||
|
Input |
Lag |
NDVI |
Carbon dioxide |
Water dissatisfaction |
Air dissatisfaction |
|
DF amount
|
5 yrs |
(+) |
(-) |
(-) |
(+) |
|
DF projects |
5 yrs |
(+) |
(+) |
(-) |
(-) |
|
FDI amount |
5 yrs |
(+) |
(+) |
(+) |
(+) |
|
FDI projects |
5 yrs |
(+) |
(+) |
(+) |
(+) |
Notes: The models use province-year data. In addition to the four types of Chinese financing as inputs (independent variables), they include demographic control variables and fixed effects for both year and province. The +/- signs indicate the direction of the relationship. The blue cell indicates a weak but statistically significant association between the type of PRC financing and the outcome indicator of interest (p < 0.1). Due to variation in data availability, the number of observations, the provinces included, and the years covered differ across models. Additional specifications were run with a lag of 1 and 3 years. Please see the Technical Appendix has more details. Sources: NASA for Normalized Difference Vegetation Index (Pedelty et al., 2007) and carbon dioxide (OCO-2/OCO-3 Science Team et al., 2022), Gallup World Poll (Gallup, 2025).
Given the tendency for Beijing to co-locate its development finance dollars with private sector FDI (see Chapter 2), one might expect to see these financial modalities associated with similar environmental outcomes at the provincial level. That was not necessarily the case. Counterintuitively, Beijing’s DF—both in amount and project count—tended to correspond with lower dissatisfaction with local water and air quality after five years. FDI amount and projects, by contrast, was associated with higher dissatisfaction across both indicators. FDI projects were negative after one and three years, but became positive at five years. None of these results were statistically significant and should be interpreted with caution.
As discussed earlier in this chapter, not all Chinese-financed development projects carry the same set of risks, and this heterogeneity could obscure the fact that some activities create significant environmental costs at local levels. A poignant example of this dynamic is Indonesia’s Morowali Industrial Park (IMIP), profiled in Chapter 2.[120] IMIP’s construction, begun in 2013 and completed in 2017, transformed a once-forested coastline into a sprawling industrial complex of smelters, power plants, and port facilities, triggering significant environmental costs (Nindita and Feng, 2025a).
Independent research studies have ranked IMIP among the worst offenders for vegetation loss among Chinese-backed projects (Pramono et al., 2022; Brown and Harris, 2024).[121] Satellite imagery shows accelerating deforestation, with sharp declines in green cover (Figure 4.14). IMIP has reportedly contributed to erosion, sedimentation, and the collapse of local fish stocks. Residents report air pollution, health problems, and reduced access to forests and ancestral lands (Nindita and Feng, 2025a). The contrast between these local reports and our statistical findings may reflect how hyper-local environmental harms, like water and air pollution, can be masked within broader province-level data.
Figure 4.14: Vegetation trends in Central Sulawesi, 2010-2020
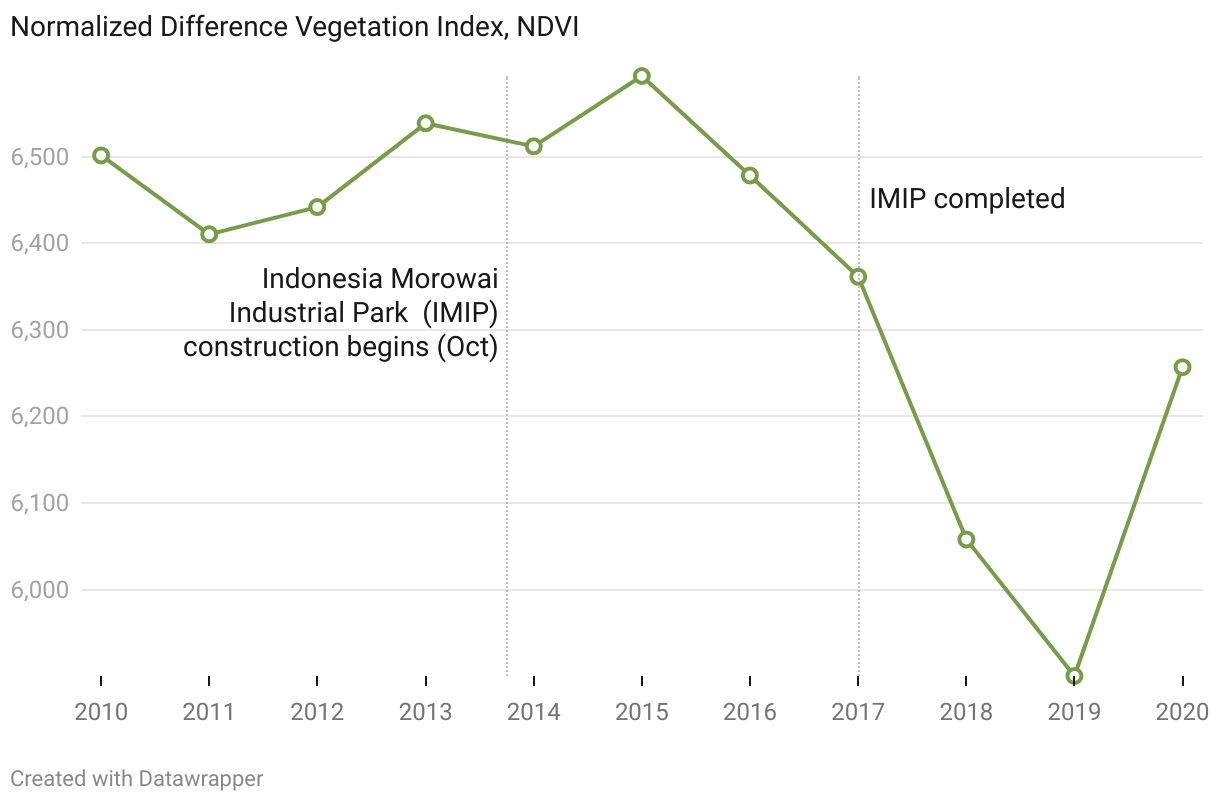
Notes: This figure displays the yearly average of vegetation greenness and density (the Normalized Difference Vegetation Index, or NDVI) in Central Sulawesi province. NDVI values are scaled by a factor of 10,000: a value of 6,400 corresponds to an NDVI of 0.64. Higher values indicate denser and healthier vegetation. Vertical dashed lines indicate when the Morowali Industrial Park began and ended construction. Sources: NASA’s Long-Term Data Record based on the Advanced Very High Resolution Radiometer, a satellite sensor that monitors land surface conditions (Pedelty et al., 2007).
4.3.2.3 PRC financing and Indonesian social and governance outcomes
Chinese financing offers Indonesia the promise of economic growth, but with the risk of social and governance challenges, as projects advance through opaque channels and bypass local accountability. The Jakarta–Bandung High-Speed Rail, profiled in Chapter 2, illustrates how such infrastructure deals can move forward under unclear regulatory frameworks and with minimal political oversight (Nicola et al., 2023).[122] Public unease over the PRC’s influence on democratic and social norms compounds these dynamics (Rakhmat and Purnama, 2024; Sampurna, 2018).
To better assess whether and how Chinese capital (the number and value of development finance (DF) and FDI projects) was associated with social and governance outcomes, we constructed a statistical model with the same specifications as in the sections above. We considered four expert-assessed measures of social development and governance: the Indonesia Democracy Index (IDI), the subnational human development index (SHDI), the subnational corruption index (SCI), and access to healthcare by province. We also considered four measures of citizen perceptions around democracy, civic engagement, youth development, and corruption. This analysis draws upon citizen surveys via the Gallup World Poll and the Asian Barometer, as well as objective assessments from the Global Data Lab and Indonesia’s national statistics agency (BPS).
Chinese capital had mixed results in terms of its contributions to Indonesia’s social sector. Exposure to the PRC’s development finance was associated with more positive perceptions of civic engagement but worsening perceptions of youth development. The prognosis for FDI was even less rosy; this type of economic engagement was negatively associated with civic engagement with statistical significance in the short term. There was no observable, statistically significant relationship between these flows and access to healthcare, despite Beijing’s efforts to promote its Health Silk Road and support Indonesia’s COVID-19 response.
The two financing modalities had somewhat divergent results when it comes to governance outcomes. Beijing’s development finance was positively and consistently associated with the Indonesian public’s perceptions of Indonesia as a democracy (Table 4.15). Beijing often aligns its DF with domestic political priorities, so politicians may be able to use such projects to build confidence that they are delivering on their campaign promises. Exposure to Chinese FDI was also associated with strong declines in subnational democracy levels in the near term. These effects remain negative over time but lose statistical significance. FDI shows consistent, normatively positive associations with increased corruption perceptions, though these results are not statistically significant.
Table 4.15: Chinese development finance, Chinese FDI, and social and governance outcomes in Indonesia, 2005-2023
Table can be scrolled horizontally.
|
|
Expert-assessed measures |
Citizen perception measures |
|||||||
|
Input |
Lag |
IDI |
SHDI |
Corruption |
Health |
Democracy |
Civic engagement |
Youth development |
Corruption perceptions |
|
DF amounts |
5 yrs |
(-) |
(-) |
(-) |
(-) |
(+) |
(+) |
(-) |
(+) |
|
DF projects |
5 yrs |
(-) |
(-) |
(-) |
(-) |
(+) |
(+) |
(-) |
(-) |
|
FDI amounts |
5 yrs |
(-) |
(-) |
(-) |
(-) |
(-) |
(-) |
(-) |
(+) |
|
FDI projects |
5 yrs |
(-) |
(-) |
(+) |
(+) |
(-) |
(-) |
(+) |
(+) |
Notes: The models use province-year data. In addition to the four types of Chinese financing as inputs (independent variables), they include demographic control variables and fixed effects for both year and province. Survey data on if Indonesia is a democracy (“Democracy”) from Asian Barometer is at the national level, since the survey does not consistently identify respondents subnationally. The +/- signs indicate the direction of the relationship. Cells in green indicate that the association between the type of PRC financing and the outcome of interest is significant at conventional levels (p < 0.001, < 0.01, or < 0.05). Blue cells indicate a weaker association (p < 0.1). Due to variation in data availability, the number of observations, the provinces included, and the years covered differ across models. Additional specifications were also run with a lag of 1 and 3 years. Please see the Technical Appendix for more details. Sources: BPS (Indonesian Statistics Agency, 2025); Global Data Lab (; Crombach and Smits, 2024; Global Data Lab., 2024; Smits and Permanyer, 2019); Gallup World Poll (Gallup, 2025), Asian Barometer Survey (2024).
Indonesia represents a striking contradiction. A growing share of Indonesians believe their country is a democracy since the mid-2010s and are satisfied with the quality of their institutions (Figure 4.16). Yet, expert measures are trending in the opposite direction, warning of a slide from democracy to autocracy (Nord et al., 2025). While Indonesia still observes multiparty elections, the V-Dem Institute’s Democracy Report 2025 raises concerns over the country’s protection of civic freedoms of expression and association, as well as the degree to which elections are free and fair (ibid).
What might explain this seeming disconnect between public attitudes and objective measures of democratic governance? It could be that Indonesians are redefining how they interpret what it means for democracy to deliver for their society. Asian Barometer surveys, for example, find that roughly four-fifths of Indonesians surveyed have prioritized economic development over democracy since the mid-2000s (Figure 4.17). Notably, this trend has accelerated in recent years.
There are likely many factors fueling Indonesia’s privileging of stable economic growth over liberal democratic institutions. It is difficult to say with certainty what, if any, role Indonesia’s growing economic engagements with Beijing might play in shaping these norms. It is evident, however, that the PRC’s emphasis on economic development over democracy appears to align well with prevailing public preferences in Indonesia and the country’s political trajectory. There is also a discernible pattern that, as Indonesia’s democracy weakens, its engagement with China deepens, and the public prioritizes economic over democratic development.
Figure 4.16: Indonesian attitudes towards democracy and the country’s democracy rating, 2000-2023


Figure 4.17: Democracy or development? Indonesian public opinion and China’s expanding role, 2000-2023

Notes: The top chart displays annual Chinese development finance to Indonesia, based on AidData’s Global Chinese Development Finance Dataset, Version 3.0. The middle chart shows Varieties of Democracy’s Liberal Democracy Index, scaled from 0-1 and then multiplied by 100. The bottom charts show the percentage of Indonesians, based on Asian Barometer surveys, who prioritized economic development over democratic ideals when asked to choose between the two. Sources: Dreher et al., 2022; Custer et al., 2023; Varieties of Democracy (Coppedge et al. 2025; Pemstein et al. 2025); Asian Barometer Survey (2024).
5. Conclusion
As an economic and political heavyweight in Southeast Asia, Indonesia’s appeal as a favored destination for Chinese capital is undeniable. Beijing has bet big on Indonesia over the last two decades: bankrolling 400 development projects with roughly US$69.6 billion in state-directed finance (2000-2023) and channeling an estimated US$94.1 billion in private foreign direct investment (2010-2023). Indonesia stands out among its regional peers, receiving comparatively larger shares of both types of Chinese capital than its neighbors. This has positioned China to have outsized economic clout, and by extension, political leverage, as Indonesia’s most significant source of both inbound FDI and development finance.
Indonesia could reap ample rewards from this unprecedented scale of Chinese investment. Local political leaders must deliver on their campaign promises of infrastructure-led growth, and Beijing has proven a willing partner. Nevertheless, as this report outlines, Beijing operates more like a commercial lender than a traditional donor. The PRC’s appetite to finance ambitious infrastructure deals and work with implementers despite tarnished track records underscores that partnering with Beijing is very much about taking steps to manage risk.
In this report, Balancing Risk and Reward: Who benefits from China’s investments in Indonesia?, we set out to fill a critical information gap about what Beijing is investing in, where, and to what effect. We separated myth from fact by systematically decoding the money, relationships, and outcomes behind two decades of Beijing’s investment in Indonesia. In this concluding section, we summarize some higher-level takeaways from this research to inform how the Indonesian public and political leaders assess the merits and drawbacks of economic engagement with China.
5.1 Revealed priorities: What projects, when, and where?
Beijing has not always been Indonesia’s leading development partner, nor its largest source of inbound FDI. Japan was once Indonesia’s biggest donor in the early 2000s, before the PRC began outspending Indonesia’s other bilateral and multilateral partners between 2011 and 2018. Financing was erratic across presidential administrations—a moderate surge under Megawati, dramatic ups and downs with Yudhoyono, and then record-breaking highs under Widodo’s first term, before tapering off with the COVID-19 pandemic. Chinese FDI mirrored broader capital market trends: an early ebb in 2015, a global slowdown during COVID-19, and a resurgence of interest in 2023.
Beijing employs a two-track model twinning big-ticket infrastructure investments with the potential for commercial returns and small-dollar goodwill projects for reputational gains. Energy, transport, and nickel processing capacity for Indonesia’s stainless steel and EV battery industries were the top areas of focus for Beijing’s development finance dollars. The Chinese government also sent money, food, search and rescue support, and medical teams to aid Indonesia in response to natural disasters and fund social, education, and health projects.
The PRC was adept at using its state resources to build critical infrastructure and broker local relationships in order to pave the way for future private Chinese FDI. Chinese firms accounted for 98 percent of new investments in mineral projects, and half of all capital directed to metals investments. However, even when the total investment is relatively small, Chinese investors have positioned themselves as dominant forces, accounting for most of the FDI in specialized sectors such as wood products, ceramics and glass. Java and Sumatra attracted the lion’s share of Beijing’s development finance, and private FDI traced to the subnational level. The PRC’s per capita spending (for its state-directed development finance) was high in resource-rich provinces such as West Papua and Central Sulawesi.
5.2 Influence networks: Which players, what roles, and why?
In the early years, Beijing’s development finance was bankrolled by a relatively tight circle of homogeneous state-owned policy and commercial banks in China. From 2008 through the initial years of the Belt and Road Initiative, the PRC became the largest sovereign creditor to emerging economies. However, Beijing grew risk-averse as borrowing countries struggled to repay debts and projects faced implementation difficulties, and it was defensive in countering a media narrative of poorly conceived projects saddling countries with debt.
More recently, Beijing has turned to syndicated loan arrangements, which allow its state-owned policy and commercial banks to pool risk and capital with a broader network of co-financiers, including Western commercial banks and even multilateral institutions. This global PRC development finance trend was also observed in Indonesia. Fifty-eight Chinese financial institutions served as the primary financiers for large infrastructure projects. They harnessed an extensive network of 208 banks from 34 countries as co-financiers to hedge their bets.
Contrary to a common stereotype, Beijing’s development finance projects were not (entirely) “made in China.” Instead, the PRC drew upon a network of 213 government agencies, state-owned enterprises and banks, private companies, and civil society organizations from 12 countries as implementers in Indonesia. Undoubtedly, Chinese SOEs were the largest segment of these implementers. Still, just under half of the implementers were Indonesian, including stand-alone firms and participants in joint ventures and special purpose vehicles. Beijing’s social sector projects capitalized on the credibility and distribution networks of Islamic organizations and universities in Indonesia to win hearts and minds.
Not all implementers have performance problems, but our research uncovered a major vulnerability in Beijing’s development finance in Indonesia: 40 percent of its project portfolio (US$30 billion) relied on risky implementers. Fifteen implementers operating in Indonesia had been directly sanctioned by the World Bank or ADB for questionable financial practices, or they were indirectly associated with a sanctioned firm via a parent-subsidiary relationship. Several implementers were also flagged for heightened ESG risk in their projects. These problem implementers not only received large sums of money, but they often did so repeatedly. Beijing’s use of high-risk firms suggests that it weighs other considerations above past performance or risk management in its decisions.
Most (87 percent) of the recipients of Chinese-funded development projects were Indonesian agencies or organizations. Although Beijing funded projects across the Indonesian archipelago, recipient organizations were concentrated in the Jakarta Special Capital Region. Development finance darlings, which received both the highest volume of funding and number of projects, included: the Government of Indonesia (ministry unspecified), Perusahaan Listrik Negara, Lembaga Pembiayaan Ekspor Indonesia (LPEI), Bank Rakyat Indonesia, and Garuda Indonesia. Perhaps practicing a form of religious diplomacy, thirteen Islamic organizations and groups (mosques, faith-based NGOs, educational institutions) were also recipients of PRC-financed projects, along with scholarships for Muslim students and paid visits to China for leadership.
5.3 Weighing trade-offs: Follow-through, costs, and benefits?
Global South leaders often point to speed as one of the appeals of working with Beijing compared to the alternatives. In practice, this reputation for speed of delivery may be overhyped: it takes Beijing an average of 2.5 years to move from committed funds to delivered projects in Indonesia. Bengkulu, Gorontalo, and Jambi provinces had even longer wait times; the average project there took more than five years to complete. On the other hand, Beijing had delivered projects more quickly in Central Papua, Aceh, and Yogyakarta, moving from breaking ground to wrapping up in well under a year.
When managing expectations or comparing against the alternatives, it is helpful to know which types of projects are more or less likely to hit roadblocks. Beijing could deliver food aid quickly or respond to emergencies. By contrast, its optimistic timetables run aground when delivering large-scale infrastructure: projects in energy, transport, and telecommunications saw significant delays of more than 1,000 days between commitment and completion. This makes intuitive sense: these complex projects involve several factors—land acquisitions, environmental assessments, coordination across contractors, local capacity to absorb large-scale investments—that can push timelines beyond expectation.
Beijing often ties its funding to using Chinese firms and eschews free and open procurement processes. In the absence of competition, it is important to know which implementers have a better or worse track record for delivering on time. There is high variability among the PRC’s implementers in Indonesia. Kereta Cepat Indonesia China, which implemented the Jakarta–Bandung High-Speed Rail, recorded an average delay of 1,295 days, over three and a half years behind schedule. Chinese firms such as Dongfang Electric Corporation, Suzhou Thvow Technology Co., Ltd., China Harbour Engineering Company, and China Road and Bridge Corporation faced delays of several hundred days each.
China’s willingness to finance large-scale infrastructure presents opportunities and risks. These investments can accelerate progress toward Indonesia’s development goals, but create negative spillovers for local communities. Using a series of statistical models, we assessed whether and how exposure to Chinese capital (private FDI and state-directed development finance) was associated with various economic, social, governance, and environmental outcomes at the provincial level. The results were mixed.
Consistent with Beijing’s articulated value proposition of helping Indonesian leaders deliver infrastructure-led growth, the clearest gains for local communities may be economic. Both types of Chinese capital were positively associated with economic productivity. Beijing’s development finance was associated with lower unemployment, contradicting a common critique that Beijing uses Chinese (not local) labor and suppliers. Chinese FDI was less successful in addressing unemployment and confidence in economic conditions.
Many Indonesians associate Chinese investment with environmental harm: over forty percent of those surveyed in 2024 felt that Beijing’s projects degraded the environment and damaged local ecological systems (Rakhmat et al., 2024). In practice, PRC-financed development is not monolithic, and energy and transport projects tend to feature higher levels of ESG exposure risk. This might be why there is not a clear cut association between pollution or vegetation loss with Chinese capital at the portfolio level, and yet, devastating effects from individual PRC-financed infrastructure projects can be found in a specific community.
The Jakarta-Bandung High Speed Rail and Indonesia’s Morowali Industrial Park were two cautionary tales associated with environmental risks from flooding or pollution. The Tanjung Kasam coal-fired power plant in Batam and the Sorik Marapi geothermal power project worsened local health outcomes and triggered a series of injuries and deaths from lax safety protocols.
Beijing faces an uphill battle in converting money into reputational gains. Public approval in Indonesia of Chinese leaders has waned since 2008. Strikingly, this decline occurred even as Indonesia saw much larger inflows of Chinese capital during this period. It could be that Indonesians attribute the benefits of infrastructure-led growth to domestic politicians. Meanwhile, Indonesian citizen and leader surveys surface concerns that the PRC’s economic influence may not be a good thing for their country.
Nevertheless, the PRC may still be poised to make inroads in Indonesian society in other ways. Beijing’s narratives on promoting economic development over democracy appear to align well with prevailing public preferences and Indonesia’s political trajectory. Despite a decline in Indonesia’s performance on expert measures of liberal democracy, citizen surveys have found Indonesians were increasingly satisfied with the quality of their democracy and more likely to prioritize economic development. It could be that Indonesians are redefining how they interpret what it means for democracy to deliver for their society.
6. References
Adhiguna, Putra. (2024). 0.4% of global battery production capacity: Indonesia’s battery and EV developments are far out of step with its nickel exploitation promise. Analysis Outline. Energy Shift Institute. February 2024. https://energyshift.institute/wp-content/uploads/2024/02/Energy-Shift_Indonesia-nickel-and-battery_Feb2024.pdf
Alfian. (2009). PLN to secure $761m in loans from Chinese banks in June. May 26, 2009. The Jakarta Post. https://www.thejakartapost.com/news/2009/05/26/pln-secure-761m-loans-chinese-banks-june.html-0
Ali, M. and F. Wulandari. (2008). Blackout on Indonesia’s Java due to coal disruption. February 21, 2008. Reuters. https://www.reuters.com/article/markets/companies/blackout-on-indonesias-java-due-to-coal-disruption-idUSSP173185/
Anam, K. (2022). KRAS Gandeng BUMN China Operasikan Blast Furnace Complex. September 30, 2022. CNBC Indonesia. https://www.cnbcindonesia.com/market/20220930125044-17-376263/kras-gandeng-bumn-china-operasikan-blast-furnace-complex
Antara. (March 2025). TCTP Batang Indonesia-China berpotensi ciptakan 10.000 lapangan kerja. https://jabar.antaranews.com/rilis-pers/4726533/tctp-batang-indonesia-china-berpotensi-ciptakan-10000-lapangan-kerja
Antara. (October 2013). APP dapat pinjaman 1,8 miliar dolar AS. October 3, 2013. https://www.antaranews.com/berita/398730/app-dapat-pinjaman-18-miliar-dolar-as
Antara. (June 2012). Japan seeks to increase geothermal cooperation with Indonesia. June 22, 2012. https://en.antaranews.com/news/83042/japan-seeks-to-increase-geothermal-cooperation-with-indonesia
Antara. (October 2006). Presiden Yudhoyono ke China 27-31 Oktober. October 18, 2006. https://www.antaranews.com/berita/44694/presiden-yudhoyono-ke-china-27-31-oktober
ASEAN Briefing. (2022). Indonesia to Ban Bauxite Export from June 2023: An Explainer. ASEAN Briefing Doing Business in Indonesia. Retrieved from: https://www.aseanbriefing.com/doing-business-guide/indonesia/sector-insights/indonesia-to-ban-bauxite-export-from-june-2023-an-explainer
Asian Barometer Survey. (2024). Asian Barometer Survey Waves 3, 4, 5, 6. Center for East Asia Democratic Studies, National Taiwan University. Retrieved from https://www.asianbarometer.org/data?page=d10.
Asian Development Bank. (n.d.) Publicly Disclosed Debarment or Suspension. Retrieved from: https://sanctions.adb.org/sanctions/published
Asian Development Bank. (2023). Loan agreement (Ordinary Operations): [Supporting Essential Health Actions and Transformation Program]. https://www.adb.org/sites/default/files/project-documents/54224/54224-001-lna-en.pdf
Asia Maritime Transparency Initiative. (2024). Seismic Strife: China and Indonesia Clash Over Natuna Survey. October 28, 2024. https://amti.csis.org/seismic-strife-china-and-indonesia-clash-over-natuna-survey/
Brown, D. and J. Harris. (2024). From Forests to Electric Vehicles: Quantifying and Addressing the Environmental Toll of Indonesian Nickel. Mighty Earth. May 2024. https://mightyearth.org/wp-content/uploads/2024/05/FromForeststoEVs.pdf
Brummitt, C. and N. Chatterjee. (2015). Indonesia Scraps Bullet Train, Seeks Fresh China, Japan Bids. https://www.bloomberg.com/news/articles/2015-09-03/indonesia-scraps-bullet-train-seeks-new-bids-from-china-japan
Burgess, B., Henares, T. J. G., Kim, E. Y., Mathew., D., Solis, J. A., and N. Sritharan. (2024). Investing in Narratives: How Beijing promotes its development projects in the Philippines. Williamsburg, VA: AidData at William & Mary. https://www.aiddata.org/publications/investing-in-narratives
Cabinet Secretariat of Indonesia. (2025, January 16). President Prabowo Subianto expresses optimism for 8% economic growth. https://setkab.go.id/en/president-prabowo-subianto-expresses-optimism-for-8-economic-growth
Cahyafitri, R. (2014, July 1). Tangguh LNG price raised after deal. The Jakarta Post. https://www.thejakartapost.com/news/2014/07/01/tangguh-lng-price-raised-after-deal.html
Cai, D. (2023, October 2). China Belt and Road: Indonesia opens Whoosh high-speed railway. BBC News. https://www.bbc.com/news/world-asia-66979810
China Power. (2017, August). How Much Trade Transits the South China Sea? Updated January 25, 2021. CSIS. Accessed May 14, 2025. https://chinapower.csis.org/much-trade-transits-south-china-sea/
Chinese Embassy. (2004). “China and Indonesia.” April 22, 2004. http://id.china-embassy.gov.cn/indo/zgyyn/sbgxgk/200404/t20040422_2347161.htm
Chinese Embassy. (2009). Bentang Utama Jembatan SURAMADU Tersambung. April 1, 2009. http://id.china-embassy.gov.cn/indo/sgdt/200904/t20090402_2039859.htm
Coppedge, M., Gerring, J., Knutsen, C. H., Lindberg, S. I., Teorell, J., Altman, D., Angiolillo, F., Bernhard, M., Cornell, A., Fish, M. S., Fox, L., Gastaldi, L., Gjerløw, H., Glynn, A., Good God, A., Grahn, S., Hicken, A., Kinzelbach, K., Krusell, J., Marquardt, K. L., McMann, K., Mechkova, V., Medzihorsky, J., Natsika, N., Neundorf, A., Paxton, P., Pemstein, D., von Römer, J., Seim, B., Sigman, R., Skaaning, S.-E., Staton, J., Sundström, A., Tannenberg, M., Tzelgov, E., Wang, Y.-t., Wiebrecht, F., Wig, T., Wilson, S., and Ziblatt, D. (2025). V-Dem [Country-Year/Country-Date] Dataset v15. Varieties of Democracy (V-Dem) Project. https://doi.org/10.23696/vdemds25.
Costa, F. and Forte, R. (2022, December). A Review of the Literature on International Joint Ventures: A Bibliometric Study for the Period 1975-2019. Studies in Business and Economics 17(3):35-56. DOI:10.2478/sbe-2022-0044 https://www.researchgate.net/publication/367502055_A_Review_of_the_Literature_on_International_Joint_Ventures_A_Bibliometric_Study_for_the_Period_1975-2019
Crombach, L., and Smits, J. (2024). The Subnational Corruption Database: Grand and petty corruption in 1,473 regions of 178 countries, 1995–2022 [Data set]. Figshare. https://doi.org/10.6084/m9.figshare.c.7061534.v1.
Custer, S., Horigoshi, A., Boer, B., and Marshall, K. (2025). Listening to leaders 2025: Development cooperation over a decade of disruption. Williamsburg, VA: AidData at William & Mary. https://www.aiddata.org/publications/listening-to-leaders-2025-development-cooperation-over-a-decade-of-disruption
Custer, S., Burgess, B., Solis, J. A., Sritharan, N. and D. Mathew. (2024). Beijing’s Big Bet on the Philippines: Decoding two decades of China’s financing for development. Williamsburg, VA: AidData at William & Mary. https://www.aiddata.org/publications/balancing-risk-and-reward-decoding-two-decades-of-chinas-financing-for-development
Custer, S., Dreher, A., Elston, T.B., Escobar, B., Fedorochko, R., Fuchs, A., Ghose, S., Lin, J., Malik, A., Parks, B.C., Solomon, K., Strange, A., Tierney, M.J., Vlasto, L., Walsh, K., Wang, F., Zaleski, L., and Zhang, S. (2023). Tracking Chinese Development Finance: An Application of AidData’s TUFF 3.0 Methodology. Williamsburg, VA: AidData at William & Mary.
Custer, S., Sethi, T., Knight, R., Hutchinson, A., Choo, V., and Cheng, M. (2021). Listening to leaders 2021: A report card for development partners in an era of contested cooperation. Williamsburg, VA: AidData at William & Mary. https://www.aiddata.org/publications/listening-to-leaders-2021
Custer, S., Schon, J., Horigoshi, A., Mathew, D., Burgess, B., Choo, V., Hutchinson, A., Baehr, A., and K. Marshall (2021). Corridors of Power: How Beijing uses economic, social, and network ties to exert influence along the Silk Road. Williamsburg, VA: AidData at William & Mary. https://www.aiddata.org/publications/corridors-of-power
Darmawan, A.R. (2024). Has Indonesia fallen into China’s nine-dash line trap? November 12, 2024. The Interpreter. The Lowy Institute. https://www.lowyinstitute.org/the-interpreter/has-indonesia-fallen-china-s-nine-dash-line-trap
Darmawan, A.R. (2020). Jakarta should be wary of Beijing’s South China Sea proposals. The Interpreter. The Lowy Institute. August 28, 2020. https://www.lowyinstitute.org/the-interpreter/jakarta-should-be-wary-beijing-s-south-china-sea-proposals
Detik. (2006). RI-Cina Teken Kontrak Proyek Energi US$3,56 Miliar. DetikFinance. October 28, 2006. https://finance.detik.com/berita-ekonomi-bisnis/d-700393/ri-cina-teken-kontrak-proyek-energi-us-3-56-miliar
detikNews. (2008, May 27). PLN Dapat Pendanaan US$ 592 Juta dari Bank of China. Detikfinance. https://finance.detik.com/berita-ekonomi-bisnis/d-946063/pln-dapat-pendanaan-us-592-juta-dari-bank-of-china
detikNews. (2008, September 3). SB Setuju Pansus Undang Mega, Taufiq dan SBY. Detiknews. https://news.detik.com/berita/d-999796/sb-setuju-pansus-undang-mega-taufiq-dan-sby
Detik. (2009). Menkeu Bertolak ke China Nego Pembiayaan Program 10,000 MW. DetikFinance. March 18, 2009. https://finance.detik.com/berita-ekonomi-bisnis/d-1101090/menkeu-bertolak-ke-china-nego-pembiayaan-program-10-000mw
Dreher, A., Fuchs, A., Parks, B., Strange, A., and Tierney, M. (2022). Banking on Beijing: The Aims and Impacts of China's Overseas Development Program. Cambridge: Cambridge University Press. doi:10.1017/9781108564496
The Economist. (2014). Smeltdown. January 18, 2014. https://www.economist.com/business/2014/01/18/smeltdown
Escobar, B., Malik, A. A., Zhang, S., Walsh, K., Joosse, A., Parks, B. C., Zimmerman, J., and R. Fedorochko. (2025). Power Playbook: Beijing’s Bid to Secure Overseas Transition Minerals. Williamsburg, VA: AidData at William & Mary. https://www.aiddata.org/publications/power-playbook-beijings-bid-to-secure-overseas-transition-minerals
Esterman, I. (2017). Japanese, Singaporean banks finance controversial Indonesian coal plant. March 6, 2017. Mongabay. https://news.mongabay.com/2017/03/japanese-singaporean-banks-finance-controversial-indonesian-coal-plant/
Ewe, K. (2024, February 5). Trouble inventing paradise: Beijing-based development bank faces inflection point as concerns mount over ‘New Bali’ project. TIME. https://time.com/6590390/mandalika-indonesia-aiib-development-concerns/
Fauziyah, N.N. (2024). Whoosh High-Speed Train Ambition a 'Time Bomb' for Prabowo Subianto's Administration: Senior Economist. July 10, 2024. Tempo. https://en.tempo.co/read/1892550/whoosh-high-speed-train-ambition-a-time-bomb-for-prabowo-subiantos-administration-senior-economist
Financial Times. (2025). The Opec of nickel: Indonesia’s control of a critical metal. https://www.ft.com/content/0bbbe7c7-12a1-43ba-8bef-c5c546367a0e
Financial Times. (2024). Western miner Eramet sees no profits in nickel processing. https://www.ft.com/content/e42d5e3e-30ff-4698-8348-d0e6731f2271
Fox News. (2005). Indonesia Reasserts Control Over Aid. January 13, 2005. https://www.foxnews.com/story/indonesia-reasserts-control-over-aid
Franck, M. (2010). The impact of constructing the Suramadu Bridge in the Indonesian town of Surabaya. January 2010. https://books.openedition.org/editionscnrs/12639
Freedom House. (2024) Freedom in the World 2024. https://freedomhouse.org/report/freedom-world#Data
Gallup. (2025). Gallup World Poll, 2006-2024 [Data set]. Washington, DC: Gallup Inc.
Gelpern, A., Horn, S., Morris, S., Parks, B., and Trebesch, C. (2021, March 31). How China lends: A rare look into 100 debt contracts with foreign governments. AidData at William & Mary. https://docs.aiddata.org/reports/how-china-lends.html
Global Data Lab. (2024). Subnational Human Development Index (SHDI) Database, Version 7.0. Retrieved from https://globaldatalab.org/shdi/.
Gorton, G and Souleles, N. (2007). Special purpose vehicles and securitization. In M. Carey and R. M. Stulz (Eds.), The risks of financial institutions. University of Chicago Press. http://www.nber.org/chapters/c9619
Government of Indonesia. (2007). Law of the Republic of Indonesia number 17 of 2007 on long-term national development plan of 2005–2025. Office of the President of the Republic of Indonesia. https://policy.asiapacificenergy.org/sites/default/files/LONG-TERM%20NATIONAL%20DEVELOPMENT%20PLAN%20OF%202005-2025%20%28EN%29.pdf
Grimm, D. J. (2014). Traversing the minefield: Joint ventures and the Foreign Corrupt Practices Act. Virginia Law and Business Review, 9(1), 91-152. https://fcpa.stanford.edu/academic-articles/20140901-traversing-the-minefield-joint-ventures-and-the-fcpa.pdf
Ha, H. T. (2023, December 14). Late to the party: Vietnam and the Belt and Road Initiative. FULCRUM. https://fulcrum.sg/late-to-the-party-vietnam-and-the-belt-and-road-initiative/
Hadi, A. (2024). Whoosh burden bleeding finances, WIKA tells House. July 9, 2024. The Jakarta Post. https://www.thejakartapost.com/business/2024/07/09/whoosh-burden-bleeding-finances-wika-tells-house.html.
Harsaputra, I. (2009). Indonesia’s longest bridge set for operation. June 10, 2009. Jakarta Post. https://www.thejakartapost.com/news/2009/06/10/indonesia039s-longest-bridge-set-operation.html
Harsaputra, I. and A. Faisal. (2009). Opening of Suramadu bridge could leave thousands jobless. June 11, 2009. Jakarta Post. https://www.thejakartapost.com/news/2009/06/11/opening-suramadu-bridge-could-leave-thousands-jobless.html
Harsaputra, I. and W. Boediwardhana. (2008). Suramadu bridge expected to be completed next year. April 7, 2008. Jakarta Post. https://www.thejakartapost.com/news/2008/04/07/suramadu-bridge-expected-be-completed-next-year.html
Herlijanto, J. (2017). Old Stereotypes, New Convictions: Pribumi Perceptions of Ethnic Chinese in Indonesia. Trends in Southeast Asia. No. 6. ISEAS-Yusof Ishak Institute. https://bookshop.iseas.edu.sg/publication/2253
Hillman, J. and D. Sacks. (2021).China’s Belt and Road: Implications for the United States. Updated March 2021. Task Force Report No. 79. Council on Foreign Relations. https://www.cfr.org/task-force-report/chinas-belt-and-road-implications-for-the-united-states/findings
Hodge, A. and D. Septiari. (2023). Jokowi’s solar vision ignites fiery protest. The Australian Online. September 22, 2023. Retrieved from Factiva.
Home, A. (2018). China's Tsingshan rains on nickel bulls' party: Andy Home. Reuters. October 30, 2018. https://www.reuters.com/article/world/chinas-tsingshan-rains-on-nickel-bulls-party-andy-home-idUSKCN1N426X/
Hunan Electric Power Design Institute Co., Ltd. https://www.worldbank.org/en/news/press-release/2019/09/11/world-bank-group-debars-china-energy-engineering-group-hunan-electric-power-design-institute-co-ltd
Ibrahim, A., and Karmini, N. (2023, October 2). Indonesia's president launched Southeast Asia’s first high-speed railway, which was funded by China. Associated Press. https://apnews.com/article/indonesia-china-high-speed-railway-widodo-1d0be6de98724f5ecdfb799e5d826fd6
IDX Channel. (November 2024). Lini Imaji (FUTR) and China Construction (CSCEC) Cooperation in Energy Infrastructure Development. https://www.idxchannel.com/market-news/lini-imaji-futr-dan-china-construction-cscec-kerja-sama-pengembangan-infrastruktur-energi
IESR. (2017). 2 Tahun Jokowi, Sudah 11,000 MW Pembangkit Listrik Dibangun. April 2, 2017. https://iesr.or.id/2-tahun-jokowi-sudah-11-000-mw-pembangkit-listrik-dibangun-2/
Indonesia Business Post. Indonesia grapples with high costs and debt guarantees in Jakarta-Bandung high-speed rail project. September 25, 2023. https://indonesiabusinesspost.com/1686/investment-and-risk/indonesia-grapples-with-high-costs-and-debt-guarantees-in-jakarta-bandung-high-speed-rail-project
Indonesia Business Post. (2008, October 1). JICA to provide US$3 billion for MRT East-West Phase 1 Stage 1 project. Indonesia Business Post. https://indonesiabusinesspost.com/2008/investment-and-risk/jica-to-provide-us-3-billion-for-mrt-east-west-phase-1-stage-1-project
Indonesia SEZ. (n.d.). Galang Batang SEZ. Secretariat General for the National Council for Special Economic Zones. Retrieved from: https://kek.go.id/investment/distribution/kek-galang-batang
Indonesian Statistics Agency. (2025). Statistical Yearbook of Indonesia. (2004 - 2025). February 28, 2025. BPS-Statistics. (Multiple yearbooks were accessed for data analysis). https://www.bps.go.id/en/publication/2025/02/28/8cfe1a589ad3693396d3db9f/statistical-yearbook-of-indonesia-2025.html
International Monetary Fund (IMF). (2020, April). State-Owned Enterprises: The Other Government. In Fiscal Monitor, April 2020 (pp. 45-60). https://www.imf.org/en/Publications/FM/Issues/2020/04/06/fiscal-monitor-april-2020#Chapter%203
International Monetary Fund. Asia and Pacific Dept. (2024). China’s Foreign Direct Investment: Inward and Outward. IMF Staff Country Reports, 2024(276), A004. Retrieved May 13, 2025, from https://doi.org/10.5089/9798400285998.002.A004
Irham, M. and A. Ajengrastri. (2023). Rempang Eco-City: ‘We will not leave’, say the islanders fighting eviction. October 19, 2023. BBC. https://www.bbc.com/news/world-asia-67051969
Irwin-Hunt. (2024). Sumatra posts fastest FDI regional growth in 2023. fDi Intelligence. April 15 2024. Retrieved from: https://www.fdiintelligence.com/content/ee6ec696-1f40-51c8-a2ac-7542624f73db
Isaac, J. (2025, June 3). Japan backs Indonesia's Kayan hydropower project to boost renewable energy goals. Indonesia Business Post. https://indonesiabusinesspost.com/3844/energy-and-resources/japan-backs-indonesias-kayan-hydropower-project-to-boost-renewable-energy-goals
Isabella, Y. (2023, April 9). Indonesia backs hydro to power new capital city. Eco-Business. https://www.eco-business.com/news/indonesia-backs-hydro-to-power-new-capital-city/
ITA. (2023). Indonesia Critical Minerals. Market Intelligence. U.S. International Trade Administration.September 27, 2023. https://www.trade.gov/market-intelligence/indonesia-critical-minerals
The Jakarta Post. (2023). Better safe than sorry. August 9, 2023. https://www.thejakartapost.com/opinion/2023/08/09/better-safe-than-sorry.html
The Jakarta Post. (2019). Indonesia to ban nickel exports from January 2020. September 2, 2019. https://www.thejakartapost.com/news/2019/09/02/indonesia-to-ban-nickel-exports-from-january-2020.html
The Jakarta Post. (2010). Editorial: OECD and our homework. November 3, 2010. https://www.thejakartapost.com/news/2010/11/03/editorial-oecd-and-our-homework.html
The Jakarta Post. (2009). The Suramadu Bridge. June 10, 2009. https://www.thejakartapost.com/news/2009/06/10/the-suramadu-bridge.html
The Jakarta Post. (2008). Indonesia, China relations almost in honeymoon state: Sudrajat. April 14, 2008. https://www.thejakartapost.com/news/2008/04/14/indonesia-china-relations-almost-honeymoon-state-sudrajat.html
Japan Overseas Infrastructure Investment Corporation for Transport and Urban Development (2020). Brown-field Toll Road Projects. https://www.join-future.co.jp/english/investments/achievement/index.php?c=investment_en_view&pk=1603170681
JBIC. (2017). Project Finance for Re-expansion of Tanjung Jati B Coal-Fired Power Plant in Indonesia. February 27, 2017. https://www.jbic.go.jp/en/information/press/press-2016/0227-53953.html
JDIH. (2009). Pertambangan Mineral dan Batubara Undang-undangan UU) No. 4 Tahun 2009. Database Peraturan. https://peraturan.bpk.go.id/Details/38578/uu-no-4-tahun-2009
Jong, H.N. (2023). Investors over islanders as Indonesia uses force to push development projects. September 21, 2023. Mongabay. https://news.mongabay.com/2023/09/investors-over-islanders-as-indonesia-uses-force-to-push-development-project/
Juwita, R. D. (2025, April 24). CATL slashes funding for Indonesian EV battery project by 65%. The Jakarta Post. https://www.thejakartapost.com/business/2025/04/24/catl-slashes-funding-for-indonesian-ev-battery-project-by-65.html
King, G. (2025). Six Months of Prabowo: Indonesia’s Diplomatic Charm Offensive. May 5, 2025. Center for Strategic and International Studies. https://www.csis.org/blogs/new-perspectives-asia/six-months-prabowo-indonesias-diplomatic-charm-offensive
Kompas. (2009). PLTU 10,000 MW Akan Berjalan Tanpa Masalah. March 23, 2009. https://bola.kompas.com/read/2009/03/23/1606386/pltu.10.000.mw.akan.berjalan.tanpa.masalah
Kontan. (2024). Konsumsi Nikel pada 2025 Diproyeksi Meningkat di Tengah Potensi Pemangkasan Produksi. December 30, 2024. https://industri.kontan.co.id/news/konsumsi-nikel-pada-2025-diproyeksi-meningkat-di-tengah-potensi-pemangkasan-produksi
Kontan. (2009). Baru JBIC dan World Bank yang Siap danai 10,000 MW Tahap II. January 30, 2009. https://industri.kontan.co.id/news/baru-jbic-dan-world-bank-yang-siap-danai-10.000-mw-tahap-ii
Koswaraputra, D. (2024, June 14). Indonesia: Kayan Cascade hydropower project moves forward amid partner withdrawals, environmental and displacement concerns. Business and Human Rights Resource Centre. https://www.business-humanrights.org/en/latest-news/indonesia-kayan-cascade-hydropower-project-advances-amid-partner-exits-environmental-displacement-concerns/
Laksmana, E. A. (2017). Pragmatic equidistance: How Indonesia manages its great power relations. In D. Denoon (Ed.), China, the United States, and the future of Southeast Asia. https://papers.ssrn.com/sol3/papers.cfm?abstract_id=2761998
Lalisang, A.E.Y. and D.S. Candra. (2020). Indonesiaʿs Global Maritime Fulcrum and Chinaʿs Belt Road Initiative https://asia.fes.de/news/indonesias-global-maritime-fulcrum-chinas-belt-road-initiative-a-match-made-at-sea-1.html
Liputan 6. (2002). A. Dahana: Diplomasi Dansa RI-Cina Bernuansa Romantisme. Updated January 24, 2017. https://www.liputan6.com/news/read/31365/a-dahana-diplomasi-dansa-ri-cina-bernuansa-romantisme
Liu, Y., and Rayi, A. (2024, October 29). What lies ahead for China-Indonesia relations under Indonesia’s new president? APCO Worldwide. https://www.apcoworldwide.com/blog/what-lies-ahead-for-china-indonesia-relations-under-indonesias-new-president/
Lubis, A. M. and Maqoma, R. I. (2024, April 4). 8 ways to ensure Indonesia’s nickel sector is sustainable. The Conversation. Retrieved from: https://theconversation.com/8-ways-to-ensure-indonesias-nickel-sector-is-sustainable-226747
Mahardhika, L.A. and H. Wibawa. (2023). Bisnis Indonesia - Proyek strategis nasional: Konsesi lama kereta cepat. Translated by Price Waterhouse Cooper. February 17, 2023. https://www.pwc.com/id/en/media-centre/infrastructure-news/february-2023/national-strategic-project-long-concession-for-high-speed-railway.html
Market Forces. (2017). Foreign Finance to Indonesian Coal. https://www.marketforces.org.au/research/indonesia/public-finance-to-indonesian-coal/
Mathew, D. and Custer, S. 2023. Aid in the National Interest: How America’s Comparators Structure their Development Assistance. Williamsburg, VA: AidData at William & Mary. Retrieved from: https://www.aiddata.org/publications/aid-in-the-national-interest-how-americas-comparators-structure-their-development-assistance
Ministry of Energy and Mineral Resources [MEMR]. (2014, July 1). Renegosiasi berhasil, harga gas tangguh naik jadi US$ 8 mulai 1 Juli 2014. Kementerian ESDM Direktorat Jenderal Minyak Dan Gas Bumi. https://migas.esdm.go.id/post/Renegosiasi-Berhasil,-Harga-Gas-Tangguh-Naik-Jadi-US$-8-Mulai-1-Juli-2014
Maulia, E. and Damayanti, I. (2022). Indonesia’s Jokowi bans bauxite exports from June, China likely hurt. Nikkei Asia. 21 December 2022. Retrieved from: https://asia.nikkei.com/Business/Markets/Commodities/Jokowi-announces-bauxite-export-ban-for-June-defies-WTO
MEMR. (2008). Perkembangan Program Percepatan 10,000 MW. June 16, 2008. Kementerian Energi dan Sumber Daya Mineral. Republik Indonesia. https://www.esdm.go.id/id/media-center/arsip-berita/perkembangan-program-percepatan-10000-mw
Merwin, M. (2022). Indonesia’s Nickel Export Ban: Impacts on Supply Chains and the Energy Transition. Interview with Michael Merwin. National Bureau of Asian Research. November 19, 2022. https://www.nbr.org/publication/indonesias-nickel-export-ban-impacts-on-supply-chains-and-the-energy-transition/
Miller, R., Glen, J., Jaspersen, F., and Karmokolias, Y. (1997). International joint ventures in developing countries. Finance and Development, 34(1), 7-10. https://www.imf.org/external/pubs/ft/fandd/1997/03/pdf/miller.pdf
Minister of Trade of Indonesia. (2025). Neraca Perdagangan Dengan Mitra Dagang. Satu Data. https://satudata.kemendag.go.id/data-informasi/perdagangan-luar-negeri/neraca-perdagangan-dengan-mitra-dagang
Ministry of Trade of Indonesia. (2013). Circular of the Director General of Foreign Trade Number 04/M-DAG/ED/12/2013. The Extension of Export Approval of Mining Products. Retrieved from: https://faolex.fao.org/docs/pdf/ins133221.pdf
Ministry of Trade of Indonesia. (2012). Regulation of the Minister of Trade No. 29/M-DAG/PER/5/2012. Concerning Provisions on the Export of Mining Goods.
Nabbs-Keller, G. (2020). The contending domestic and international imperatives of Indonesia’s China challenge. Australian Journal of Defence and Strategic Studies, 2(2). https://espace.library.uq.edu.au/view/UQ:ea2ec32
Nabbs-Keller, G. (2011). Growing Convergence, Greater Consequence: The Strategic Implications of Closer Indonesia-China Relations. Security Challenges, 7(3), 23–41. http://www.jstor.org/stable/26467106
Nicola, A., Sarwono, A., Muzzamil, S., and Akbarani, I. (2023). Corruption risk assessment of infrastructure projects in Indonesia. Transparency International Indonesia. https://ti.or.id/wp-content/uploads/2023/12/Laporan-ICRAT_ENG.pdf
Nindita, H. and Z. Feng. (2025a). How China’s investment in Indonesia’s nickel industry is impacting local communities. April 7, 2025. Global Voices. https://globalvoices.org/2025/04/07/how-chinas-investment-in-indonesias-nickel-industry-is-impacting-local-communities/#:~:text=In%202013%2C%20Indonesia,agreement%20for%20the%20industrial%20park
Nindita, H. and Z. Feng. (2025b). Workplace risks loom over Indonesia’s Chinese-funded nickel and steel smelters. April 16, 2025. https://globalvoices.org/2025/04/16/workplace-risks-loom-over-indonesias-chinese-funded-nickel-and-steel-smelters/
Nord, M., Altman, D., Angiolillo, F., Fernandes, T., Good God, A., and Lindberg, S. I. (2025). Democracy report 2025: 25 years of autocratization – Democracy trumped? V-Dem Institute, University of Gothenburg. https://v-dem.net/documents/54/v-dem_dr_2025_lowres_v1.pdf
OCO-2/OCO-3 Science Team, Payne, V., and Chatterjee, A. (2022). OCO-2 Level 2 bias-corrected XCO₂ and other select fields from the full-physics retrieval aggregated as daily files (Retrospective processing V11.1r). Greenbelt, MD, USA: Goddard Earth Sciences Data and Information Services Center.
OECD. (n.d.a). Foreign direct investment (FDI). Organisation for Economic Cooperation and Development. https://www.oecd-ilibrary.org/finance-and-investment/foreign-direct-investment-fdi/indicator-group/english_9a523b18-en#:~:text=Foreign%20Direct%20Investment%20(FDI)%20flows,earnings%2C%20and%20intercompany%20debt%20transactions
OECD. (n.d.b). FDI Statistics Explanatory Note. Retrieved from: https://www.oecd.org/daf/inv/FDI-statistics-explanatory-notes.pdf
Offshore Magazine. (2002). China’s CNOOC to buy Repsol’s Indonesian assets for $585 million. January 18, 2002. https://www.offshore-mag.com/home/article/16768001/chinas-cnooc-to-buy-repsols-indonesian-assets-for-585-million
Oster, S. (2006, September 20). CNOOC finally strikes deal to import Indonesian gas. The Wall Street Journal. https://www.wsj.com/articles/SB115883491134169915
Otto, B. (2015, September 2). Indonesia cancels plans for first high-speed train. The Wall Street Journal. https://www.wsj.com/articles/indonesia-cancels-plans-for-first-high-speed-train-1441340797
Parks, B. C., Malik, A. A., Escobar, B., Zhang, S., Fedorochko, R., Solomon, K., Wang, F., Vlasto, L., Walsh, K. and Goodman, S. (2023) Belt and Road Reboot: Beijing’s Bid to De-Risk Its Global Infrastructure Initiative. Williamsburg, VA: AidData at William & Mary. https://www.aiddata.org/publications/belt-and-road-reboot
Pedelty, J. A., Devadiga, S., Masuoka, E., et al. (2007). Generating a long-term land data record from the AVHRR and MODIS instruments. Proceedings of IGARSS 2007 (pp. 1021–1025). Institute of Electrical and Electronics Engineers.
Pedersen, J.D. (2021). India’s foreign aid policy: Aid recipient and aid donor. In: The Interface of Domestic and International Factors in India’s Foreign Policy. Routledge. https://www.taylorfrancis.com/chapters/edit/10.4324/9781003122302-5/india-foreign-aid-policy-j%C3%B8rgen-dige-pedersen
Pemstein, D., Marquardt, K. L., Tzelgov, E., Wang, Y.-t., Medzihorsky, J., Krusell, J., Miri, F., and von Römer, J. (2025). The V-Dem measurement model: Latent variable analysis for cross-national and cross-temporal expert-coded data (V-Dem Working Paper No. 21, 10th ed.). University of Gothenburg: Varieties of Democracy Institute.
People’s Daily. (2002). China, Indonesia Hold First Energy Forum. Updated September 25, 2002. https://en.people.cn/200209/25/eng20020925_103867.shtml
Perusahaan Listrik Negara (PLN). (2015). PLN Annual Report 2015. https://web.pln.co.id/statics/uploads/2019/11/ARPLN2015.pdf
Pewarta. (2024, December 16). 20 Years of Hard Work and Building Dreams, CSCEC-4 Leaves a Mark on China-Indonesia Cooperation. https://www.pewarta.co.id/2024/12/20-tahun-kerja-keras-dan-membangun-impian-cscec-4-tinggalkan-jejak-dalam-kooperasi-china-dan-indonesia.html
Perwata. (2024, August 9). Jokowi Attends Inauguration of China-Funded Factory Construction Project, Praises China Construction Fourth Engineering Division Corp Ltd. (CSCEC-4) https://www.pewarta.co.id/2024/08/jokowi-hadiri-peresmian-proyek-pembangunan-pabrik-yang-didanai-china-beri-pujian-ke-china-construction-fourth-engineering-division-corp-ltd-cscec-4.html
Pramono, A.H., Manessa, M.D.M., Indrawan, M., Sari, D.A., Fuad, H.A.H., Khasanah, N., Pratiwi, K., Siregar, R.S.E., Winarni, N.L., Supriatna, J., Haryanto, B., Gallagher, K.P., Ray, R., Simmons, B.A., and H. Yogaswara. (2022). China’s Belt and Road Initiative in Indonesia: Mapping and Mitigating Environmental and Social Risks. Boston University. GCI Working Paper 21. July 2022. https://www.bu.edu/gdp/files/2022/07/GCI_WP_021_FIN.pdf
Pratama, R. A. (2022). Kontroversi Blast Furnace Krakatau Steel dari Lahir hingga ke DPR. February 17, 2022. KataData. https://katadata.co.id/indepth/telaah/620e7c2d0db95/kontroversi-blast-furnace-krakatau-steel-dari-lahir-hingga-ke-dpr
Purba, K. (2023). ‘Debt trap’ danger looms in Jakarta-Bandung high-speed train project. April 17, 2023. Jakarta Post. https://www.thejakartapost.com/opinion/2023/04/17/debt-trap-danger-looms-in-jakarta-bandung-high-speed-train-project.html
Qin, J. (2005, April 25). Indonesia now a strategic partner. ChinaDaily.com. https://www.chinadaily.com.cn/english/doc/2005-04/25/content_437349.htm
R20. (n.d.) Nahdlatul Ulama Declaration. G20 Religion Forum. https://g20religion.org/nahdlatul-ulama/
Rahayu, R. (2025). Rempang Eco City Excluded from Prabowo’s List of 77 National Strategic Projects. April 29, 2025. Tempo. https://en.tempo.co/read/2001632/rempang-eco-city-excluded-from-prabowos-list-of-77-national-strategic-projects
Rakhmat, M. Z., and Purnama, Y. (2024). Kandidat calon presiden dan China: Peta interaksi 3 calon presiden 2024 dengan China. Celios. https://celios.co.id/mapping-the-interactions-of-three-2024-indonesian-presidential-candidates-with-china/
Rakhmat, M., et al. (2024). China–Indonesia survey: Insights into Indonesian perceptions of China [Report]. Center of Economic and Law Studies. https://www.celios.co.id
Rakhmat, Z. (2022). China’s Digital Silk Road in Indonesia: Progress and implication. July 28, 2022. LSE IDEAS Strategic Update. https://lseideas.medium.com/chinas-digital-silk-road-in-indonesia-progress-and-implication-b6996172262a
Rakhmat, M. Z. (2022). Getting nods from the Muslims: China’s Muslim diplomacy in Indonesia. International Journal of China Studies, 13(2), 237–264. https://ejournal.um.edu.my/index.php/IJCS/article/view/45503
Reuters. (2025). South Korea's LG Energy Solution pulls out from Indonesia EV battery investment. April 21, 2025.
Reuters. (2017). Indonesia, China consortium sign $4.5 billion loan for rail project. May 15, 2017. https://www.reuters.com/article/economy/indonesia-china-consortium-sign-45-billion-loan-for-rail-project-idUSKCN18B0RW/.
Reuters. (2013, October 16). China's Shandong Nanshan to set up $5 bln aluminium complex in Indonesia. https://www.reuters.com/article/business/chinas-shandong-nanshan-to-set-up-5-bln-aluminium-complex-in-indonesia-idUSL3N0I626M/
Reuters. (January 2009). World Bank bars seven firms including four from China. https://www.reuters.com/article/idUSTRE50E0GX/
Reuters. (2025, February 5). Chinese firms control around 75% of Indonesian nickel capacity, report finds. https://www.reuters.com/markets/commodities/chinese-firms-control-around-75-indonesian-nickel-capacity-report-finds-2025-02-05/
Reuters. (2024, November 14). Indonesian president says he will safeguard sovereignty in South China Sea. https://www.reuters.com/world/asia-pacific/indonesian-president-says-he-will-safeguard-sovereignty-south-china-sea-2024-11-14/
Ribeiro, H., Holman, J., and L. Tang. (2021). Rising EV-grade nickel demand fuels interest in risky HPAL process. March 3, 2021. Commodity Insights Blog. S&P Global. https://www.spglobal.com/commodity-insights/en/news-research/blog/metals/030321-nickel-hpal-technology-ev-batteries-emissions-environment-mining
Rondonuwu, O. (2015, August 26). China, Japan battle to build Indonesia's first bullet train. Yahoo! Finance. https://sg.finance.yahoo.com/news/china-japan-battle-build-indonesias-first-bullet-train-045027947--finance.html?guccounter=1
RSF. (n.d.). Indonesia. 2025 World Press Freedom Index. https://rsf.org/en/country/indonesia
Sambodo, M. T., and Oyama, T. (2010). The electricity sector before and after the Fast Track Program. Economics and Finance in Indonesia, 58(3), 285–308. https://www.lpem.org/repec/lpe/efijnl/201013.pdf
Sampurna, R. H. (2018). Is China a threat to Indonesia: A discourse analysis of major Indonesian newspapers’ coverage on the China issues. JISPO: Jurnal Ilmu Sosial dan Ilmu Politik, 8(1), 209–231. https://doi.org/10.15575/jispo.v8i1.4317.
SASAC. (2025). China's Local State-Owned Enterprises Maintained Steady Operations in 2024. February 21, 2025. http://en.sasac.gov.cn/2025/02/21/c_18863.htm
Sebayang, R. (2022). China-RI CSCEC Staff Exchange Views on Environmentally Friendly Construction. 26 May 2022. IDN Times. https://www.idntimes.com/business/economy/rehia-indrayanti-br-sebayang/staf-cscec-china-ri-tukar-pandangan-soal-konstruksi-ramah-lingkungan.
Seneca ESG. (2023, September 20). PowerChina, Japan’s Sumitomo to develop USD17.bn hydropower plant in Indonesia. Seneca ESG. https://senecaesg.com/insights/powerchina-japans-sumitomo-to-develop-usd17-bn-hydropower-plant-in-indonesia/
Sengupta, D. (2023). Nanshan Aluminum to spin-off Indonesian business, leading Nanshan International to emerge as a separate entity. AL Circle. 10 October 2023. Retrieved from: https://www.alcircle.com/news/nanshan-aluminium-to-spin-off-indonesian-business-leading-nanshan-international-to-emerge-as-a-separate-entity-101616
Shanghai Nonferrous Metals Network. (2022, April 15). The total investment is nearly 6 billion US dollars! Ningde era and Indonesia join hands to build power battery industry chain project. https://news.metal.com/newscontent/101806191/the-total-investment-is-nearly-6-billion-us-dollars-ningde-era-and-indonesia-join-hands-to-build-power-battery-industry-chain-project/
Sharma, Y. (2022). Confucius Institutes reappear under new names – Report. University World News. 30 June 2022. Retrieved from: https://www.universityworldnews.com/post.php?story=20220630152610783
Sidik, S. (2020). Selamatkan Ekonomi RI, BRI Restruktrisasi Kredit Rp 190 T. October 6, 2020. CNBC Indonesia. https://www.cnbcindonesia.com/market/20201006142302-17-192248/selamatkan-ekonomi-ri-bri-restruktrisasi-kredit-rp-190-t
Sihaloho, M.J. (2016). Ini Gaya Diplomasi Megawati Taklukkan Hati Jiang Zemin Saat Negosiasi LNG Tangguh. May 25, 2016. BeritaSatu.https://www.beritasatu.com/ekonomi/366650/ini-gaya-diplomasi-megawati-taklukkan-hati-jiang-zemin-saat-negosiasi-lng-tangguh
Smith, A.L. (2000). “Indonesia’s Foreign Policy under Abdurrahman Wahid: Radical or Status Quo State?” Contemporary Southeast Asia, vol. 22, no. 3, 2000, pp. 498–526. JSTOR, http://www.jstor.org/stable/25798509. Accessed 15 Apr. 2025.
Smits, J., and Permanyer, I. (2019). The Subnational Human Development Database. Scientific Data, 6, Article 190038. https://doi.org/10.1038/sdata.2019.38.
Soeriaatmadja, W. (2023). Indonesia promises better relocation package for islanders after clashes over Chinese project. The Straits Times. September 17 2023. Retrieved from Factiva. https://www.straitstimes.com/asia/se-asia/indonesia-promises-better-relocation-package-for-islanders-after-clashes-over-chinese-project
Sori, R. (2009,Maret 27). Dua setengah tahun MOU dana 10.000 MW RI-China belum cair juga. IESR. https://iesr.or.id/dua-setengah-tahun-mou-dana-10-000-mw-ri-china-belum-cair-juga/
Sritharan, N., and Rizkallah, P. (2024, April 5). Navigating Sinophobia amid Indonesia’s economic ascent. 9DASHLINE. https://www.9dashline.com/article/navigating-sinophobia-amid-indonesias-economic-ascent
Shofa, J.N. (2024). Indonesia Secures $903 million Japanese loan to extend MRT Project. May 13, 2024. Jakarta Globe. https://jakartaglobe.id/news/indonesia-secures-903-million-japanese-loan-to-extend-mrt-project
Strangio, S. (2025). China’s Xi Hails Ties With Indonesia Ahead of Southeast Asia Tour. The Diplomat. 14 April, 2025. Retrieved from: https://thediplomat.com/2025/04/chinas-xi-hails-ties-with-indonesia-ahead-of-southeast-asia-tour/
Strangio, S. (2022). Indonesia to Ban Exports of Bauxite From June 2023. The Diplomat. 22 December 2022. Retrieved from: https://thediplomat.com/2022/12/indonesia-to-ban-exports-of-bauxite-from-june-2023/
Stuart, M. R. and Maughn R. D. (2012) International Joint Ventures, A Practical Approach. https://www.dwt.com/-/media/files/publications/2012/05/international-joint-ventures-a-practical-approach/files/international-joint-ventures-article_stewart/fileattachment/international-joint-ventures-article_stewart.pdf
Sukma, R. (2009). Indonesia-China Relations: The Politics of Reengagement. Living with China, 89–106. doi:10.1057/9780230622623_6;
Susanty, F. (2017). S. Korea looks to develop RI infrastructure. November 13, 2017. The Jakarta Post. https://www.thejakartapost.com/news/2017/11/13/s-korea-looks-develop-ri-infrastructure.html
Tang, W. (2018, October 14). World Bank, ADB commit $1B each for disaster recovery. The Jakarta Post. https://www.thejakartapost.com/news/2018/10/14/world-bank-adb-commit-1b-in-loans-each-for-disaster-recovery.htm
Tempo. (2024). 21 Tahu Jembatan Suramadu, Beriut 7 Fakta Pembangunan Jembatan Berbiaya Rp 4,5 Triliun. June 10, 2024. https://www.tempo.co/politik/21-tahun-jembatan-suramadu-berikut-7-fakta-pembangunan-jembatan-berbiaya-rp-4-5-triliun-50597
Tempo. (2023). Ekonom Ini Perkirakan Balik Modal Kereta Cepat Whoosh 80 Tahun Sesuai Masa Konsesi. October 19, 2023. https://www.tempo.co/ekonomi/ekonom-ini-perkirakan-balik-modal-kereta-cepat-whoosh-80-tahun-sesuai-masa-konsesi-130798
Tempo. (2022). Kerugian Negara di Kasus Krakatau Steel Ditaksir Mencapai Rp 6,9 Triliun. July 18, 2022. https://www.tempo.co/hukum/kerugian-negara-di-kasus-krakatau-steel-ditaksir-mencapai-rp-6-9-triliun-321453
Tempo. (2002). Megawati, the Dance and LNG. April 2, 2002. https://magz.tempo.co/read/economy/4704/megawati-the-dance-and-lng
Thee, K. W. (2012). The Impact of the Global Financial Crisis on the Indonesian Economy and the Prospects for the Resumption of Rapid and Sustained Growth. Chapter in Indonesia’s Economy since Independence (pp. 126–136). ISEAS–Yusof Ishak Institute.
Treadgold, T. (2025, January 24) Indonesia Follows The Chinese Market-Control Playbook In Nickel. Forbes. https://www.forbes.com/sites/timtreadgold/2025/01/24/indonesia-follows-the-chinese-market-control-playbook-in-nickel/
Tritto, A. (2023, April 11). How Indonesia used Chinese industrial investments to turn nickel into the new gold. Carnegie Endowment for International Peace. https://carnegieendowment.org/research/2023/04/how-indonesia-used-chinese-industrial-investments-to-turn-nickel-into-the-new-gold?lang=en
UNDP. (2024). Bridging the Digital Divide: Skill Our Future Platforms to Empower Indonesian Youth. March 28, 2024. Press Release. https://www.undp.org/indonesia/press-releases/bridging-digital-divide-skill-our-future-platforms-empower-indonesian-youth#:~:text=Indonesia%20is%20home%20to%20a,a%20developed%20country%20in%202045.
U.S. SBA (Small Business Administration). (2018). Understanding Joint Ventures. https://business.defense.gov/Portals/57/understanding%20joint%20ventures%20SBTW18.pdf?ver=2018-05-01-184900-317
Visscher, S. (1993). Sino-Indonesian Relations. China Information, 8 (1-2), 93–106. https://journals.sagepub.com/doi/10.1177/0920203X9300800104
Weaver, L.R. (2002). Loans a ‘motivation’ for Megawati in China. March 25, 2002. CNN. https://edition.cnn.com/2002/WORLD/asiapcf/east/03/25/china.indon/
Winzenried, S. and F. Adhitya. (2014). Export ban on unprocessed minerals effective 12 January 2014– three-year reprieve for some, but uncertainty remains. PWC Indonesia Energy, Utilities and Mining Newsflash No. 50. January 2015. Retrieved from: https://www.pwc.com/id/en/publications/assets/eumpublications/newsflash/2014/eumnewsflash-50.pdf
Wood Mackenzie. (2023). The rise and rise of Indonesian HPAL - can it continue. April 4, 2023. https://www.woodmac.com/news/opinion/rise-of-indonesian-hpal/
World Bank. (n.d.) Sanctions System. Retrieved from: https://www.worldbank.org/en/about/unit/sanctions-system/about
World Bank. (June 2019). World Bank Group Debars China Railway Construction Corporation Ltd. and two subsidiaries. https://www.worldbank.org/en/news/press-release/2019/06/05/world-bank-group-debars-china-railway-construction-corporation-ltd-and-two-subsidiaries
World Bank. (September 2019). World Bank Group Debars China Energy Engineering Group. https://www.worldbank.org/en/news/press-release/2019/09/11/world-bank-group-debars-china-energy-engineering-group-hunan-electric-power-design-institute-co-ltd
World Trade Organization. (2022). Indonesia – Measures Relating to Raw Materials. WT/DS592/R. 30 November 2022. Retrieved from: https://www.wto.org/english/tratop_e/dispu_e/592r_e.pdf
XL Axiata. (2024). https://www.xlaxiata.co.id/en/news/xl-axiata-and-smartfren-announce-idr-104-trillion
Yeung, C. (2024). The Belt and Road Initiative 10 Years Later: China’s Transition to ‘Small and Beautiful’. March 19, 2024. Asia Pacific Foundation of Canada. https://www.asiapacific.ca/publication/china-belt-and-road-initiative-10-years-later
Yudhoyono, S.B. (2025). Memimpin di Tengah Krisis: Kisah SBY dan Tsunami Aceh. YouTube. https://www.youtube.com/watch?v=oKvryPDy0e4
Yu, C.J. and Tang, M. (1992). International Joint Ventures: Theoretical Considerations. Managerial and Decision Economics, Vol. 13, No. 4, pp. 331-342. Wiley. https://www.jstor.org/stable/2487765
Zhou, T. (2019). Migration in the Time of Revolution: China, Indonesia, and the Cold War. Cornell University Press. http://www.jstor.org/stable/10.7591/j.ctvfc51sh
[1] According to Chinese scholar Xiang Haoyu (2023), the PRC has a typology of different types of diplomatic partnerships. Of these, “strategic partnerships” are the most common, covering roughly 80 countries, including Indonesia.
[2] The Association of Southeast Asian Nations (ASEAN) is a regional intergovernmental organization of ten Southeast Asian countries: Brunei, Cambodia, Indonesia, Laos, Malaysia, Myanmar, the Philippines, Singapore, Thailand, and Vietnam.
[3] The AIIB is a Beijing-led multilateral development bank.
[4] One Indonesian expert interviewed for this research described a shift in attitudes regarding the perceived quality of Chinese technology over time. In the early 2000s, Indonesian partners questioned the quality of Chinese-financed coal power plants, as the output was always lower than the advertised capacity. However, the expert argued that this was no longer the case, as Chinese technology has improved greatly. Today, if the right Chinese brands are chosen, “some are as good as German technology,” he concluded.
[5] This rapid rise in Indonesia’s nickel production has coincided with a steep decline in its price by almost half since 2022, from US$30,000/ton down to US$15,640/ton at present (Treadgold, 2025). Moreover, despite the aspiration to focus more on EV battery manufacturing, this only accounts for 5 percent of Indonesia’s use of nickel, with roughly 70 percent still oriented towards stainless steel production (Lubis and Maqoma, 2024).
[6] During his first overseas visit to Beijing, Subianto agreed to elevate bilateral ties by including security cooperation as a fifth pillar of their relationship. At a business forum in January 2025, Subianto emphasized economic cooperation and peace through development (Secretariat Cabinet of Indonesia, 2025).
[7] China has been the top export destination for Indonesia’s exports nine years in a row and the leading source of imports for the past fifteen years (Indonesian Statistics Agency, 2025).
[8] This period also coincides with a significant shift in how development finance is channeled into the country. Beginning in 2007, the Indonesian government assumed direct responsibility for coordinating international assistance. From 1967 to 1991, most foreign aid to Indonesia was coordinated through the Intergovernmental Group on Indonesia led by the Netherlands. Between 1992 and 2007, aid coordination was the responsibility of the Consultative Group on Indonesia (CGI), co-led by the Government of Indonesia and the World Bank. Some observers argue that in the absence of the CGI, Indonesia has lacked a practical and independent assessment of its economy (The Jakarta Post, 2010).
[9] This figure excludes investments from Hong Kong, as well as those in the oil and gas, banking, non-banking financial institutions, insurance, leasing, and investment sectors licensed by technical or sectoral agencies. It also excludes portfolio and household investments. If Hong Kong was included, the total would increase to US$16.3 billion across 30,360 projects.
[10] If Hong Kong is included, the total investment will increase to US$83.5 billion across 67,332 projects from 2015 to 2024.
[11] Seven interviews were conducted with Indonesian experts drawn from think tanks, the government, civil society, and academia, many of whom hold roles across multiple domains. Interviewers used a semi-structured interview guide to ask interviewees to reflect on their familiarity with, and observations of, Chinese investments in Indonesia.
[12] The combined contributions of the four bilaterals was US$63.3 billion versus the PRC’s US$69.6 billion.
[13] For instance, Japan provided US$903 million in loans for the expansion of Jakarta’s Mass Rapid Transit (MRT) East–West line at a 0.3% fixed interest rate, with a 40-year repayment period and a 10-year grace period (Shofa, 2024).
[14] The name of the program was “Supporting Essential Health Actions and Transformation Program.”
[15] Projects with a score 4 or 5 on AidData’s “Loan Completeness Score.” For more detail, see the methodology for AidData’s Global Chinese Development Finance Dataset, Version 3.0.
[16] Originally proposed by Japan in 2014, Tokyo offered Jakarta a token 0.1 percent interest rate for its financing of the Jakarta–Bandung HSR project (Custer et al., 2023; Dreher et al., 2022). Beijing wanted to compete for the project, proposing a faster implementation time frame and more generous financing than usual, to compete with Japan’s offer. However, cost overruns eventually raised the project’s price by US$1.2 billion, with the additional financing carrying an even higher interest rate of 3.4 percent, negotiated down from an initial 4 percent (Reuters, 2017; Purba, 2023).
[17] The drop in Chinese financing to Indonesia in 2021 is striking, as it was the first year since 2010 where Beijing committed less than US$1 billion in new financing. Beijing only mobilized 17 projects, the majority of which were donations of medical supplies including personal protective equipment and Chinese-made vaccines—a strategy widely described as “mask diplomacy” or “vaccine diplomacy.” It provided Indonesia with US$853 million in project finance, while the ADB, the World Bank, Japan, and South Korea collectively mobilized US$6.2 billion in development finance across a variety of crucial sectors (transport and storage, general budget support, health, and government). It should be noted that this explicitly focuses on China’s state-directed financing and not private-sector FDI.
[18] Due to the recency of these announcements, full project details were not available in every case. It is unclear if each of China’s announced projects in Indonesia has progressed to a formalized commitment, or what the exact share is of project finance backed by Chinese official sources. Therefore, we recommend treating 2023 figures as preliminary.
[19] As PowerChina has withdrawn from its funding pledge for the Kayan Cascade project, this value is excluded from estimates of 2023 aggregated data.
[20] Although the Jakarta–Bandung high-speed railway project has been the most expensive of these investments, China more frequently makes smaller investments in the development of numerous toll roads, using joint ventures and special purpose vehicles to funnel money toward these projects. These projects provide their own form of collateral in the form of tolls, enabling the systematic reclamation of the funds used to build the road (Gelpern et. al., 2021). China is not alone in investing in Indonesian Toll Roads—Japan has also started investing in this area (Japan Overseas Infrastructure Investment Corporation for Transport and Urban Development, 2020).
[21] This could also be due to Indonesia’s capability to better respond to smaller-scale natural disasters, which was a goal set out in its Long-term National Development Plan of 2005-2025 (Government of Indonesia, 2007).
[22] As this project was financed via the AIIB, its value is not counted in this report’s totals of Chinese official development finance.
[23] List of AIIB projects in Indonesia can be found here: https://www.aiib.org/en/projects/list/year/All/member/Indonesia/sector/All/project_type/All/financing_type/All/status/Approved.
[24] Hong Kong FDI to Indonesia from 2021-2024 reached US$24.8 billion.
[25] For more details, please see Smith (2000); Sukma (2009); and Nabbs-Keller (2020).
[26]Joint Press Communiqué of the People's Republic of China and the Republic of Indonesia:
http://id.china-embassy.gov.cn/indo/zgyyn/zywx/200404/t20040422_2347233.htm
[27] Adjusted to 2024 constant dollars, these equal US$724.4 million in standby loans, US$362.2 million in export credit facilities, and a US$5.4 million grant for medicine.
[28] US$13.7 billion in constant 2024 dollars.
[29] For example, the state-owned China Eximbank and the Bank of China provided loans for power plant construction across three separate instances, totaling US$1.77 billion.
[30] US$970.4 million in 2024 constant dollars.
[31] In 2024 constant dollars, these equal to US$9.95 million in grants and US$663.5 million in soft loans.
[32] US$14.1 billion in 2024 constant dollars.
[33] This pledge was made during a Special ASEAN Leaders Meeting on the Aftermath of the Earthquake and Tsunami hosted by Indonesia. The Chinese Prime Minister said it was committed to reconstruction and long-term development of Aceh and that it would provide “unselfish assistance within our capacity and with no added conditions” (Sukma, 2009).
[34] The loan package announced during President Hu Jintao’s 2005 visit was a follow-up to US$400 million in soft loans extended by China during President Megawati’s state visit in March 2002.
[35] Equal to US$5.5 million in aid and US$458.6 million in loans in constant 2024 dollars.
[36] These priorities were enumerated in the administration’s Long-Term National Development Plan 2005–2025.
[37] Most, if not all, power plants built and commissioned during this period were coal-fired. The strong demand for coal prompted the government to introduce a Domestic Market Obligation, requiring coal producers to sell a portion of their output to the government at a regulated price. See Sambodo and Oyama (2010) and Ali and Wulandari (2008).
[38] Equal to US$5.3 billion in constant 2024 dollars.
[39] The program was launched through the issuance of Presidential Decree No. 71 of 2006: https://peraturan.bpk.go.id/Details/42005/perpres-no-71-tahun-2006.
[40] The program was part of a broader strategy to develop up to 22,000 MW of new capacity at a cost of Rp 200 trillion. Under the plan, 10 GW would be developed by PLN, 10 GW by private firms through the Independent Power Producer (IPP) scheme, and 2 GW through public-private partnerships (MEMR, 2006).
[41] Equal to US$1.08 billion in constant 2024 dollars.
[42] Equal to US$665.4 million in constant 2024 dollars.
[43] Equal to US$416.6 million in constant 2024 dollars.
[44] Denominated as US$700 million at the time of commitment.
[45] Denominated as US$117 million at the time of commitment. The full list of Fast Track Program Phase 2 (FTP-2) projects is detailed in the Regulation of the Minister of Energy and Mineral Resources of the Republic of Indonesia Number 40 of 2014, accessible here: https://peraturan.bpk.go.id/Details/143761/permen-esdm-no-40-tahun-2014.
[46] The project, totaling US$2.6 billion, was financed through a mix of 70 percent debt and 30 percent equity.
[47] A detailed list of the projects agreed during the forum can be found here: https://ekonomi.bisnis.com/read/20131003/9/166900/ini-21-perjanjian-kerja-sama-indonesia-china.
[48] Equal to US$37.3 billion in constant 2024 dollars.
[49] Equal to US$1.4 billion in constant 2024 dollars.
[50] For example, a US$721 million loan from China Development Bank to finance three Indramayu power plants was delayed for nearly a year, disbursed only in March 2009, despite the initial agreement being signed in May 2008 (Detik, 2008). It was later reported that the funding delay was due to an unrelated dispute between Indonesia’s Merpati Airlines and China’s Xi'an Aircraft Industrial Corporation over Merpati’s purchase of 15 MA60 aircrafts. (Detik, 2009; Sori, 2009). Once the dispute was resolved, following a visit to China by Indonesia’s then-Minister of Finance, Sri Mulyani, the funding for the power plant projects was once again unlocked and PLN was able to secure an additional US$1.06 billion in loans for three additional projects (Detik, 2009; The Jakarta Post, 2009).
[51] For instance, Acting Coordinating Minister for Economic Affairs and Finance Minister, Sri Mulyani, suggested that PLN renegotiate and explore the possibility of swapping the loans into Chinese yuan (The Jakarta Post, 2009), making use of the currency swap agreement that had been agreed upon earlier (Kompas, 2009). Under that agreement, China and Indonesia agreed to swap Rp 175 trillion for 100 billion yuan (approximately US$15 billion) to help lessen currency exposure.
[52] In 2017, the Audit Board of Indonesia (Badan Pemeriksa Keuangan) found that the project lacked adequate preparation and feasibility studies from the outset, concluding it was neither bankable nor viable for investment (Pratama, 2022). The project was developed by a consortium between PT Krakatau Engineering (a subsidiary of Krakatau Steel) and MCC CERI. Despite this, discussions around its reactivation have resurfaced in recent years (Anam, 2022).
[53] US$741 million at 2011 exchange rates, US$1.02 billion in constant 2024 USD.
[54] The full list of NawaCita agenda items can be found in the Joko Widodo–Jusuf Kalla Election Manifesto, available here: https://www.kpu.go.id/koleksigambar/Visi_Misi_JOKOWI-JK.pdf. The plan also emphasized the construction of new airports and the revitalization of traditional markets.
[55] The framework, according to the Coordinating Ministry of Maritime Affairs Republic of Indonesia (2019) required new projects to adhere to high environmental standards, transfer of technology, international best practices, utilization of Indonesian labor, and an integrated development approach.
[56] Widodo’s plan anticipated 109 projects, 35 to be developed by Perusahaan Listrik Negara (PLN), Indonesia’s state-owned utility, and 74 by the private sector, to increase the national electrification ratio from 88.3% to 97.4% (PLN, 2015).
[57] Loan Agreement Signed for Indonesia’s Jakarta–Bandung High-Speed Railway Project:
https://www.cdb.com.cn/English/xwzx_715/khdt/201708/t20170829_4510.html
[58] BRICS+ refers to the original five member group of Brazil, Russia, India, China, and South Africa, with the addition of new members Egypt, Ethiopia, Indonesia, Iran and the United Arab Emirates.
[59] 2023 projects are preliminary coverage only.
[60] Given the limitations of publicly available information, we were not able to find subnational location information for all projects. The tables and analysis in this section therefore represent the best available subset of projects for which subnational locations are available.
[61] As Indonesia prepares to move its political capital from Java to Kalimantan, Beijing’s PowerChina was slated to support the Kayan Hydroelectric project, before the project stalled and financing and implementation shifted to Japan (see Box 3 above).
[62] Sumatra has several cities with populations above one million, such as Medan, Palembang, Bandar Lampung, and Pekanbaru.
[63] The consortium included the Agricultural Bank of China (ABC), China Construction Bank Corporation (CCB), China Development Bank (CDB), the Export-Import Bank of China, and the Industrial and Commercial Bank of China (ICBC).
[64] Figures in this section may differ from those published by BPS-Statistics Indonesia. This is due to our use of the project-based fDi Markets data source, which may present a slight undercounting of total inbound investments. For more details on this source and rationale, please see the Technical Appendix.
[65] The trends described here reflect new inbound FDI annually, not the stock or total value of all previous and current FDI in a given year.
[66] New FDI from global sources to Indonesia dipped from US$34.1 billion to US$20.4 billion (a 40 percent decrease) from 2011 to 2012. Comparatively, Chinese companies exited Indonesia nearly entirely, slashing their pursuit of new projects by 98 percent, to just over US$116 million. Similarly, from 2018 to 2019, new FDI from Chinese companies dropped from US$6.1 billion to just over US$1 billion (an 83 percent decrease), despite total new projects remaining above US$17.2 billion.
[67] These outflows of Chinese capital in 2022 and 2023 came as China saw record-low levels in its own inward FDI, driven by uncertainty, geopolitical shifts, and reduced expectations of economic growth (IMF, 2024).
[68] That said, proximity to petrochemical resources and critical minerals did not appear to explain the subnational geography of inbound Chinese FDI in Indonesia.
[69] Ningbo Puqin Times—a subsidiary of CATL’s major holding, Guangdong Bangpu—signed an agreement with Indonesia’s PT Aneka Tambang and PT Industri Baterai Indonesia (IBI) to build a power battery industry chain project, including nickel mining and smelting, battery materials, battery manufacturing and battery recycling. However, there are no guarantees of continued investment.
[70] These include PT Bank China Construction Bank Indonesia Tbk (CCBI) [Indonesia]; the Chinese Consulate General [Indonesia]; the Chinese Embassy in Jakarta [Indonesia]; PT Bank ICBC Indonesia aff. Industrial and Commercial Bank of China [Indonesia]; BOC Aviation Ltd. [Singapore]; and The Industrial and Commercial Bank of China (Asia) Ltd. (ICBC) [Taiwan].
[71] As part of Hanban’s 2020 rebranding, Beijing moved oversight and funding of the Confucius Institutes into a separate non-profit, charitable organization—the Chinese International Education Foundation (CIEF). Observers largely viewed the decision as a defensive posture in response to international scrutiny and criticism of the PRC’s influence on Confucius Institutes (Sharma, 2022).
[72] For more details on AidData’s methodology and the complete Global Chinese Development Finance Dataset, Version 3.0, please refer to Custer et al., 2023 and Dreher et al., 2022.
[73] Includes ICBC Indonesia.
[74] Includes Bank of China (Jakarta Branch), Bank of China (Hong Kong) Limited (BOCHK) and BOC Singapore branch.
[75] Includes PT Bank CCB Indonesia.
[76] The CLEC was formerly known as Hanban
[77] Includes China CITIC Bank International Limited (formerly CITIC Ka Wah Bank).
[78] Parks et al. (2023) find that an estimated “50% of China’s non-emergency lending portfolio in low- and middle-income countries is now provided via these syndicated loan arrangements—and more than 80% of these arrangements involve Western commercial banks and multilateral institutions.”
[79] Includes Sumitomo Mitsui Banking Corporation Group (SMBC Group), Sumitomo Mitsui Banking Corporation (SMBC), Sumitomo Mitsui Indonesia and Sumitomo Mitsui Trust Bank Limited (SMTB).
[80] Includes PT Bank DBS Indonesia, DBS Bank Ltd., Bank DBS Indonesia and Development Bank of Singapore (DBS).
[81] Includes Bank of China (Hong Kong) Limited (BOCHK) and Bank of China (Jakarta Branch).
[82] Includes Standard Chartered Bank, Jakarta Branch, Standard Chartered Bank (Singapore) Limited and Standard Chartered Bank (Hong Kong) Limited.
[83] Includes ICBC Indonesia and ICBC Asia.
[84] Includes Bank BNP Paribas Indonesia and BNP Paribas Fortis S.A./N.V.
[85] Includes Bank Mandiri, Bank Mandiri Tbk, PT Bank Mandiri (Persero) Tbk Singapore Branch and PT Bank Mandiri (Persero) Tbk Hong Kong Branch.
[86] Includes PT CTBC Bank Indonesia.
[87] Includes Citibank International PLC, Citigroup Global Markets, Inc. and Citigroup.
[88] Includes PT Indonesia Eximbank.
[89] Includes ANZ Bank.
[90] Includes United Overseas Bank Indonesia (UOB Indonesia) and United Overseas Bank of Singapore.
[91] A result of China’s Belt and Road Initiative, which is a successor to the country’s 1999 “Going Global” (or “Going Out”) strategy, as China explicitly seeks to export its excess construction, steel, and cement production, advancing national interests by acquiring foreign markets for its surplus (Mathew and Custer, 2023).
[92] China Road and Bridge Corporation (CRBC), a SASAC subsidiary, was involved in the construction of the Tayan Bridge in West Kalimantan, an early infrastructure project that enhances connectivity in the region. CRBC entered the Indonesian market in 2004 to build Suramadu Bridge (completed 2009), before taking on the Tayan Bridge project (2012-2015).
[93] The U.S. Small Business Administration’s defines a JV as: “An association of individuals and/or concerns with interests in [...] consorting to engage in and carry out [...] limited-purpose business ventures for joint profit [...] for which purpose they combine their efforts, property, money, skill, or knowledge, but not on a continuing or permanent basis for conducting business generally” (SBA, 2018, p2).
[94] An SPV is defined as “a legal entity created by a firm (known as the sponsor or originator) by transferring assets to the SPV, to carry out some specific purpose or circumscribed activity, or a series of such transactions. SPVs have no purpose other than the transaction(s) for which they were created, and they can make no substantive decisions; the rules governing them are set down in advance and carefully circumscribe their activities. Indeed, no one works at an SPV and it has no physical location” (Gorton and Souleles, 2007, p1).
[95] NU CARE-LAZISNU is the philanthropic wing of Nahdlatul Ulama, the world’s largest Muslim organization (R20, n.d.), highly regarded and influential in Indonesia.
[96] The World Bank (n.d.) maintains a list of sanctioned firms and individuals in an effort to promote good governance and tackle corruption.
[97] ADB (n.d.) also maintains a similar list of entities that they deem have “engaged in integrity violations, including fraudulent, corrupt, coercive, collusive and obstructive practices.”
[98] The World Bank and ADB’s sanctions processes are neither absolute nor perfect. The respective databases only include entities that they have financed or that were cross-barred by another regional bank. The quality of the information is also inconsistent from year to year. However, this is one of the most unbiased indicators to evaluate corrupt business practices.
[99] Data as of March 2025, obtained from the World Bank and the Asian Development Bank’s online databases of recorded sanctioned and debarred firms.
[100] For more details, refer to Beijing’s Big Bet on the Philippines (Custer et al., June 2024).
[101] RSF’s 2025 World Press Freedom Index similarly found that increased links between media moguls and political principals in Indonesia have resulted in “control over critical media and manipulation of information through online trolls, paid influencers, and partisan outlets,” ultimately leading to higher self-censorship in the media (RSF, n.d.).
[102] The “Two Countries, Twin Park” development establishes paired SEZs in Indonesia and China that “seek synergy” (Antara, April 2025). This initiative allows the two countries to work closely on aligning logistics, as well as upstream and downstream supply chains. This mode of cooperation eases international trade obstacles, but certainly carries all the risks associated with JVs and SPVs outlined in Section 3.1, above.
[103] During interviews, a number of experts noted that the Chinese diaspora in Indonesia is diverse, including those who favor Taiwan over mainland China and are skeptical of pro-China messaging.
[104] Sinar Mas Group’s subsidiaries span multiple industries, from paper manufacturing and food processing to communications technology and real estate development. The conglomerate was named as a recipient across multiple Chinese-funded development projects.
[105] This does not mean, however, that an equal proportion of the projects themselves are located in the capital. Section 2.3 above details how Chinese funding is distributed subnationally in Indonesia, and Section 4.2 below lays out how these projects affect the local communities.
[106] Indonesia has 38 provinces, but only 28 appear to be the headquarters of recipients of Chinese development funding. The provinces that do not feature in the list of recipients are: Aceh, Bangka Belitung Islands, Central Papua, Highland Papua, Lampung, North Maluku, South Papua, Southeast Sulawesi, Southwest Papua, West Sulawesi.
[107] Most of these overtures were even further consolidated in just three provinces. East Java, Central Java, and West Java were home to four Confucius Institutes, one Luban Workshop, and 20 sister city partnerships.
[108] Smartel and Smartfren recently merged with XL Axiata, becoming XL Smart (XL Axiata, 2024).
[109] AidData’s Global Chinese Development Finance Dataset, Version 3.0, captures 20,985 projects across 165 low- and middle-income countries (including Indonesia) supported by loans and grants from official sector institutions in China worth $1.34 trillion. It tracks projects over 22 commitment years (2000-2021). See: https://www.aiddata.org/data/aiddatas-global-chinese-development-finance-dataset-version-3-0
[110] Given limited publicly available information, AidData was not able to capture complete data on the status and timing of all projects. For Indonesia, 381 PRC-financed development projects are missing complete timing data, and several provinces—like Maluku and West Sumatra—lack information for one or more stages.
[111] This outlier may reflect data limitations: Central Papua was only established as a separate province in July 2022, so earlier projects may be recorded under the former province of Papua and underrepresent the actual delivery time.
[112] The subnational approach, as compared to a national-level analysis, offers more granular data and closer alignment with what respondents might actually observe. However, not all DF and FDI projects could be geolocated, due to the nature of the project or limitations in the source data. As a result, our subnational analysis does not include all PRC-financed projects. However, given Indonesia’s geographic diversity and administrative decentralization, the benefits of the subnational approach outweigh its drawbacks.
[113] In our statistical model, we use year- and province-fixed effects, as well as lagging our financial predictors by one, three, and five years to examine how past exposure influences current outcomes. This approach reflects a basic causal ordering and helps mitigate simultaneity bias. We acknowledge that implementation effects may unfold over different time horizons. Due to the extreme right-skew of these four predictors, we applied a natural log transformation to ease interpretation and better satisfy the assumptions of linearity and homoscedasticity.
[114] Other effects are mixed or change direction over time, meaning that there was no clear or consistent directional relationship that held across the 1-year, 3-year, and 5-year lagged data.
[115] The marginal effects—the estimated change in the likelihood of approval for a one-unit increase in project exposure—for DF projects were consistently negative but small: -0.25%, -2.24%, and -0.88% for one-, three-, and five-year lags, respectively. FDI project counts also produced negative marginal effects: -0.36%, -1.57%, and -0.84% for one-, three-, and five-year lags, respectively. More information about the methods used for this analysis are available in the Technical Appendix.
[116] The Asian Barometer finds that the share of Indonesians saying China has a “good influence” in Indonesia declined from 64.76 percent in 2011 to 36.93 percent in 2021. The Asian Barometer provides fewer survey waves than Gallup (only 2011, 2016, 2019, and 2021).
[117] Respondents who reported receiving advice or assistance from the PRC assessed Beijing’s engagement along three dimensions: its influence over policy priorities in their country; the degree to which its influence was positive or negative; and its helpfulness in the design and implementation of policy reforms.
[118] Models were tested using one-, three-, and five-year lag specifications. Please refer to the Technical Appendix for results across all lags.
[119] Interviewees also highlighted local frustrations over the lack of a clear mechanism for reporting environmental impacts tied to Chinese investments.
[120] IMIP was a joint venture launched in 2013 in Central Sulawesi by PT Bintang Delapan and China’s Tsingshan Holding Group. IMIP has become a major hub for processing the nickel used in stainless steel and electric vehicle batteries.
[121] Nearly 80,000 hectares of forest were cleared across Sulawesi by 2023—with over 6,100 cleared that year alone—largely due to nickel operations in Morowali and surrounding areas (Brown and Harris, 2024, p. 31).
[122] Presidential regulations were revised without adequate consultation, state auditors flagged financial irregularities and cost overruns, and concerns over corruption were amplified by the involvement of China Development Bank, whose former vice director was arrested on bribery charges (Nicola et al., 2023).