Table of contents
2. Where has Beijing directed its overseas financing for ports and equipment?
2.1 Chinese-financed ports in high-income countries
2.1.1 Regional focus: Oceania and Australia
2.1.2 Regional focus: The Middle East
3. Chinese-financed port equipment: Linking hardware and software
3.1 What accounts for China’s increased financing of ports equipment?
3.2 Which Chinese entities provide port equipment?
3.3 Why port equipment should be evaluated alongside general port financing
4. China’s shifting maritime strategy: From overt basing to hubs of connectivity
4.1 A change in China’s strategy: Keeping a lower profile?
4.2 Hubs of connectivity: Integrating the port-railway-mine model
4.2.1 Co-locating seaports with Chinese-financed critical mineral operations
4.3 A case study for China’s new approach: Linking Brazil and Peru
Case study: Port of Morébaya, Guinea
5. Implications of Chinese naval developments
6. China’s naval activity at global seaports
6.1 Chinese overseas basing and military installations
6.2 Quantifying Chinese naval activity at Chinese-financed seaports overseas
6.3 Tracking Chinese hospital ship diplomacy
Case study: China’s Arctic interests
7. Implications for U.S. maritime and economic statecraft
7.3 Ports in the United States: A case study of the Hampton Roads region
8. Conclusion and recommendations
8.1 The U.S. and its allies must develop a long-term strategy
Overseas ports projects under development or in China’s financing pipeline
8.2 Port construction is just one piece of the puzzle, requiring holistic thinking
8.3 Countries that host ports must be empowered to better screen investments
8.4 Establish a taskforce or research center on China’s overseas seaports
Figures
Figure 1a. Port of Tema in 2016, before new development5
Figure 1b. Port of Tema in Ghana in 2024, prior to opening in 20255
Figure 2. China’s official sector lending and grant-giving for overseas ports, 2000-20259
Figure 3. Breakdown of Chinese-financed seaport projects by Chinese entity involvement12
Table 3. Chinese ports financing by top funding agencies and recipient countries, 2000-202514
Figure 4b. Lekki Deep Sea Port in 2024, after opening in 202317
Figure 5a. Khalifa Port in 2016, prior to Chinese-financed development26
Figure 5b. Khalifa Port in 2021, after Terminal 2’s opening in 201926
Figure 6. Chinese official financing for overseas port equipment, 2000-202530
Figure 7. Chinese official financing for port equipment by type, 2000-202532
Figure 8. Composition of Chinese port equipment providers by implementing agency, 2000-202333
Figure 10. Colocation of Chinese-financed seaport and mining projects, 2000-202342
Figure 11a. Site of the future Chancay Port in 2018, prior to development45
Figure 11b. Chancay Port in 2025, after opening in late 202445
Figure 12. The Brazil-Peru Bioceanic Corridor and Porto Sul construction plans46
Figure 13. Chinese-financed ports with Chinese naval activity pre- or post-financing, 2000-202558
Figure 14. Chinese financing by type for ports with Chinese naval activity pre- or post-financing60
Figure 18. A proposed “Port Shopper Tool” to navigate port financing and deals96
Tables
Table 1. Top 20 Chinese-financed ports, 2000-202510
Table 2. Financing for ports and port facilities with both Chinese owners and operators, 2000-202513
Table 3. Chinese ports financing by top funding agencies and recipient countries, 2000-202514
Table 4. Top 10 Chinese-financed ports during the late BRI, 2018-202516
Table 5. Top 20 Chinese-financed ports in high-income countries, 2000-202519
Table 6. Examples of five areas of security sought out by Chinese companies and agencies40
Table 7. Examples of co-located Chinese-financed seaports and mines43
Anchoring Global Ambitions
Beijing’s Ports Financing and the Race for Maritime Dominance
By Alexander Wooley, Lea Thome, Sheng Zhang, Rory Fedorochko, Sarina Patterson, and Seth Goodman
Acknowledgments
This report was prepared by Alexander Wooley, Lea Thome, Sheng Zhang, Rory Fedorochko, Sarina Patterson, and Seth Goodman. Our analysis draws upon a newly assembled dataset—the Chinese-financed Ports Overseas and Related Terminals Dataset, Version 2.0 (CPORTS 2.0)—released by AidData in conjunction with this report.
We owe a major debt of gratitude to AidData’s Tracking Underreported Financial Flows (TUFF) Unit and the international network of researchers—including Bradley C. Parks, Brooke Escobar, Katherine Walsh, Sheng Zhang, Rory Fedorochko, Lydia Vlasto, Julie Sickell, Sailor Miao, Emma Bury, Jacqueline Zimmerman, Samantha Custer, Axel Dreher, Lukas Franz, Andreas Fuchs, Sebastian Horn, Ammar A. Malik, Carmen M. Reinhart, Austin Strange, Michael J. Tierney, and Christoph Trebesch—who developed the latest version of the TUFF methodology and AidData’s China’s Global Loans and Grants Dataset, Version 1.0 (CLG-Global 1.0). We are also grateful to the authors—Bradley C. Parks, Sheng Zhang, Brooke Escobar, Katherine Walsh, Rory Fedorochko, Lydia Vlasto, Jacqueline Zimmerman, Julie Sickell, Emma Bury, Ameya Joshi, Lea Thome, Oshin Pandey, and Pavan Raghavendra Raja Manuri Venkata—of a related report, Chasing China: Learning to Play by Beijing's Global Lending Rules, which informed our analysis. Our work was supported as well by research assistant Ian Harman, who developed variable definitions, manually coded variables, formatted references, and conducted a qualitative literature review; we are grateful for his contributions.
A large team of AidData research assistants also provided invaluable support, including Abena Konadu, Akash Nayak, Aldrin Yashko, Alejandro Schnapp Mezerhane, Alexis Dolack, Allison Swindell, Amelia Smith, Amruta Veer, Amy Browning, Andy Shufer, Anna Garrett, Anna Wood, Anne Paxton, Araella Bruerd, Arianna LaGamma, Audra Killian, Bailey Nicholson, Bemnet Legesse, Benjamin Fu, Benjamin Greenberg, Beyoncé Lightfoot, Caitlyn Phung, Cameron (Bailey) Garber, Carina Rosenberg, Caroline Elszy, Carter Danto, Chelsea Wright, Chenglin Gong, Christina Wu, Claire Rudinsky, Claire Wyszynski, Clara McAllister, Colin Mullee, Collin Absher, Conrad Bruton, Cy Strain-Seymour, David Zhu, Davide Zoppolato, Dazhong Cui, Dingyi He, Dory Gilmer, Eesha Kulkarni, Emily Tchorz, Emma O'Horo, Emma Williams, Eric Montesi, Ethan Robertson, Gabriella Flores, George Beck, George (Teddy) Chunias, Grace Dorion, Grace McGehee, Grace Rosenberg, Gujie Shen, Gwyneth Smith, Hana Keenan, Haoyu (Kevin) Leng, Hari Hara Nagarjuna Raavi, Harrison Abramsohn, Helen Tieder, Henry Freytag, Henry Hubbard, Henry Tieder, Ian Harman, Ian Kung, Ihsan Amin, Isaac Herzog, Jaclyn Velotas, Jackson Humphreys, Jennifer Twark, Jiexi Lin, John Keating, Josep Ocampo, Julia Beverley, Julia Swearer, Justin Ober, Kaito Elston, Katelyn Oxer, Kelly Shinners, Kyurhee Kim, Lauren Creed, Lebron Parsell, Liang Geng, Lillian Butler, Maggie Blake, Man-Hsuan (Annie) Lin, Marianna Bonilla, Max Berckmueller, Meveryn Chua, Michael Olyniec, Prabhdeep Singh, Prestin Tran, Radhika Rohit, Rebeca Uranga, Redmond Scales, Regina Chaillo, Riley Companion, Ronan Gormley, Sabrina Levri, Samantha Rofman, Samuel Li, Saoirse O'Hair, Sarah Kennedy, Saranga Bansal, Sean Nguyen, Sebastian Meier, Shannon McGuire, Shiying Cai, Spencer Krivo, Stephen Moreau, Summer King, Supriya Navnith, Taylor Perry, Victor Gedeck, Vikhyat Kethamukkala, Violet Shi, Westley Jacanin, William Olichney, Xingyun (Ella) Pan, Ye Xiao, Yusuf Gunter-Rahman, Yuxi (Felix) Tian, Yuxuan (Flora) Wu, Zachary McClure, Zhuangqi (Steven) Zheng, and Zupeng Zeng.
Additionally, we thank the experts who kindly shared their time and insights at various stages throughout this project, including the following peer reviewers: Bradley C. Parks, AidData’s Executive Director; Brooke Escobar, AidData’s Director of the Tracking Underrepresented Financial Flows (TUFF) Unit; the executive of a global shipping company; the recently retired CEO of a major port in Asia; Michael Fabey, author and naval journalist for Janes; Jhih-Siang Liu, Assistant Professor, National Defense University, Taiwan; and Wendy Leutert, Associate Professor, Indiana University. We are also grateful to Wood Mackenzie Vesseltracker for generously providing maritime traffic data that informed this analysis. We also extend our gratitude to John Custer, who formatted the dataset and created data visualizations and the forthcoming HTML version of this report. Sarina Patterson edited and formatted the report and designed the cover; the cover image is by rjankovsky via Adobe Stock, used under the Standard license.
We gratefully acknowledge financial support from the William and Flora Hewlett Foundation and the Smith Richardson Foundation. The findings, interpretations, and conclusions expressed in this study are entirely those of the authors, and they do not necessarily represent the views of the William and Flora Hewlett Foundation or the Smith Richardson Foundation. AidData’s research is guided by the principles of independence, integrity, transparency, and rigor. A diverse group of funders supports AidData’s work, but they do not determine its research findings or recommendations.
Citation
Report
Wooley, A., Thome, L., Zhang, S., Fedorochko, R., S. Patterson and Goodman, S. 2026. Anchoring Global Ambitions: Beijing’s Ports Financing and the Race for Global Maritime Dominance. Williamsburg, VA: AidData at William & Mary.
Dataset
Thome, L., Fedorochko, R., and Zhang, S. 2026. Chinese-Financed Ports Overseas and Related Terminals (CPORTS) Dataset, Version 2.0, 2000-2025. Retrieved from: www.aiddata.org/data/chinas-official-seaport-finance-dataset-2000-2023.
Author Contribution Statement
A.W., L.T.,S.Z., R.F., and S.P. conceptualized and planned this report, beginning in 2024. S.Z., R.F., and L.T. collected the data used in the analysis. L.T., S.Z., and R.F. led the analysis of the data. S.G. provided and analyzed the geospatial imagery. S.P. and A.W. edited this report. All authors contributed to the preparation of the manuscript.
About the authors

Alexander Wooley is Director of Partnerships and Communications at AidData. He was the lead author of the Harboring Global Ambitions report that examined China’s global ports footprint and the implications for future naval bases. He has written on maritime affairs for Foreign Policy, Foreign Affairs and the U.S. Naval Institute’s Proceedings. Alex is a former section editor of the Georgetown Journal of International Affairs and a former officer in the British Royal Navy. He holds an MA in Security Studies from Georgetown University.

Lea Thome is a Program Manager at AidData, where she focuses on short-form analysis and China’s financing for national security and military purposes. She holds a bachelor’s degree in Political Science and International Relations from the University of Rochester and a master’s degree in Global Affairs from Schwarzman College at Tsinghua University. Before joining AidData, she was the Schwarzman Fellow at the Wilson Center’s Kissinger Institute on China and the U.S. and a Visiting Fellow at the Institute for National Defense and Security Research.

Sheng Zhang is a Senior Research Analyst for the Chinese Development Finance Program at AidData, where he focuses on development finance, infrastructure investment, critical minerals, and Environmental, Social, and Governance (ESG) research. His expertise guides the program’s research analysis, contributing significantly to understanding and improving sustainable development and investment practices worldwide.

Rory Fedorochko is a Program Manager with AidData’s Chinese Development Finance Program team, where he oversees the assembly of its dataset on Chinese loans and grants to high-income countries and assists on its analysis and provides a wide variety of support to other research activities of the team, including on its flagship reports and research on critical minerals and renewable energy. He previously contributed to AidData’s report on China’s ports financing, Harboring Global Ambitions.

Sarina Patterson is AidData’s Communications Manager and a co-author of Harboring Global Ambitions, a report that examined China’s global ports footprint and the implications for future naval bases. She designs and creates content for AidData’s web and social media presence, including interactive data visualizations, maps, and dashboards. She holds a BA in Government with a secondary in East Asian Studies from Harvard University.

Dr. Seth Goodman is a Research Scientist within AidData’s Research & Evaluation Unit, where he specializes in the design and operationalization of research and analysis utilizing geospatial data, machine learning, and distributed computing. Seth developed GeoQuery, AidData’s free spatial data platform, and his recent work includes exploring the use of ML-based outcome measures derived from satellite imagery, as well as assessing the efficacy of deforestation detection solutions being used to comply with the EU’s Deforestation Regulations.
Executive summary
Between 2000 and 2025, China committed nearly $24 billion in seaport-related financing supporting 168 ports across 90 low-, middle-, and high-income countries, reaching nearly every corner of the world with its official sector financing. The Anchoring Global Ambitions report and a new dataset—the Chinese-Financed Ports Overseas and Related Terminals Dataset, Version 2.0 (CPORTS 2.0)—build upon a previous investigation into Beijing’s provision of aid and credit for seaports in low- and middle-income countries (Wooley et al 2023).
Key findings include:
- Top-financed ports: Chinese state-owned creditors and donors have bankrolled over 363 seaport-related projects and activities at 168 ports around the globe. The most heavily-financed ports include Hambantota International Port ($1.97 billion), the Port of Newcastle ($1.32 billion), the Autonomous Port of Kribi ($1.17 billion), the Port of Melbourne ($1.14 billion), and Haifa Port ($1.13) billion. 2024 and 2025 alone saw $614 million of new official sector financing commitments from China for new projects and activities across eleven global ports.
- High-income countries: Chinese financing for global seaports is almost evenly split between high-income countries and low- and middle-income countries. 45.1% of its entire overseas seaport finance portfolio (worth $10.8 billion) supports 29 port locations across 20 high-income countries including Spain, Australia, New Zealand, Singapore, and Brunei.
- Combining hardware with software: In addition to extending aid and credit for the construction, expansion, and modernization of seaport facilities, Chinese state-owned financiers often support the provision of port equipment monetarily, such as security scanners or cranes provided by companies like Nuctech or ZPMC. This analysis identifies $4.7 billion in financial commitments for seaport projects that include such equipment.
- Port-railway-mine corridors: Chinese state-owned creditors and donors increasingly co-locate their port investments with other investments vital for China’s national security, such as critical mineral operations. This report identifies 19 Chinese-financed mines within a 500-kilometer radius of Chinese-financed seaports and focuses on two key case studies: the Port of Chancay and the Port of Morébaya.
- Dual-use activity: Chinese naval activity (including port calls, hospital ship visits, and joint exercises) has taken place in more than 50% of Chinese-financed port facilities where there is also a Chinese owner. There is substantially less Chinese naval activity in Chinese-financed port facilities that are not owned or operated by Chinese entities.
- New port projects in the pipeline: In addition to tracking confirmed commitments, this study identifies another $11.6 billion of pledged financing for potential or future projects at 30 ports, including Mongla Port in Bangladesh and Kisumu Port in Kenya. Also uncovered are seven new proposed port projects that fall outside the scope of this dataset but should be monitored, including Lobito Port in Angola, Sandino Port in Nicaragua, and Mubarak Al-Kabeer Port in Kuwait.
- Consequences for the U.S. and other countries: China’s nearly ubiquitous presence in the world’s top ports means that the U.S. cannot insulate itself from Chinese supply chains, in either peacetime or conflict. It must be selective about where it chooses to compete and on what dimensions. The U.S. has the opportunity to prioritize and encourage maritime prosperity zones, as set forward in the new U.S. Maritime Action Plan, including in the Hampton Roads area.
Based on newly collected data, this study makes the following policy recommendations for the host countries of port investments, policymakers, officials, and scholars:
- Policy: Encourage the U.S. and its allies to develop a long-term overseas port financing strategy.
- Plan: Incentivize holistic planning and integration of port planning with other critical aspects of the maritime domain, including operations, supply lines, shipping and shipbuilding.
- Partner: Work with host governments and beneficiaries to develop domestic policy assessment tools for incoming offers of port investments and port management.
- Platform: Establish a taskforce to produce high-quality impactful research, assessments, and recommendations.
1. Introduction
By Alexander Wooley
For over a dozen years, AidData, a research lab at William & Mary, has conducted data collection and research on China’s provision of aid and credit for overseas projects and activities. Initially this effort focused on Chinese loans and grants to Africa; it later expanded to the entire developing world. By the end of 2025, AidData was tracking Chinese official sector financing for projects and activities across 217 countries and territories in the developed and developing world—in nearly every jurisdiction other than China itself. This enormous, year-round effort is led by a team of 16 William & Mary faculty and staff and more than 120 research assistants working in twelve languages. The resulting data and analysis are made publicly available for free and for anyone to use.[1]
AidData’s latest report on China’s overseas financing portfolio, Chasing China: Learning to Play by Beijing's Global Lending Rules, was over three years in the making (Parks et al. 2025a). The accompanying dataset, China’s Global Loans and Grants Dataset, Version 1.0 (CLG-Global 1.0), is the most comprehensive and granular of its kind. It tracks more than 33,580 projects and activities across 217 countries supported by $2.2 trillion in grants and loans from more than 1,100 official sector institutions (e.g., government agencies, state-owned banks, and state-owned enterprises) in China over a 24-year period from 2000 to 2023 (Parks et al. 2025b; Dreher at el. 2022).[2]
The authors of this report, Anchoring Global Ambitions: Beijing’s Ports Financing and the Race for Maritime Dominance, are a group of AidData researchers with a special interest in maritime affairs. This study draws from and expands upon AidData’s CLG-Global 1.0 dataset to explore a topic critical to global trade and security: China’s official sector financing for overseas port projects.
For this analysis, the authors assembled a new custom dataset and conducted supplementary coding, verification, and quality assurance of data on grant- and loan-financed port projects and activities around the globe. This data collection effort was supplemented by satellite imagery for targeted geospatial analysis and deep dives into specific case studies.
The following study builds upon a previous version of port financing dataset and an earlier 2023 report, Harboring Global Ambitions: China's Ports Footprint and Implications for Future Overseas Naval Bases, that has been cited by Congressional Research Service reports (O’Rourke 2025) and described as “foundational” research on China’s global ports financing by think tanks (Sadler 2025c). In 2026, an updated version of Harboring Global Ambitions will be included as a chapter in a peer-reviewed book published by Harvard University Press.
The new Anchoring Global Ambitions report and its associated dataset—the Chinese-Financed Ports Overseas and Related Terminals Dataset, Version 2.0 (CPORTS 2.0)—go beyond earlier work to provide:
- Temporal coverage of official Chinese grant- and loan-financed seaport projects and activities from 2000 through 2025, making it the most comprehensive, publicly available dataset to provide a near-real-time picture of China’s global ports footprint;
- Global coverage of 217 countries, including both high-income and developing countries; and
- The inclusion of port equipment projects and activities, including those involving the acquisition and installation of shoreside cranes and scanners.
The CPORTS 2.0 dataset is the largest of its kind on China’s official lending and grant-giving for overseas port construction, expansion, and related infrastructure activities—with more than double the number of records in the 1.0 dataset. CPORTS 2.0 contains 129 variables for each record, providing granular information on precise project locations; financial commitment amounts and currencies of denomination; financing, co-financing, implementing, and receiving agencies; project status determinations; countries of activity (where the financed projects or activities take place); countries of incorporation (where the direct receiving agencies of the financial or in-kind transfers are legally incorporated); planned and actual commitment, implementation, and completion dates; borrowing terms (including information on the maturities, interest rates, grace periods, grant elements, and sources of collateral); and detailed narrative descriptions. Additionally, the CPORTS 2.0 dataset contains 29 unique variables not found in the AidData CLG-Global 1.0 dataset—including information on the specific type and purpose of financing for ports and equipment; prior Chinese naval activity at ports (including port calls, hospital ship visits, and joint exercises); and the presence of Chinese state-financed mines near ports.
In total, this analysis finds 363 Chinese loan- and grant-financed projects worth $23.9 billion (in 2025 U.S. dollars) supporting 168 unique ports across 90 countries from 2000 to 2025.[3] 159 projects supported by commitments worth $10.8 billion are located in high-income countries (HICs), while 204 projects supported by commitments worth $13.1 billion are located in low- and middle-income countries (LMICs).
Importantly, the CPORTS 2.0 dataset provides a precise timeline for each port project, including dates for the pledge, commitment, commencement, and completion of each project over a 26-year period (2000-2025). Thus, while much of this report examines China’s financial commitments for port projects, the dataset can also be used to track subsequent implementation activities and milestones. The satellite imagery used in this report captures ports both prior to the receipt of a financial commitment from China and post-implementation, enabling before-and-after analysis. Since the CPORTS 2.0 dataset includes information on port financing commitments through the end of 2025 (and thus beyond the 2000-2023 period of coverage found in AidData’s CLG-Global 1.0 dataset), it also tracks commitments that have only recently been made or announced and projects where construction is still new or in progress.
This report and the CPORTS 2.0 dataset therefore present the clearest picture yet of the geographic distribution and strategic intent behind China’s global maritime footprint. Previous studies by economists, political scientists, and lawyers from AidData, the Center for Global Development, the Kiel Institute for the World Economy, and the Peterson Institute for International Economics have found little empirical evidence for the “debt trap diplomacy” narrative, which has quickly become an article of faith in Western capitals(Parks et al. 2022; Gelpern et al. 2023, 2025a, forthcoming). Our findings strengthen the argument that Beijing does not seek sovereign control of physical assets in overseas jurisdictions as much as it seeks strategic security, built upon key points of access connected through channels of trade, communication, capital and influence. To date, there is little evidence that China is prioritizing the overt militarization of ports with the intent of converting or using existing ports as major naval bases, though this possibility cannot be ruled out. Instead, China is investing in ports that can receive its vast exports and facilitate the movement of essential commodities, such as critical minerals, liquid natural gas, oil, soybeans and other food products, and more. These ports are designed to promote Chinese commercial interests overseas and maximize profits for its lenders.
However, this focus on economic and commercial pursuits is happening at the same time as China’s navy, the People’s Liberation Army Navy (PLAN), is undergoing significant growth and technological development, as described in Chapter 5 of this report. China’s global maritime supply chains, anchored by its overseas port network, provide a major geopolitical benefit: a parallel logistic network that offers Beijing strategic independence, free from interference from Western institutions, and permits it to contemplate a military counter to possible island chain containment strategies or constricting blockades attempted by an enemy in any future conflict.
Interspersed throughout this study are satellite images showing the construction and expansion of Chinese-financed overseas ports, such as the Port of Tema in Figures 1a and 1b below. What is striking is not only the sheer size of new port construction, but also the development of associated infrastructure shore—including vast swathes of built-up industrial and transportation infrastructure and residential areas. In many cases, major ports have arisen along coastlines off the beaten path where there was little infrastructure previously, re-fashioning the landscape and reshaping trade patterns.
Figure 1a. Port of Tema in 2016, before new development
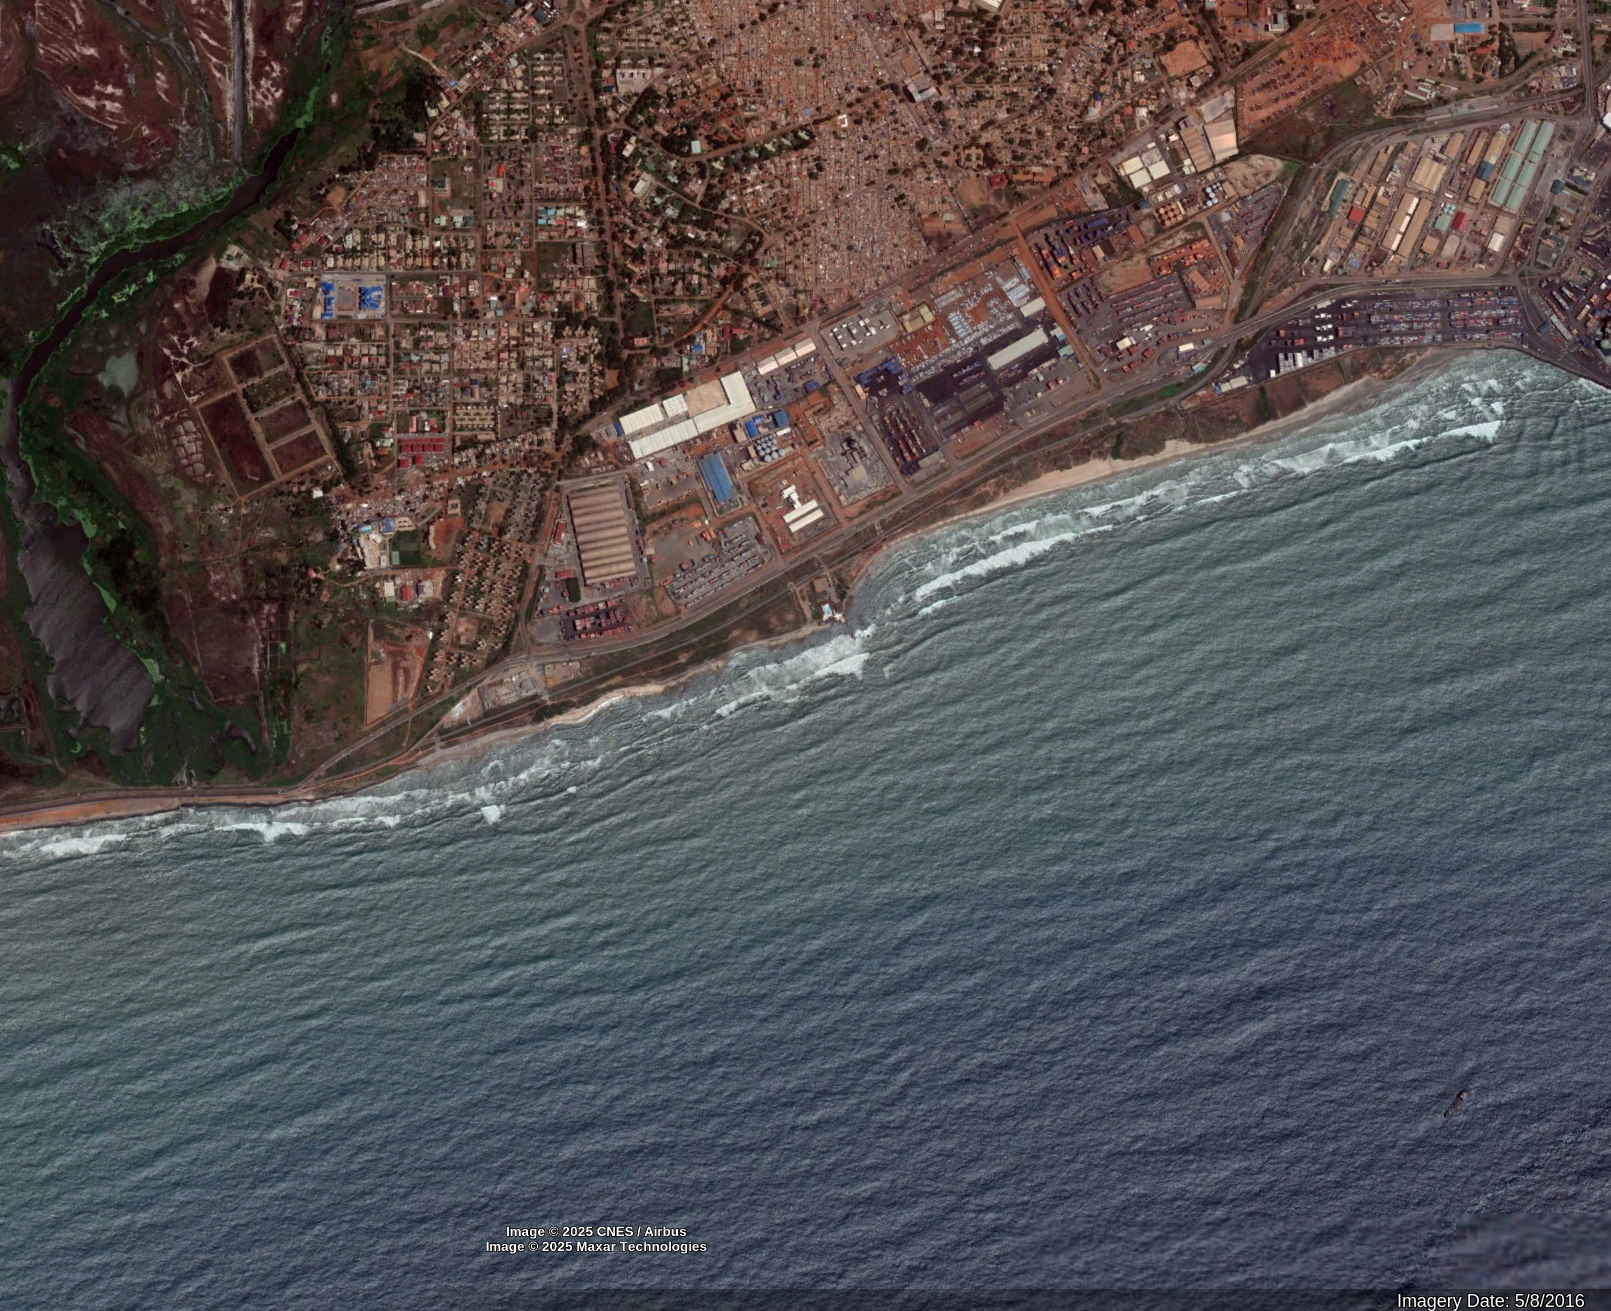
Figure 1b. Port of Tema in Ghana in 2024, prior to opening in 2025
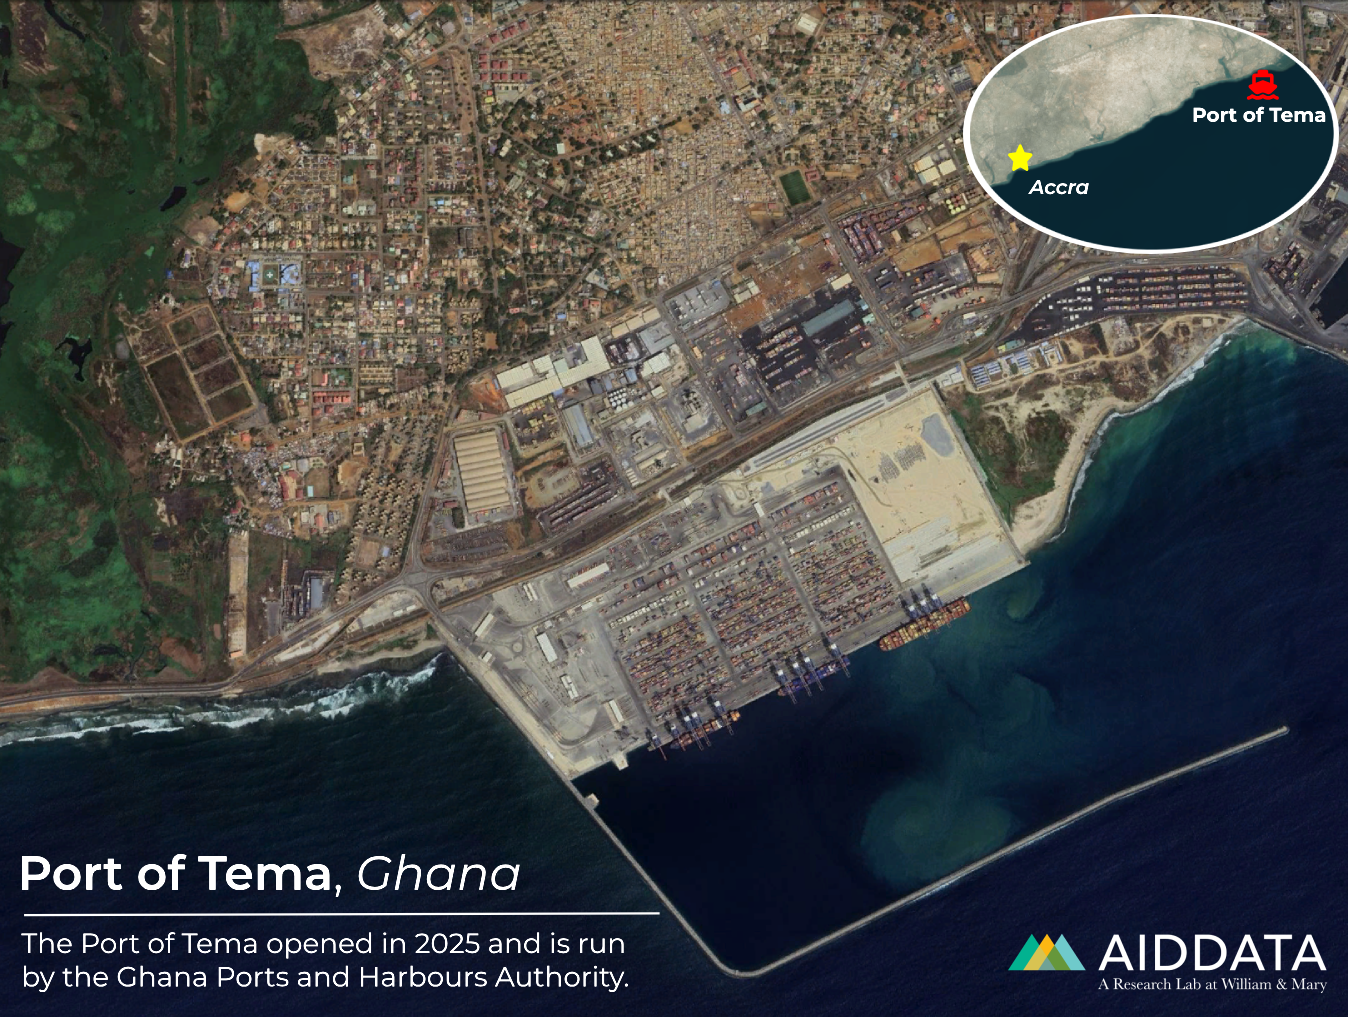
Sources: Imagery in Figures 1a and 1b by Airbus (2025) and Google Earth.
A broader lesson of this study is that for most of the world’s powers (and especially for China, the United States, and the EU), economic statecraft, domestic industrial policy, and national security are now more closely intertwined than perhaps since World War II. Here, again, China has an advantage—with a long history of supporting state-sponsored or subsidized shipbuilding and shipping, as well as related infrastructure. Commercial shipping companies, meanwhile, typically prefer to follow the money and avoid choosing sides in great power competition. Yet in this changing environment, they may be increasingly forced into alignment with a given power’s national interests.
Beyond just the commercial value of these investments, many ports captured by the CPORTS 2.0 dataset lie on critical sea lines of communication (SLOCs)—ones which Beijing could determine are worth defending in times of conflict, crisis, or contingency. A port is only a starting or end-point for maritime traffic, and this study therefore also touches on the growing overland infrastructure that brings critical commodities to Chinese-funded overseas ports for onward shipment to the Chinese mainland. While Chinese port construction and expansion is re-shaping and re-defining trade routes, other forces will drive maritime trade routes and traffic over the coming decade. These include tit-for-tat tariffs; export controls on critical minerals, the vast bulk of which travel by ship; increased and targeted port fees; the opening up of polar shipping lanes; and the possibility of conflict at maritime chokepoints (such as the recent Houthi attacks on the Suez Canal or disruptions in the Strait of Hormuz) that shut down or severely reduce traffic for an extended period.
This report’s publication comes at a time when Beijing’s overseas ports financing and its other maritime activities are top of mind for policymakers, particularly in the United States. In addition to likely being the world’s top financier, builder, and operator of overseas ports, China is the world’s largest shipbuilder, constructing more than half of all ships (Funaiole et al. 2025). According to CSIS, China’s largest state-owned shipbuilder “built more commercial vessels by tonnage in 2024 than the entire U.S. shipbuilding industry has built since the end of World War II” (Funaiole et al. 2025). In 2025 alone, Chinese yards received orders for 526 new container ships, 371 bulkers, and 276 tankers, with Chinese shipping conglomerate COSCO and its subsidiaries leading the way in terms of orders (Galanopoulos 2026). Both the Trump and Biden Administrations have viewed China’s expanding maritime footprint as a growing strategic and economic challenge, prompting a series of investigations, legislative measures, and policy efforts aimed at understanding the risks and strengthening U.S. alternatives. The 2026 National Defense Authorization Act (NDAA), which became law in December 2025, called for the U.S. Departments of State and Defense to gather information on China’s control over global strategic ports; the U.S. national security and economic implications of Chinese-controlled strategic ports; and measures the U.S. government could take to ensure open access and provide alternatives to Chinese investment in these ports (U.S. Congress 2025–2026). Earlier, in 2024, the U.S. Trade Representative launched an investigation of China’s acts, policies, and practices targeting the maritime, logistics, and shipbuilding sectors for dominance. A subsequent report released in 2025 stated that China’s targeting of the maritime, logistics, and shipbuilding sectors for dominance was “unreasonable and burdens or restricts U.S. commerce and thus is actionable.”
Using data and evidence, Anchoring Global Ambitions sheds light on the true scale and scope of China’s state-directed investments in ports and harbors worldwide. It drills down into the specifics of Beijing’s overseas ports financing and explores the implications for China, the U.S. and its allies, and the countries that receive this financing. It also highlights some of the policy options that powers large and small have before them, as they contemplate the changing global maritime order.
For various reasons, accessing information on China’s overseas lending and grant-giving activities is becoming more difficult, and Beijing increasingly uses opaque and complex borrowing arrangements and financial instruments (Gelpern et al. 2023, 2025a, 2025b; Parks et al. 2025a). Despite these challenges, AidData will continue to track Chinese financing for ports infrastructure worldwide and conduct rigorous policy analysis and peer-reviewed research on its impacts, disseminating this information widely.[4]
2. Where has Beijing directed its overseas financing for ports and equipment?
By Rory Fedorochko, Sheng Zhang, and Seth Goodman
This report and the associated CPORTS 2.0 dataset present the clearest picture yet of the universe of seaport infrastructure and equipment projects financed via loans and grants from Chinese state-owned entities between 2000 and 2025. This analysis excludes ports that are solely funded via equity investments through privately-owned or state-owned Chinese entities—though the bundling of aid, debt, and equity can be an important factor in understanding a given project’s development and intentions.
This chapter begins with a brief overview of the underlying data collection and coding methods.[5] Over a three-year period, the authors used a combination of automated and manual screening techniques to assemble the CPORTS 2.0 dataset. First, a systematic review was conducted of AidData’s CLG-Global 1.0 dataset, which captures 33,580 projects and activities across 217 countries supported by grants and loans from more than 1,100 official sector institutions in China worth nearly $2.2 trillion (in 2023 U.S. dollars) from 2000 to 2023 (Parks et al. 2025b; Dreher et al. 2022). A string detection technique was used to identify a subset of port and port equipment finance records for potential inclusion. A manual review of each “candidate” record was then conducted to eliminate false positives, and coders assigned values to a number of bespoke variables, including the precise name of the port, the type of port, the activity being financed, and the presence of Chinese owners or operators. The research team also collected supplemental data on grant and loan commitments for port projects in 2024 and 2025, extending the time frame covered.
These screening procedures and additional searches identified 363 unique Chinese-financed projects worth $23.9 billion at 168 unique ports across 90 countries from 2000 to 2025. 159 projects supported by commitments worth $10.8 billion are located in high-income countries (HICs), while 204 projects supported by commitments worth $13.1 billion are located in low- and middle-income countries (LMICs).
A previous report, Harboring Global Ambitions, and the earlier CPORTS 1.0 dataset only considered China’s official sector financing for port construction and operations (Wooley et al. 2023). It excluded financing for port equipment, such as the donation of container scanners, in order to focus solely on Chinese financing for deepwater ports that have dual-use (civilian-military) capabilities.
For the present analysis, the scope of inquiry was expanded to include Chinese loans and grants that financed the acquisition of port equipment. In some cases, Chinese financing supported both port construction and equipment acquisition at the same location. Figure 2 below maps China’s total financial commitments for ports worldwide, aggregating lending and grant-giving by port. Table 1 below presents the top 20 Chinese-financed ports by total commitments, including financing for ports, port facilities, and port equipment. Total commitment values captured here also include purely financial activities related to ports, such as acquisition loans for purchasing ownership stakes in overseas ports.
Figure 2. China’s official sector lending and grant-giving for overseas ports, 2000-2025
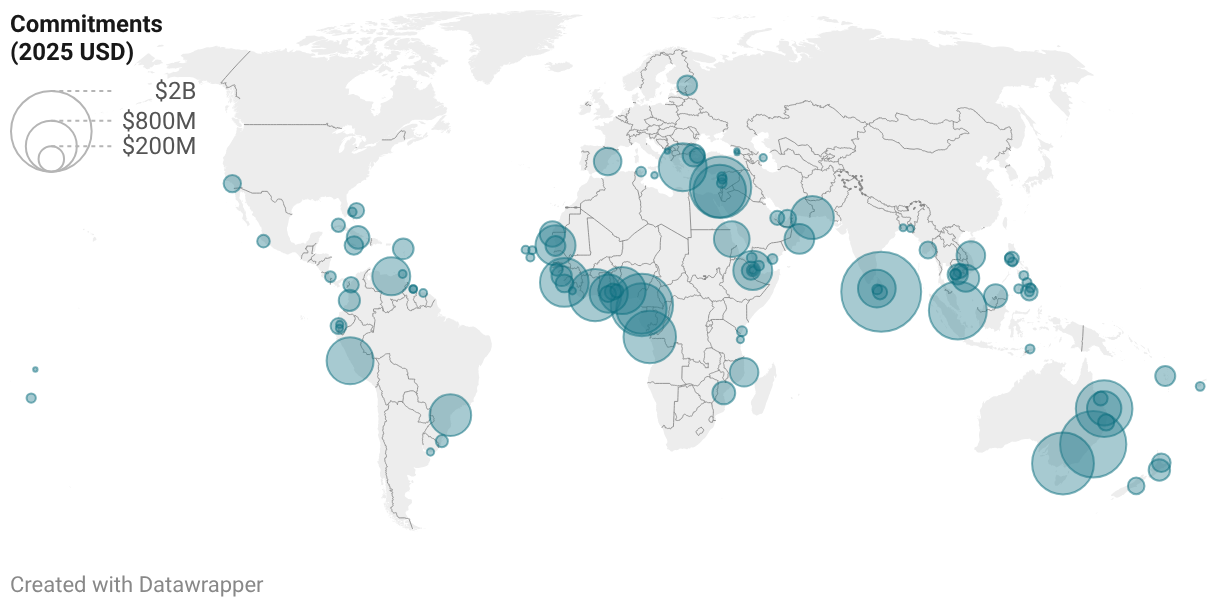
Note: Financial commitments are shown in constant 2025 USD. Excluded from this map are those loans that are not recommended for aggregation. Source: AidData’s CPORTS Dataset, Version 2.0.
Table 1. Top 20 Chinese-financed ports, 2000-2025
Rank |
Port |
Country |
Commitment (2025 USD) |
1 |
Hambantota International Port |
Sri Lanka |
$1.97 billion |
2 |
Port of Newcastle |
Australia |
$1.32 billion |
3 |
Autonomous Port of Kribi |
Cameroon |
$1.17 billion |
4 |
Port of Melbourne |
Australia |
$1.14 billion |
5 |
Haifa Port |
Israel |
$1.13 billion |
6 |
Jurong Port Universal Terminal |
Singapore |
$994 million |
7 |
Wiggins Island Coal Export Terminal |
Australia |
$946 million |
8 |
Port of Ashdod |
Israel |
$806 million |
9 |
Port of Caio |
Angola |
$804 million |
10 |
Autonomous Port of Abidjan |
Côte d’Ivoire |
$792 million |
11 |
Port of Bata |
Equatorial Guinea |
$733 million |
12 |
Queen Elizabeth II Quay [6] |
Sierra Leone |
$682 million |
13 |
Port of Piraeus |
Greece |
$660 million |
14 |
Lekki Deep Sea Port |
Nigeria |
$635 million |
15 |
Port of Chancay |
Peru |
$631 million |
16 |
Gwadar Port |
Pakistan |
$522 million |
17 |
Porto Paranaguá |
Brazil |
$483 million |
18 |
Autonomous Port of Nouakchott |
Mauritania |
$444 million |
19 |
Doraleh Multipurpose Port and Damerjog Livestock Port [7] |
Djibouti |
$418 million |
20 |
Port of Tema |
Ghana |
$398 million |
Source: AidData’s CPORTS Dataset, Version 2.0.
As Figure 3 below illustrates, approximately 35% of port and/or port facility projects financed by Chinese official sector agencies also involve Chinese port ownership and/or operational control. Disaggregating this figure provides additional clarity. Of the total sample, 20% of projects involve both a Chinese port owner and operator, 6% involve a Chinese owner only, and 9% involve a Chinese operator only. In aggregate, 29% of projects include at least a Chinese operator (whether or not ownership is also present), while 26% involve a Chinese owner. This distribution suggests that Beijing’s priority may extend beyond equity ownership toward securing operational control. To be sure, there are potential negative aspects to this, for both port-hosting nations as well as China’s rivals: operating rights confer significant practical authority, including control over scheduling systems, berth allocation, logistics coordination, and day-to-day port management. In many cases, Chinese SOEs that obtain operating rights are positioned to influence shipping routes, prioritize affiliated carriers, and adjust traffic flows in ways that align with broader commercial or strategic objectives. When combined with ownership stakes, these operational roles can amplify leverage, deepen long-term commercial integration, and enhance strategic influence over maritime trade corridors.[6][7]
From a policy perspective, the relatively high proportion of projects involving Chinese operators (29%) indicates that operational control is not incidental but appears to be a deliberate component of China’s port engagement model. The combination of financing, ownership, and especially operational control may therefore create layered forms of influence that extend beyond traditional infrastructure investment.
Figure 3. Breakdown of Chinese-financed seaport projects by Chinese entity involvement, 2000-2025

Source: AidData’s CPORTS Dataset, Version 2.0.
Table 2 presents the ports and facilities where both Chinese owners and operators are present. There is notable overlap with the most heavily financed ports in Table 1, indicating that many ports are not only significant in terms of total financing commitments but also involve a high degree of ownership and operational control by Chinese entities. Many of these ports or port facilities are strategically positioned along key sea lines of communication (SLOCs), including concentrations of investment in the Indian Ocean and the Red Sea, as well as in the Gulf of Guinea, where Beijing seeks to connect and safeguard the mineral supply chains and critical infrastructure in West Africa where it has invested heavily. (For more on how China’s maritime strategy increasingly emphasizes investments in hubs of connectivity, see Chapter 4).
Table 2. Financing for ports and port facilities with both Chinese owners and operators, 2000-2025
Port |
Country |
Commitment (2025 USD) |
Haifa Port |
Israel |
$1.13 billion |
|
Hambantota International Port |
Sri Lanka |
$980 million |
Port of Newcastle |
Australia |
$667 million |
Port of Piraeus |
Greece |
$660 million |
Lekki Deep Sea Port |
Nigeria |
$634 million |
Port of Chancay |
Peru |
$631 million |
|
Wiggins Island Coal Export Terminal |
Australia |
$620 million |
|
Doraleh Multipurpose Port and Damerjog Livestock Port |
Djibouti |
$418 million |
Port of Boffa |
Guinea |
$91 million |
Khalifa Port |
United Arab Emirates |
$64 million |
Nouadhibou Fishing Port |
Mauritania |
$59 million |
Port of Melbourne |
Australia |
$44.9 million |
PLA Support Base |
Djibouti |
$20 million |
Laem Chabang Port |
Thailand |
N/A |
Note: Financial values in this table capture commitments made only when a Chinese port owner and operator was present.[8] The precise size of the loan commitment for Laem Chabang Port is unknown. Source: AidData’s CPORTS Dataset, Version 2.0.
The financiers and recipients of China’s official sector grant and loan commitments for ports projects have shifted considerably since 2000, as Table 3 demonstrates. Nonetheless, some constants remain. Australia has always been one of the largest recipients of seaport finance, and Africa is always represented. While Chinese policy banks’ prominence has decreased while state-owned commercial banks have gained, the policy banks remain an important component of finance—just no longer in the dominating fashion they enjoyed before 2018.
Table 3. Chinese ports financing by top funding agencies and recipient countries, 2000-2025
Period |
Top three funding agencies |
Top three countries of activity |
2000-2013 (Pre-BRI) |
|
|
2014-2017 (Early BRI) |
|
|
2018-2025 (Late BRI) |
|
|
Source: AidData’s CPORTS Dataset, Version 2.0.
China’s official sector grant and loan commitments- support multiple kinds of port infrastructure, ranging from the construction of entirely new ports and terminals to the extension of piers and berths. Two new qualitative variables were added to the CPORTS 2.0 dataset to enhance analysis: a port facility type variable and a port facility purpose variable.
The port facility type variable seeks to identify what types of physical infrastructure Chinese financing is supporting, such as a terminal, pier, berth, or industrial park. The most common type of construction efforts at ports were for terminals, supporting 35 ports across 58 projects and activities in $9.5 billion of commitments. Construction efforts for more broader works at ports was the second-most common type of port facility financed, supporting 22 seaports across 36 projects and activities in $6.1 billion of commitments.
The port facility purpose variable categorizes the larger purposes of the port facility, such as whether a port primarily serves general cargo and container traffic or was specifically designed to facilitate the export of a specific commodity like liquefied natural gas (LNG) or coal. China’s seaport lending and grant-giving portfolio places great emphasis on supporting the general cargo and container traffic operations of ports—48 ports in 100 projects and activities worth $14.2 billion with general cargo and containers as their purpose. Furthermore, mineral and energy infrastructure is a focus, with finance supporting 13 ports across 31 projects and activities via $3.7 billion in commitments.
It is no accident that mineral and energy infrastructure enjoys a privileged place in China’s official sector financing of seaports. Following the adoption of “BRI 2.0” reforms that began in 2018, China’s state-owned commercial banks have assumed an increasingly important role (see Table 3 below)—via increasingly complex financial arrangements—in expanding Beijing’s control over key segments of the global supply chain for critical minerals (Parks et al. 2023; Escobar et al. 2025). Beijing also appears to be aligning its strategy for ports and port facilities with these changes by focusing its port investments alongside these commodities, discussed at greater length in Chapter 4. Table 4 demonstrates that many of the top 10 ports and port facilities financed during the BRI 2.0 era appear to follow this model.[9] It also highlights a strong focus on the Gulf of Guinea, South America, and Australia.
Table 4. Top 10 Chinese-financed ports during the late BRI, 2018-2025
Port |
Country |
Commitment (2025 USD) |
Lekki Deep Sea Port |
Nigeria |
$635 million |
Port of Chancay |
Peru |
$631 million |
Port of Newcastle |
Australia |
$509 million |
|
Hambantota International Port |
Sri Lanka |
$489 million |
|
Wiggins Island Coal Export Terminal |
Australia |
$326 million |
|
Queensland Curtis LNG Common Facilities |
Australia |
$315 million |
Port of Melbourne |
Australia |
$305 million |
Jurong Port |
Singapore |
$251 million |
Port of Duqm |
Oman |
$227 million |
Port of Valencia |
Spain |
$190 million |
Source: AidData’s CPORTS Dataset, Version 2.0.
Figure 4 is a useful, recent example of the before-and-after results of Chinese financing one port: Lekki Deep Sea Port in Nigeria, today one of West Africa’s most important commercial container hubs. China Development Bank (CDB) provided a $629 million loan for Lekki Deep Sea Port in 2019.[10] China Harbor Engineering Company Ltd. began construction in 2020 and held a stake in the port operator after construction was completed in 2022. Figure 4a shows the site of the Lekki Deep Sea Port in 2019 prior to development activities, while Figure 4b shows the operational port two years after completion in 2024. Visible elements include a substantial breakwater for port protection and multiple berths and cranes at the container terminal.
Figure 4a. Lekki Deep Sea Port in 2019, prior to development
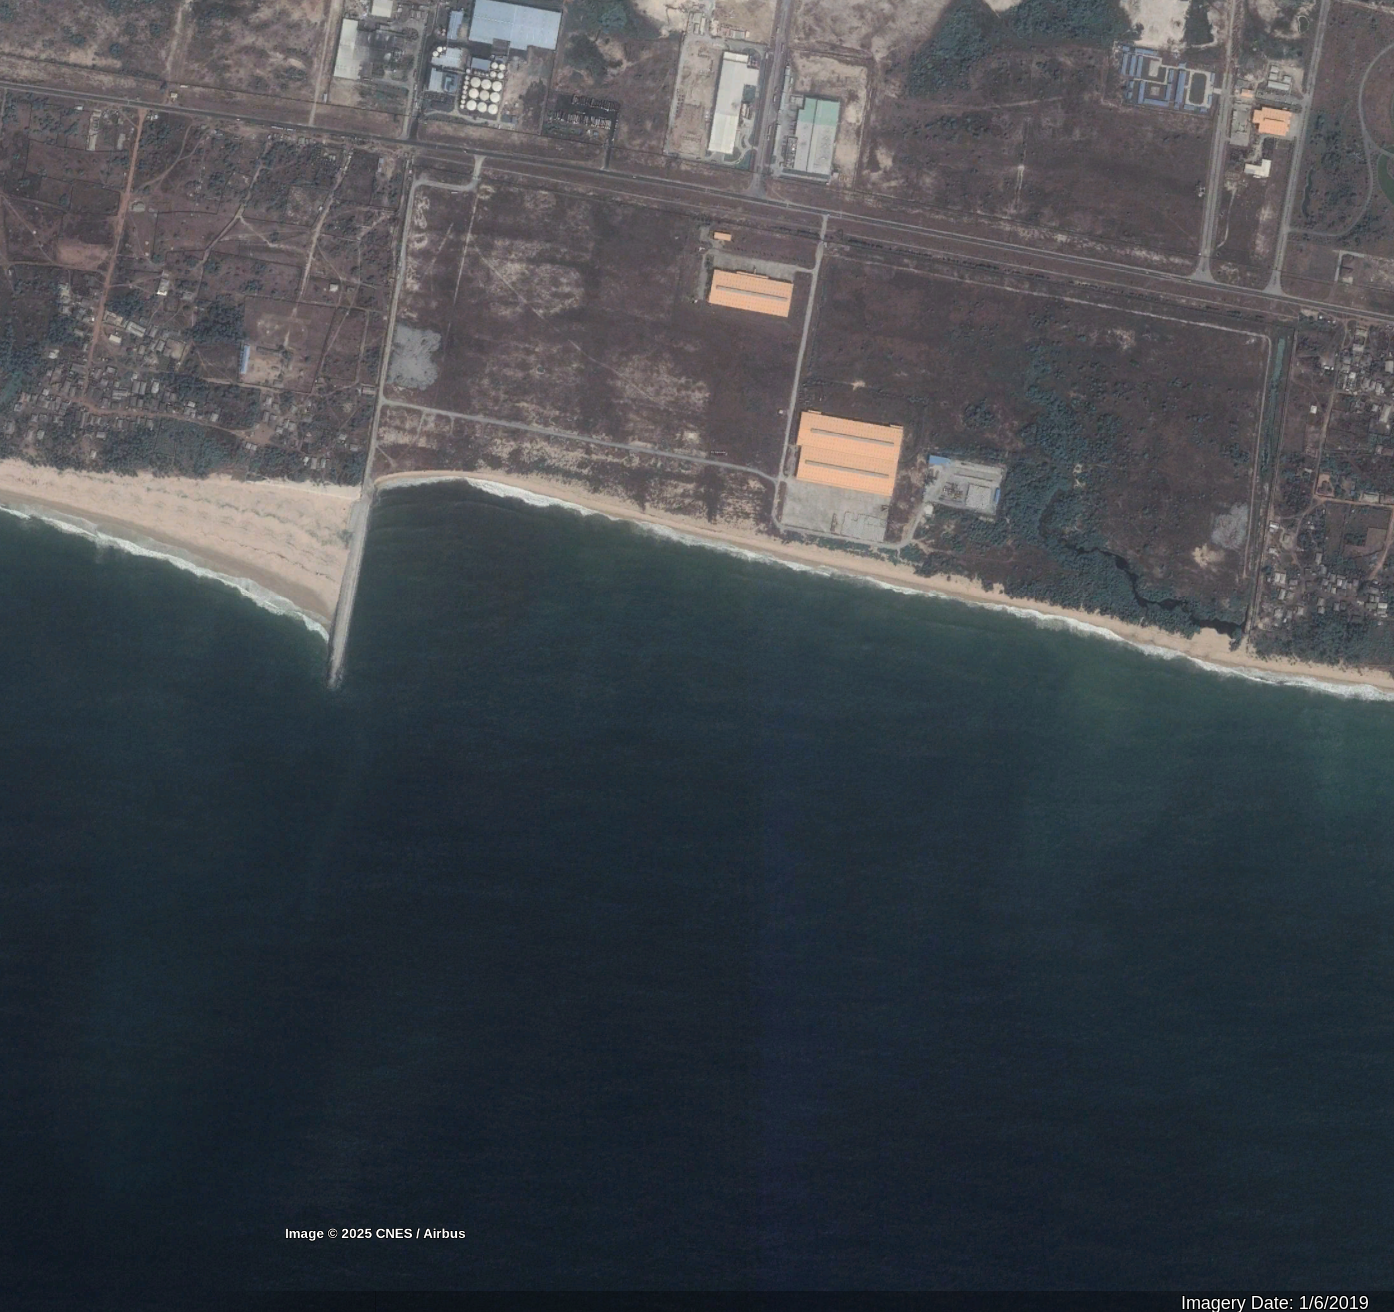
Figure 4b. Lekki Deep Sea Port in 2024, after opening in 2023
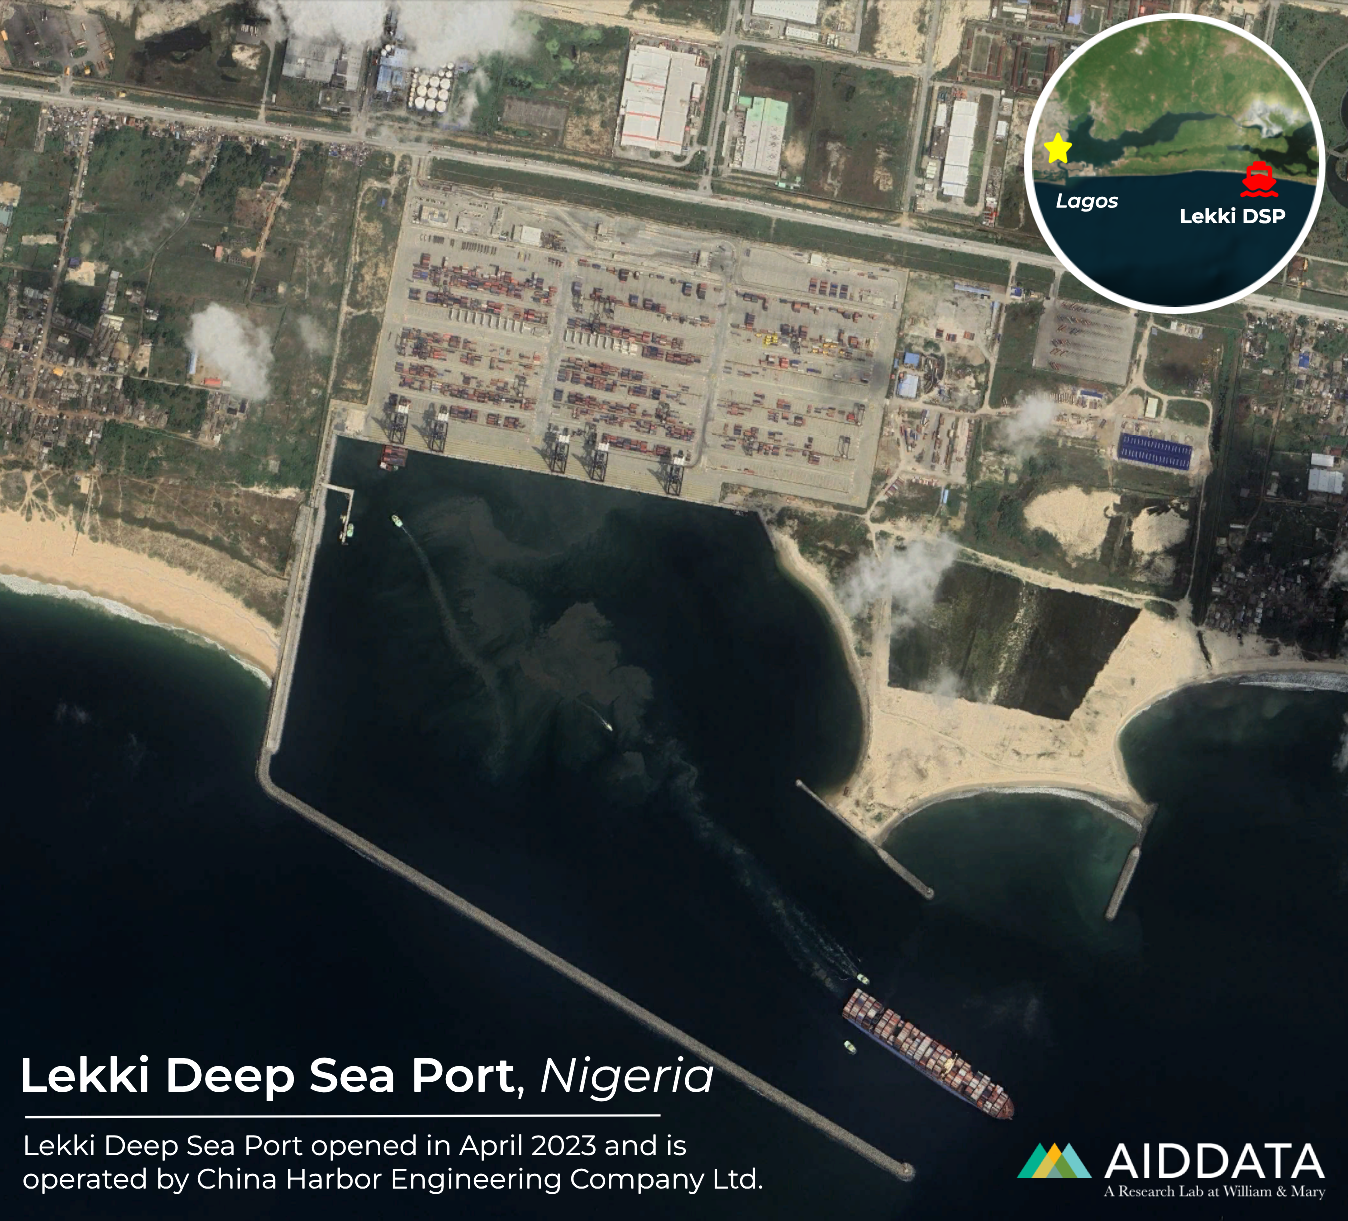
Sources: Imagery in Figures 4a and 4b by CNES/Airbus (2025) and Google Earth.
2.1 Chinese-financed ports in high-income countries
Beyond providing four additional years of coverage, the CPORTS 2.0 dataset captures the full range of Chinese official sector loans and grants for ports in high-income countries (HICs), including the United States, Australia, and the EU, thus permitting a truly global analysis of China’s global seaports footprint. A key finding from Chasing China: Learning to Play by Beijing's Global Lending Rules is that HICs are an integral part of Beijing’s overseas lending and grant-giving portfolio (Parks et al. 2025a). China’s financial support for ports in HICs is no exception: 45.1% of its total ports portfolio (worth $10.8 billion) supports 29 port locations[11] and a number of port companies in 20 HICs across a wide variety of geographic regions (see Table 5 below), as well as pledges for four ports in three countries and financing for various port companies. Beijing’s financial commitments range from modest grants for drydocks in Malta to syndicated loans worth tens of millions of dollars for the construction of a new container terminal in the UAE.
China’s seaport financing activities in developed economies support many of the same goals as those in developing economies: boosting Chinese exports, facilitating imports of essential raw minerals, promoting the commercial interests of Chinese companies, and seeking profits for banks. Yet its seaport financing in HICs takes on different forms. For one, financial support for physical construction or the provision of equipment is considerably less prevalent. Only 50.4% of China’s HIC portfolio supported port construction or equipment acquisition, as compared to 86.7% in its LMIC portfolio. With a wealth of existing and mature port assets in HICs—and greater skepticism over wholescale Chinese investment in critical infrastructure—there are fewer opportunities for financing greenfield port construction. However, there are still opportunities to make inroads in HICs. In developed economies, Beijing has focused its efforts on (a) merger & acquisition (M&A) loans that help Chinese investors purchase equity stakes in ports and port companies; and (b) the provision of liquidity support (for general corporate or refinancing purposes) to ports and port companies, which helps ensure the smooth operation of port facilities.[12]
Table 5. Top 20 Chinese-financed ports in high-income countries, 2000-2025
Rank |
Port |
Country |
Commitment (2025 USD) |
1 |
Port of Newcastle |
Australia |
$1.32 billion |
2 |
Port of Melbourne |
Australia |
$1.14 billion |
3 |
Haifa Port |
Israel |
$1.13 billion |
4 |
Jurong Port |
Singapore |
$994 million |
5 |
Wiggins Island Coal Export Terminal |
Australia |
$946 million |
6 |
Port of Ashdod |
Israel |
$806 million |
7 |
Port of Bata |
Equatorial Guinea* |
$733 million |
8 |
Port of Piraeus |
Greece |
$660 million |
9 |
Queensland Curtis LNG Common Facilities |
Australia |
$315 million |
10 |
Port of Duqm |
Oman |
$227 million |
11 |
Port of Valencia |
Spain |
$190 million |
12 |
Port Botany and Port Kembla [13] |
Australia |
$179 million |
13 |
Muara Port |
Brunei Darussalam |
$128 million |
14 |
Napier Port |
New Zealand |
$104 million |
15 |
Port of St John's Antigua |
Antigua and Barbuda |
$96 million |
16 |
Ust-Luga Commercial Sea Port |
Russia |
$85 million |
17 |
Port of Tauranga |
New Zealand |
$73 million |
18 |
Khalifa Port |
United Arab Emirates |
$64 million |
19 |
Port of Long Beach |
United States |
$62 million |
20 |
Lyttelton Port |
New Zealand |
$55 million |
Note: Equatorial Guinea was classified by the World Bank as a high-income country between the years 2007 and 2014. It was later reclassified to upper-middle-income status. As such, it is included in this report’s analysis of HIC ports. Source: AidData’s CPORTS Dataset, Version 2.0.
While these types of financial support draw less attention than financing for brick-and-mortar activities, they are particularly important for the operation and control of port assets.[13] In particular, M&A loans and liquidity support facilities from Chinese state-owned entities can give compatriot firms the initial cash to establish footholds in far-flung places and then maintain their investments over time. 61.6% of China’s official sector M&A lending and liquidity support commitments in HICs supported ports with Chinese or Hong Kong owners or operators.[14] These are rarely one-off transactions; rather, they are provided as recurring support over an extended period of time. Consider Chinese seaport finance at the Port of Melbourne, Australia's largest container and general cargo port. As part of its 2016 privatization by the Victorian state government, a consortium of institutional investors and funds—including China Investment Corporation (Beijing’s sovereign wealth fund)—acquired a 50-year concession and lease over the port’s 35 commercial berths, 515-hectares of land, shipping canals, and other assets. To finance the deal, the consortium borrowed over A$9.7 billion from a syndicate of lenders including Bank of China (BOC), China Construction Bank, and the Industrial and Commercial Bank of China (ICBC). Later, in 2019, a trio of Chinese state-owned lenders participated in another syndicated loan to partially refinance some of the debt the consortium contracted during the initial privatization, and in 2024 further group of Chinese state banks take part in a A$500 million facility for the port’s refinancing and working capital needs. There is little doubt that China Investment Corporation’s stake contributed to the Chinese state banks’ long-term support of the port.
However, Chinese or Hong Kong presence at a port is not required to attract Chinese state capital. In 38.7% of Beijing’s official sector M&A lending and liquidity support commitments for ports in HICs, no Chinese or Hong Kong owners or operators were involved. Such activities range from supporting Macquarie Infrastructure Partners’ acquisition of a 80% stake in the Long Beach Container Terminal in California to the provision of a liquidity support facility to the Port of Brisbane in Queensland, Australia.[15] Some of these ports benefit from long-term support; Napier Port in New Zealand, for example, received NZ$120 million in ICBC lending in 2019 for the 6 Wharf Expansion Project, a berth renovation, and later benefited from a NZ$80 million facility from ICBC in 2025 for refinancing and general corporate purposes. Though ports like Long Beach or Brisbane can have great commercial and strategic significance, these transactions involve only Chinese actors at the financing stage; there is little empirical evidence to suggest that China is pursuing or securing any geostrategic advantages through these investments—rather, the apparent motive is financial profit.
While there is a fair degree of coherence and consistency in China’s overseas seaport financing portfolio in HICs, there are some sources of regional variation that merit further exploration. 43.8% of China’s aid and credit commitments for seaport activities in HICs supported Australia and Oceania, while 23.9% supported activities in the Middle East. 10% supported activities in Europe. The following subsections dives deeper into each region.
2.1.1 Regional focus: Oceania and Australia
While Oceania was the largest regional beneficiary of China’s official sector financial commitments for seaport projects in HICs between 2000 and 2025, it was almost entirely driven by one mammoth recipient: Australia. In fact, the country is the single largest recipient of Chinese seaport financing worldwide, with $4.5 billion supporting seven ports: Port Botany and Port Kembla, Brisbane, Hay Point, Newcastle, Melbourne, Queensland Curtis, and Wiggins Island at Gladstone. There were also pledges of financial support for another two ports that never reached the formal commitment stage: Darwin and Oakajee. Of note, Australia is also the world’s third-largest recipient of all official sector lending and grant-giving from China: $130.7 billion from 2000 to 2023 (Parks et al. 2025a). China’s seaport financing activities in Australia have generally supported efforts to secure raw minerals, and especially coal and iron. These include the Wiggins Island Coal Export Terminal and the terminals at the ports of Newcastle and Hay Point. Even though China is both a major importer of Australian minerals and its companies have a substantial presence in the Australian mining sector (i.e. the Sino Iron Project and Karara Iron Ore Project, both of which were heavily supported by Chinese state-owned banks), Chinese owners and operators have only a small presence at mineral-oriented seaports that actually received Chinese seaport finance. Only one, the Yancoal-minority owned Newcastle Coal Infrastructure Group (NCIG) Export Terminal at the Port of Newcastle in New South Wales—where China Merchants Port Holding Company is an operator—has Chinese ownership.
Even beyond mineral-focused ports, Chinese ownership and operatorship in Australia is limited. That said, ports with ownership or operatorship by Chinese or Hong Kong entities—Newcastle, Melbourne, and Wiggin Islands—received substantial funding, with some $3.4 billion in total financial commitments.
Chinese involvement in these Australian ports has largely avoided controversy, as activities appear primarily commercial in interest and limited to financing. However, because of its security implications, Chinese activity at Darwin Port in the Northern Territory has been a long-standing source of heated debate in Australia. The facility’s northern location puts it in close proximity to key Indo-Pacific shipping routes. Private Chinese company Shandong Landbridge acquired a 99-year lease at Darwin in 2015, with plans to develop a hotel and logistics base at the site.
The deal quickly became controversial. Then-U.S. President Barack Obama criticized the lease and claimed that the U.S. government had little time to register its concerns with the Australian government. American officials worried that Chinese port access to Darwin would facilitate espionage on the nearby U.S. Marine Corps presence (Coorey and Tingle 2015). Landbridge denied any ulterior motive. Lesser known is that Landbridge, circa 2017, sought a A$500 million loan from China Eximbank to support redevelopment at the port. That loan was ultimately never finalized. Darwin has remained a point of contention as recently as January 2026, with plans by the government of Anthony Albanese to force Landbridge out of the lease, which in turn drew threats from Chinese officials (McIlroy 2026). Nonetheless, other sources of seaport financing to Australia have persisted with a port portfolio that appears largely commercial in orientation—none of the ports funded by official Chinese agencies or entities are geographically proximate to Australia’s AUKUS industrial or operational bases, which have been concentrated to date around Perth and Adelaide, or have attracted much scrutiny outside of Darwin, and the minimal Chinese ownership and operatorship speaks to Chinese banks simply seeking out profits by lending to ports.
Australia’s neighbor, New Zealand, has also been a recipient of official sector credit from China, with some $232 million for three ports: Napier, Lyttelton, and Tauranga. While not comparable in scale to its financial footprint in Australia, Chinese seaport financing in New Zealand is not insignificant; the size of the bank syndicates that provide loans to these ports are small—ranging from two to five banks—meaning that Chinese state-owned creditors play outsized roles in bankrolling the construction and operation of these ports.[16] None of these ports have Chinese or Hong Kong ownership or operatorship, suggesting that, like in Australia, Chinese banks’ goal is profit-seeking.
2.1.2 Regional focus: The Middle East
The second largest high-income regional beneficiary of China’s seaport financing commitments is the Middle East, with $2.6 billion supporting five ports—Haifa and Ashdod in Israel, Khalifa in the United Arab Emirates, New Doha Port in Qatar, and Duqm in Oman—as well UAE-based global port and terminal operator AD Ports Group. This pattern tracks with the wider deepening of economic relations between China and the Middle East. Between 2018 and 2023, China showered the broader Middle East with financial support: six of the twenty largest recipients of official sector credit were Saudi Arabia, the United Arab Emirates, Turkey, Iraq, Iran, and Egypt (Parks et al. 2025a: 154). If one broadens the aperture to include the LMICs, China’s deep interest in the region's connective infrastructure becomes even more apparent: China’s seaport financing portfolio has supported facilities in Iraq, Lebanon, Syria, Yemen, and Turkey. Add into the mix Gwadar, in Pakistan’s far west, terminus to the China-Pakistan Economic Corridor, located on the Gulf of Oman and within a short sail to the Strait of Hormuz and the geographic linkages of these assets is apparent.
Economic considerations are no doubt a factor in these projects, as supporting ports facilitates the oil and gas trade that is important to China. Some 50% of China’s crude oil imports come from Gulf countries and 29% of its LNG imports come from Qatar and the United Arab Emirates, most of which must pass through the geostrategic Strait of Hormuz. Long-term disruptions of maritime traffic through this critical strait would cause economic pain for Beijing (Soni and Allen 2026; Corbeau and Erica Downs 2025). It is thus no surprise that the Middle East is one of the few areas where Beijing has taken tangible, public steps to establish a long-term naval presence. Its first overseas naval base in Djibouti—created nominally for anti-piracy efforts off of Somalia and after Chinese entities had invested in the nearby Doraleh Multipurpose Port—provided Beijing with the ability to have a permanent presence at the Bab-el-Mandeb, Gulf of Aden, and further up the Red Sea and to facilitate power projection across the Indian Ocean (Sun and Zoubir 2021). A naval base located within the strategic Persian Gulf itself would dramatically enhance its abilities to protect its seaborne lines of communication and its capacity to directly influence geopolitics in the region (Mazzucco 2025). Being able to sustain naval activity in the region, coupled with good ties with the region’s governments, also provides China with other benefits. In 2023, when Sudan fell into civil war, two PLAN vessels conducting escort missions in the Gulf of Aden evacuated hundreds of Chinese and foreign nationals from Port Sudan to the Port of Jeddah in Saudi Arabia, simultaneously safeguarding Chinese citizens and providing a valuable service for other countries (Ministry of National Defense 2023). With looming instability in the Middle East, China’s support of port infrastructure in the region may help facilitate more naval presence, protecting its supply chains.
Khalifa Port, in Abu Dhabi in the UAE, merits special scrutiny in this respect. In 2018, Bank of China, together with three other lenders, provided a $260 million loan to a 90:10 joint venture between COSCO and Abu Dhabi Ports Company to construct Khalifa Port Container Terminal 2 (also known as CSP Abu Dhabi Terminal), a three-berth, 2.4 million twenty-foot equivalent unit (TEU) terminal. COSCO obtained a 35-year concession with hopes to transform Khalifa into the Middle East’s next hub port. The project attracted substantial interest from a diverse range of Chinese state-affilitated actors. China’s National Development and Reform Commission “initiated and coordinated” the terminal project as part of the Belt and Road Initiative (ICBC n.d.). Besides COSCO’s equity stake in the terminal—only the second foreign terminal where it held controlling ownership—the joint venture hired several Chinese state-owned contractors to be involved in construction. China Harbour Engineering Corporation and CCCC First Navigation Engineering Bureau laid steel rails at the pier, helped automate the terminal, and constructed ancillary facilities; SinoPro provided steel and other construction supplies, and Shanghai Zhenhua Heavy Industries supplied 43 cranes. Operations at the terminal began in 2019.
In late 2021, allegations of non-commercial Chinese interests spilled into public view. That spring, the U.S. intelligence community assessed, based on reports and satellite imagery of Khalifa, that China was constructing a secret military installation within the terminal (Lubold and Strobel 2021). The assessment led to a flurry of diplomatic efforts by American officials to convince the Emirates of the facility’s military intent and potential consequences for US-UAE relations (Lubold and Strobel 2021). This included two phone calls between then-U.S. President Joe Biden and Abu Dhabi Crown Prince Mohamed bin Zayed al Nahyan. Besides the broad potential strategic impact, Khalifa’s relative proximity to sensitive sites—Jebel Ali Port, a port that hosts U.S. Navy goodwill and replenishment visits, and al-Dhafra Air Base, home to the American and French militaries—made the risk especially salient for policymakers in the United States (Mazzucco 2025). After the American pressure campaign, construction at the site halted in fall in 2021, and the UAE allowed American officials to inspect the site. The Emirati government denied ever considering hosting the Chinese military, in Khalifa or elsewhere.
The alleged attempt to build a military facility at Khalifa is consistent with concerns that Beijing has an interest in expanding its naval presence in the Middle East beyond its base in Djibouti, providing it with strategic depth and breadth to support its foreign policy agenda in the region. Nonetheless, a larger footprint is not without risk; a Chinese base would leave it directly exposed to regional disputes and crises, potentially forcing it into unwanted entanglements that endanger the powerful commercial considerations that motivate much of China’s financing of seaports. Given its strategic location and the continued importance of its fossil fuels to the Chinese economy, the Middle East will likely continue to attract Beijing’s seaport investments for the foreseeable future.
Figure 5a. Khalifa Port in 2016, prior to Chinese-financed development
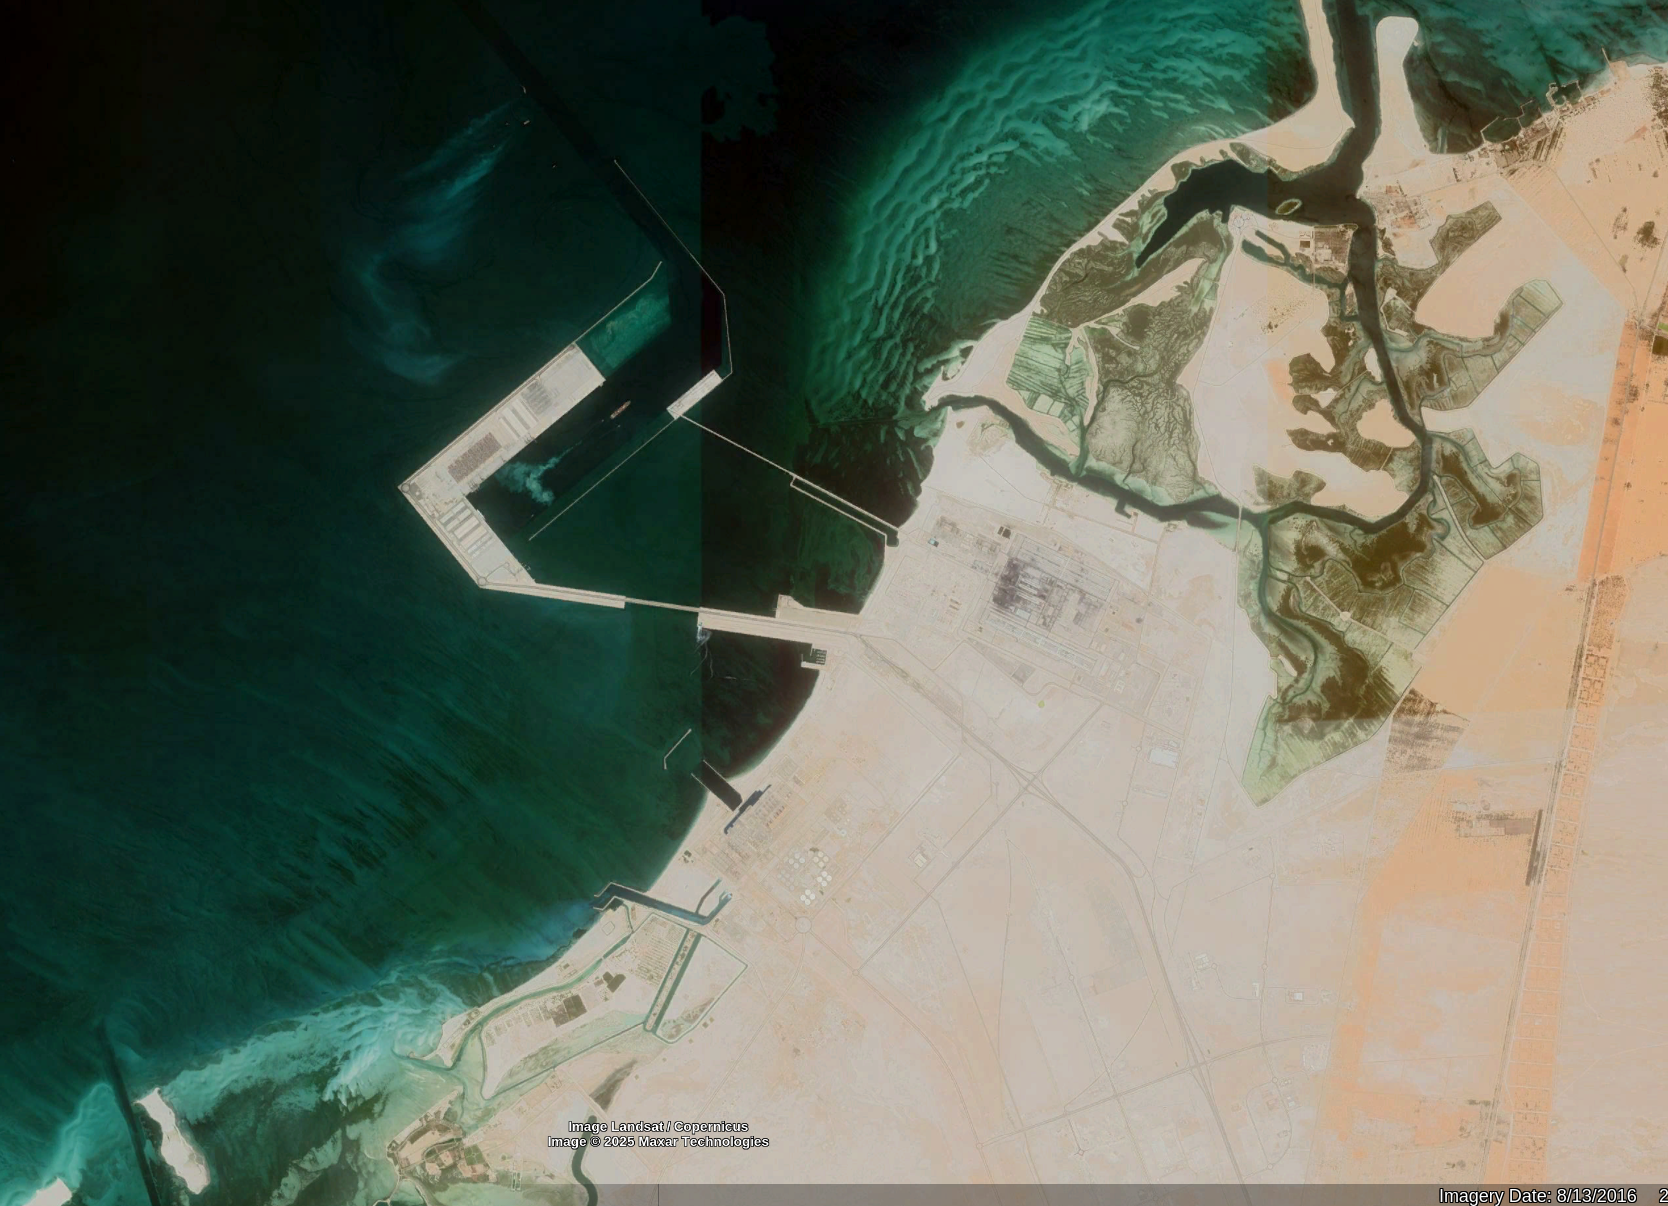
Figure 5b. Khalifa Port in 2021, after Terminal 2’s opening in 2019
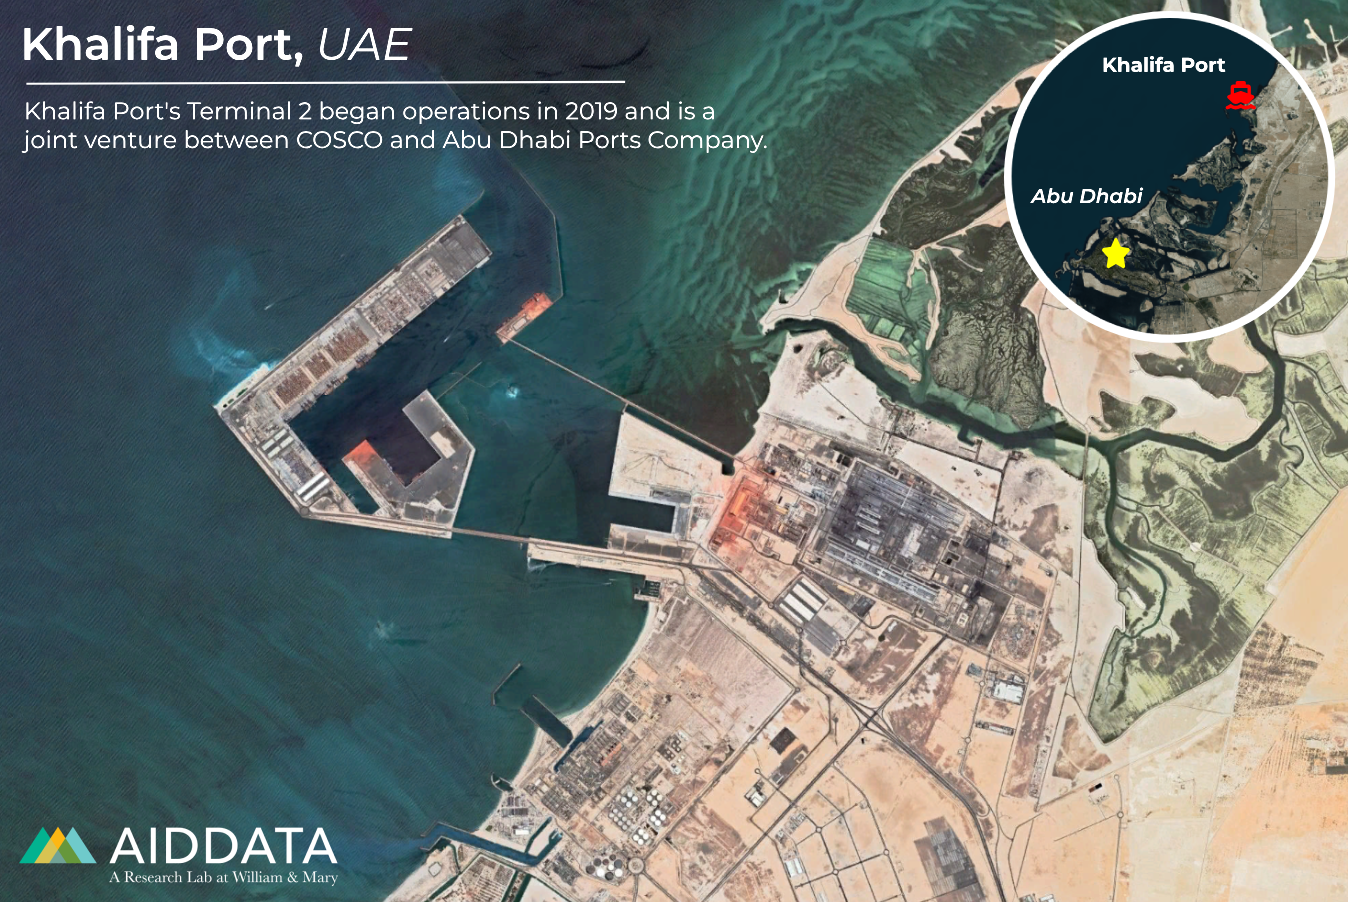
Sources: The imagery in Figures 5a and 5b is by Vantor (2025) and Google Earth.
2.1.3 Regional focus: Europe
China’s financial commitments for seaport projects in European HICs totalled $1.1 billion across six ports: the Malta Drydocks and the Malta Freeport, Sabetta and Ust-Luga in Russia, Piraeus in Greece, and, most recently, Valencia in Spain. These commitments also supported two port companies: United Kingdom-based PD Ports, a port operator and owner focused on England, with some operations at the country’s largest port container port, Felixstowe, and Europe Container Terminal B.V., a Netherlands-based firm affiliated with Hong Kong-based CK Hutchison Holdings that has operations at the Port of Rotterdam and other ports. Chinese and Hong Kong companies are well-known European port operators and owners, playing key roles in the region’s connective infrastructure, with significant footprints in Hamburg in Germany and Antwerp in Belgium, among others. However, these investments are not known to have benefited from loans or grants from China’s official sector agencies (which often offer generous terms for Chinese companies making large overseas investments) and thus are not included in the CPORTS 2.0 dataset. However, the most well-known Chinese port investment in Europe—the Port of Piraeus in Greece—did benefit from such activity.
CDB issued two loans worth $551 million to support Chinese state-owned COSCO Shipping Ports’ acquisition and renovation of Pier II and III of Piraeus Container Terminal under a 30-year build-operate-transfer concession. Under the terms of the initial agreement, COSCO increased the throughput capacity of the container terminal to 3.7 million TEUs. COSCO's concession was a major success, leading to one of the largest increases in TEU handling in all of Europe by 2016, where Piraeus was the eighth largest container port by TEU (Glass 2017). In 2016, COSCO later acquired a 51% ownership stake in the Piraeus Port Authority from the Greek government, which grew to 67% in 2021 after COSCO made hundreds of millions of euros in mandatory investments (Koutantou 2021). In an article in Greek newspaper Kathimeriní just prior to his November 2019 visit to Greece—which included a stop at the Port of Piraeus—Xi Jinping called the port the “dragon’s head” for Chinese investment in Greece and pointed out the port’s success as one of the largest in the Mediterranean (Kathimeriní 2019). In Europe, Chinese SOEs tend to be minority shareholders, though in some cases enough shares to block or affect corporate decisions. Piraeus is a notable exception, with COSCO exercising full control over both of its terminals and the port authority itself—though it took years for it to achieve those powers (Popławski 2025).[17]
Brent Sadler, a Senior Research Fellow in Naval Warfare and Advanced Technology at the Heritage Foundation's Allison Center for National Security, has argued that the U.S. can more effectively work with its allies to marry trade with security, ensuring access to needed shipping and ports in crisis and conflict. In Greece, he has advocated for opening ports like Elefsina to facilitate greater energy trade, gain access to a naval repair facility, and mitigate potential interference by Chinese entities at their nearby Port of Piraeus (Sadler 2025b).[18]
Chinese influence over ports in Europe, whether at Piraeus or other sites where Chinese and Hong Kong companies have ownership and operatorship, have spurred increased strategic and security concerns, including specific worries about espionage linked to hardware and software provided by such entities. More broadly applicable are the economic implications of China’s port presence in Europe. These countries are important trade partners for China and streamlining trade—both via physical port infrastructure and the economic and diplomatic cooperation that comes with port operatorship—remains a major incentive for Chinese companies to engage with Europe in the ports space.
3. Chinese-financed port equipment: Linking hardware and software
By Lea Thome
This report and the associated CPORTs 2.0 dataset capture, for the first time, Chinese state-directed financial commitments for shoreside port equipment—key components that are often closely integrated into Chinese-financed ports. The machinery in question includes scanners, cranes, management software, and forklifts, among others. Together, these activities mutually reinforce Chinese maritime power and demonstrate China’s preeminence as an essential supplier of these tools for global maritime supply chains. By marrying hardware with software, Chinese financiers and suppliers are able to offer “package deals” and build integrated logistics networks that move beyond physical infrastructure to the digital sphere.
The CPORTS 2.0 dataset tracks port equipment across three categories: (1) “customs and security equipment,” such as the containers and truck scanners provided by the Chinese company Nuctech; (2) “ship-to-shore and handling equipment,” such as the cranes provided by Chinese state-owned enterprise Shanghai Zhenhua Heavy Industries (ZPMC) used to onload and offload containers at seaports; and (3) “general equipment provision,” used when specific equipment cannot be identified or when equipment is provided alongside general financing for the construction, extension, and modernization of a port facility.
Although other categories of port equipment exist, including software applications like LOGINK, the CPORTS 2.0 dataset only captures Chinese official sector financing activities, which include grant and loan commitments. Still, LOGINK—a ports logistics platform initially pioneered by Zhejiang’s Department of Transportation and disseminated to ports across the world free-of-charge—highlights the wide-ranging nature of port equipment provided by Chinese agencies and companies.
Figure 6. Chinese official financing for overseas port equipment, 2000-2025

Source: AidData’s CPORTS Dataset, Version 2.0.
Between 2000 and 2025, Chinese financiers directed over $4.7 billion for 102 port equipment projects and activities at 70 seaports worldwide, ranging from the United Arab Emirates and Australia to Peru and the Philippines.[19] However, aid and credit for port equipment is often linked to port facility financing—a port undergoing a modernization may also see the installation of new scanners or cranes. The data shows no clear evidence that Chinese financiers prefer to direct financing for port equipment to ports where Chinese operators or owners are present. Instead, there is an almost even split between ports where Chinese entities are present (49%) and are not (51%).
The Port of Buenaventura in Colombia is a case in point. ICBC and BOC contributed $68.5 million of refinancing support for the Port of Buenaventura’s construction and modernization in 2018; earlier, in 2010, the Chinese Embassy in Colombia provided a grant for on-site installation and use of scanning equipment for shipping containers. In 2024, ICBC contributed a further $33.1 million to Phase 2 of Buenaventura’s expansion project, including the addition of two new ship-to-shore container cranes.
China’s official sector financiers provided $491.3 million in grant and loan commitments for port equipment alone, excluding any projects that also include financing for other port facility infrastructure. However, this number is artificially low, as port facility financing often includes the acquisition of equipment, without identifying how much money is specifically earmarked for this purpose. Port equipment is also much less expensive than port infrastructure, with scanners and cranes typically only accounting for a few million dollars per acquisition.
3.1 What accounts for China’s increased financing of ports equipment?
Two years stand out in China’s seaport equipment financing portfolio: commitments in 2014 account for 40.6% of the portfolio, while commitments in 2023 account for 13.3% of the portfolio.
In 2014, BOC, ICBC, Bank of Shanghai, and Bank of Communications contributed to a syndicated loan for the Bayport Terminal concession project, which supported Shanghai International Port Group’s (SIPG) bid for the concession of the Bayport terminal at Haifa Port. This 25-year concession agreement made SIPG responsible for several components: construction of the facilities at the back terminal; deployment and installation of the port equipment needed to service the port; and daily running and operation of the terminal. In total, these four Chinese state-owned banks provided over $1 billion to support this project.
In 2023, one main driver of the spike in financing was the construction of the Port of Chancay in Peru—the first phase of which was completed and inaugurated in November 2024. Five Chinese state-owned banks contributed to a $975 million loan for the construction of the facility. A joint venture of Volcan Compañia Minera S.A.A., a publicly-held mining company in Peru, and COSCO SHIPPING Ports Ltd. COSCO, a state-owned Chinese company that is the second-largest operator of container ports in the world, acquired a 60% stake in the port (Thome 2024). As part of this financing, ZPMC served as an implementing agency and provided equipment, including “five double-cantilever automated rail cranes for the first phase” of the port (Shanghai Zhenhua Heavy Industries Co., Ltd. 2024).
3.2 Which Chinese entities provide port equipment?
Most often, port equipment refers to two primary kinds of machinery: customs scanners, which screen cargo as it enters and leaves the port, and ship-to-shore cranes, which transport cargo from the ship to the shoreside. Chinese companies, such as Nuctech and ZPMC, have established near-monopolies in their respective fields of scanners and cranes, with their products in-service in more than 100 countries around the world.
Figure 7. Chinese official financing for port equipment by type, 2000-2025

Note: “General equipment” and “ship-to-shore and handling equipment” are listed together as the top category, as this general equipment provision cannot be disaggregated when provided together with other kinds of equipment. Source: AidData’s CPORTS Dataset, Version 2.0.
Which kinds of equipment have received the most official financing from China from 2000 to 2025? General equipment alongside port financing emerged as the most-financed form of port equipment by China, with Chinese entities committing almost $1.9 billion in this twenty-six year period. A few of these projects also included ship-to-shore handling equipment alongside general equipment provision (here listed as “General Equipment and Ship-to-Shore and Handling Equipment,” as these cannot be disaggregated), reaching nearly $2.1 billion in financing.
However, when examined by record count, customs and security equipment—such as scanners—are the most common port equipment type identified in the CPORTS 2.0 dataset. These records typically either provide little or no information about the financial value of the equipment for which the grant or loan was obtained. These equipment provisions also tend to be much less expensive than other large-scale port equipment like cranes.
Figure 8. Composition of Chinese port equipment providers by implementing agency, 2000-2023

Note: Approximately $2.4 billion in financing for port equipment that could not be identified to a particular company and is excluded from this chart. Source: AidData’s CPORTS Dataset, Version 2.0.
This analysis also identifies the implementing agencies and providers for 64 port equipment projects and activities supported by financial commitments worth nearly $2.4 billion. Only five companies were responsible for these projects and activities: XCMG, ZPMC, ZPMC Lanka, Nuctech, and Cargotec Oyj.
XCMG served as the implementing agency and equipment provider for two projects supported by grant and loan commitments worth almost $810 million: the Baku International Sea Trade Port Assistance Project in Azerbaijan and the Ashdod Port Southern Terminal Construction Project in Israel. As part of the Baku project, XCMG provided 34 pieces of heavy equipment to the Baku International Sea Trade Port, including 16 forklifts with carrying capacity from 1.5 to 20 tons, two 45-ton telescopic container loaders, three 30-ton trailers for tractors, one 220-ton crane, and other equipment. In addition to the equipment, XCMG dispatched a six-member team to Azerbaijan for a 30-day training and support period.
ZPMC was selected as the equipment provider and implementing agency for projects financed by aid and credit commitments worth $787 million. It supported projects with equipment at the Port of Cotonou (Benin), the Port of Chancay (Peru), Terminal 2 of the Khalifa Container Port (UAE), the Port of Mariel (Cuba), the Rio Grande Container Terminal (Brazil), and the Kingston Container Terminal (Jamaica). While Nuctech has provided comparatively lower levels of port equipment financing ($250 million) than ZPMC and XCMG, it provided the largest number of equipment projects, with at least 44 known activities.
While ZPMC and Nuctech have made the news and drawn scrutiny from legislators in countries such as the U.S., China’s seaport equipment provision and its leading manufacturers and suppliers have generally flown beneath the radar. This analysis represents a first attempt to better understand the wide-scale dissemination of this equipment and its potential implications.
3.3 Why port equipment should be evaluated alongside general port financing
In the U.S. and Europe, concerns over the provision of port equipment have rapidly grown, as uncertainties remain about the extent of the data storage and sharing of sensitive information on cargo. A recent analysis by Thome (2025a) found that “although China’s distribution of scanners has enabled recipient countries to minimize security risks (such as detecting contraband and explosives) and increase revenue for local customs authorities...scanning equipment provided by Chinese enterprises with governmental oversight could give Chinese authorities insight into sensitive data, from biomedical information to military transshipments.” Such equipment typically comes from Chinese government agencies such as the Ministry of Commerce (MOFCOM) and a network of overseas embassies overseen by the Ministry of Foreign Affairs (MOFA). Rather than financing this equipment through loans, Chinese agencies and financiers often provide port equipment as grants, free of charge to the recipient, as found by a recent study that determined 82.4% of customs-scanner equipment provided by Chinese state-owned entities were donations (Thome 2025a).
Figure 9, which shows an official contract for container equipment provision by the Chinese government to Uruguay’s National Ports Administration in 2009, is an example of this: Nuctech Company Limited was ultimately responsible for the provision of the actual equipment, while the Chinese government supported this transaction financially through an Economic and Technical Cooperation Agreement (ECTA). In addition to providing the equipment, Nuctech assumed responsibility for training six Uruguayan staff members in China, with the Chinese side fronting the cost of the training—ultimately making acceptance and adoption of Chinese security scanners like Nuctech an easier process to manage.
Figure 9. Contract excerpt: Container equipment provision from the Chinese government to Uruguay’s National Ports Administration, 2009
 Note: For more
information related to this project, see
https://china.aiddata.org/projects/54994.
Note: For more
information related to this project, see
https://china.aiddata.org/projects/54994.
The use of Chinese equipment in overseas port facilities has also become a target of government scrutiny, with a U.S. congressional investigation into identified communication devices attached to ZPMC cranes brought to U.S. ports (U.S. House Committee on Homeland Security 2023). These activities “could allow for the capture of sensitive data, such as biomedical, cargo, and potential military transshipment information,” further reinforced by the U.S. Maritime Administration issuing a renewed worldwide advisory that stated Nuctech’s access to data “includes biometric information, personally identifiable information (PII), patterns of life and/or behavioral migrant patterns, cargo information, proprietary data, and geo-locational metadata” in April 2025 (Thome 2025a; U.S. Department of Transportation 2025a).
The CPORTS 2.0 dataset reveals that China not only covers the cost of its security and port equipment, offering its own companies a competitive advantage, but also often explicitly ties equipment provision to large-scale infrastructure loans, in which Chinese companies like SIPG are in charge of port modernizations, extensions, and operations. This linkage between port infrastructure and port equipment allows Chinese financiers, through the provision of aid and credit globally, to penetrate all dimensions of port operations—from the actual port to the software and hardware that runs the port.
China’s provision of customs equipment has also become increasingly sophisticated with the passage of time. While many records in the CPORTS 2.0 dataset capture financial commitments for the purchase of customs scanners and trucks, a recent transaction in Indonesia offered innovative anti-narcotics scanning equipment. In December 2024, the Chinese government handed over high-tech mobile inspection vehicles, as well as a robotic “sniffer dog” with an electronic nose, eye, and sensing features that can detect narcotics, precursors, and explosives, to the National Narcotics Board of Indonesia, which disseminated this equipment to the harbors of Bakauheni, Tanjuk Perak, and Batam.
In addition, new forms of “smart port” technology are also under development, with Chinese companies chief among the first innovators and users. According to Xinhua, “China has built 60 automated container terminals, continuing to lead the world in smart port construction” as of October 2025 (Xinhua 2025). Some of this domestic innovation is taking place at ports like Tianjin, where “the 5G + Smart Port Project introduced a cloud-based autonomous driving system that uses 5G networks and high-definition maps to coordinate real-time data from berths, quay cranes, Rubber-Tired Gantry (RTG) cranes, and driverless flatbed trucks” and where Huawei also jointly developed a “PortGPT” model (Huawei n.d.). Beyond this domestic focus on port automation, China has also focused on building new smart port partnerships abroad. For example, in July 2025, the Port of Barcelona and Shanghai International Port Group (SIPG) “signed an agreement to intensify the connections between both ports and share knowledge in the areas of digitalisation, standardisation and decarbonisation of maritime transport” (Port de Barcelona 2025). As this smart port initiative is only starting to ramp up, it remains to be seen how digital corridors and smart port technology agreements will translate into reality overseas, and whether Chinese companies at the heart of this innovation will provide digitization and automation services to global partners..
Most likely, China’s provision of port equipment is significantly higher than what is documented here, as the specific equipment provided as part of a larger modernization and construction effort is not always reported with a detailed breakdown. Thus, this analysis likely captures a conservative, lower-bound estimate of the true level of China’s financial support for the acquisition and installation of overseas port equipment.
4. China’s shifting maritime strategy: From overt basing to hubs of connectivity
By Lea Thome, Sheng Zhang, and Seth Goodman
China’s strategy for port financing appears to have shifted subtly over the last few years. U.S. pressure and host governments’ increasing reluctance to align with one side or the other amidst U.S.-China competition, while hedging to maximize their own wellbeing, have inadvertently altered China’s strategy. This comes as China is rebalancing its infrastructure investments, moving from a big-ticket infrastructure portfolio to what it terms a “small but beautiful” approach.
China has recalibrated its maritime expansion strategy fit for twenty-first century national security. Beijing now seems focused on maintaining stakes at critical chokepoints and nodes to secure its national, economic, food, and energy security—and provides official sector financing to secure these footholds.
4.1 A change in China’s strategy: Keeping a lower profile?
This course correction is also evident in China’s recent military strategies, which have shifted from the topic of “defense” to “national security.” Such a shift is made clearest by a white paper, China’s National Security in a New Era, published in May 2025 by China’s State Council Information Office (SCIO)—its first security-centered white paper since 2019 (SCIO 2025).
As Thome outlines in a separate study, this subtle change “not only breaks in timeline and tradition, but also offers a semantic shift in language, albeit implicit” (Thome and Kennedy 2026). The white paper specifically addresses the importance of “safeguarding national territorial integrity and maritime rights and interests,” noting that “China insists on coordinating land and sea development and upholding the unity of national sovereignty, security, and development interests” (SCIO 2025: 19; Thome and Kennedy 2026: 11). It also outlines the Chinese government’s vision to “cultivate a favorable external security environment,” while being “committed to making the ‘Belt and Road Initiative’ a path of peace” (SCIO 2025: 23).
While the white paper does not directly address the issue of maritime infrastructure and ports, it outlines China’s vision to play a coordinating role in global security governance—which would directly involve ports and maritime bases—as well as the increasing role that national security plays domestically and in China’s foreign policy. Other research papers published within China, although not emanating from the highest levels of government, provide additional and specific insights into China’s strategic thinking on overseas ports and describe an evolving maritime strategy. For example, a recent study of over 230 articles by Chinese academics found that “global ocean governance, as both a concept and a policy area, has become more prominent in the PRC since 2017” (Chan 2025: 3). The same study concluded that “China should play a more influential role in legal and institutional reform in the existing international maritime order” (Chan 2025: 3). This shift is playing out not only in the research sphere, but in deeds, as China’s quest for overseas seaports and maritime power—commercial and dual-use—shows no signs of letting up.
4.2 Hubs of connectivity: Integrating the port-railway-mine model
Beyond the rhetorical shift, a change in strategy is underway and a new form of maritime statecraft is taking hold. China is increasingly investing in hubs of connectivity, where ports lay in proximity or connected to other significant strategic investments, such as critical minerals, sensitive technologies, and other goods like soybeans, the last named as necessary for China’s food security.
While some of China’s investments into hubs of connectivity have occurred since 2000, this shift in strategy has been most notable since the mid-2020s. Since 2016, China has scaled back the overall size of its overseas lending and grant-giving portfolio (Parks et al. 2025a: 64). The change is also noticeable in seaport financing, with just over 25% of China’s seaport financing commitments taking place between 2018 and 2025. By contrast, in the preceding seventeen-year period (2000-2017), Beijing provided $17.8 billion of aid and credit for these maritime projects, representing 74.6% of its global seaport financing portfolio.
However, less funding does not imply that China is pursuing a strategic pivot away from overseas seaports; rather, Chinese companies and agencies are increasingly focused on terminal and port projects that are associated with critical goods and materials—moving beyond the so-called “Shekou Model.” Popularized in the 1980s when China Merchants Group, also the parent company of China Merchants Ports, developed Shenzhen into a modern-day metropolis through the development of a port and industrial zone (the “port-park-city” model), this template has persevered and evolved into in a new format of a “port-railway-mine”model.
Table 6. Examples of five areas of security sought out by Chinese companies and agencies
1. Food security |
2. Mineral security |
3. Energy security |
4. Economic security |
5. Military security |
Paranagua Port, Brazil |
Lobito seaport, Angola |
Sabetta Seaport, Russia |
Piraeus Port, Greece |
Port of Dolareh/Djibouti Base, Djibouti |
Santos Port, Brazil |
Chancay Port, Peru |
Kyaukphyu Seaport, Myanmar |
Hamburg Port, Germany |
Ream Naval Base, Cambodia |
China’s seaport financing can be organized around five hubs of connectivity, supported by the CPORTS 2.0 dataset and visualized above in Table 6: (1) food security, including fishing and soybeans, (2) critical mineral supply chain robustness, such as copper and lithium, (3) energy security, such as liquefied natural gas (LNG) or oil, (4) economic security and trade access (for example, at European ports), and (5) military security, such as the rotational or permanent presence of the PLA and PLAN overseas. To identify these hubs of connectivity, the authors examined port projects with the type classified as “mineral and energy infrastructure” or “administrative, storage, and supportive facilities,” as well as those with Chinese naval activity.
Chinese companies have prioritized these hubs interchangeably over the past two decades, with some investments dating back even further. To establish access to critical minerals and the ability to transport them, Chinese companies have invested in hubs such as Lobito Port in Angola and Chancay Port in Peru. For example, to establish overseas markets for its goods, COSCO has made two notable investments in Europe: at Piraeus Port in Greece and at the Port of Hamburg in Germany, where COSCO now holds a minority stake in the Container Terminal Tollerort. Militarily, China’s first overseas base in Djibouti is located right next to the Port of Dolareh, also captured by the CPORTS 2.0 dataset. Some port projects only address one of these hubs of connectivity, but others address multiple areas of interest. As new technologies and priorities emerge, these hubs of connectivity may shift.
4.2.1 Co-locating seaports with Chinese-financed critical mineral operations
The “port-railway-mine” model facilitates new commodity-focused transportation corridors, stretching from Peru and Brazil in South America to Zambia and Tanzania in East Africa. For example, the Chinese, Tanzanian, and Zambian governments signed an agreement in September 2025, offering a 31-year concession project worth over $1.4 billion for the China Civil Engineering and Construction Corporation (CCECC) to rehabilitate the Tazara (Tanzania–Zambia Railway) project and its equipment, as well as to operate it. As part of this agreement, CCECC is upgrading the railway, which spans from the Zambian city of New Kapiri Mposhi to Dar es Salaam, a major port city in Tanzania.
The CPORTS 2.0 dataset identifies the Port of Dar es Salaam as a location where Chinese financiers have previously pledged money: China Communications Construction Company (CCCC) intended to expand the container terminal at the port, supported by a loan from China Eximbank, but the contract was cancelled in 2013. That same year, China Harbour Engineering Company (CHEC) signed a memorandum of understanding to construct the Maruhubi Multipurpose Port Project to decongest the Port of Malindi in Tanzania. Ultimately, this project was also severely delayed; as of 2024, it was being constructed by ZF Defco, a Dutch-Tanzanian firm (Clyde & Co. 2024). While previous pledges of financial support have failed to materialize, the rehabilitation and operation of the Tazara railway offers Chinese companies like CCECC the ability to access Zambian goods and commodities, as well as to transport them to Dar es Salaam for further export. From 2000 to 2012, Chinese financiers committed nearly $1.8 billion in loans and grants to support copper extraction at sites in Zambia such as the Chambishi mine, the Lumwana copper mine, and the Muliashi copper mine (Walsh et. al 2026).
The Chinese-financed Tazara railway project and pledges for the Dar es Salaam port illustrate a larger pattern: many of these ports serve dual or multiple purposes, especially as they grow more interconnected to mining sites, railway stations, and export terminals. This pattern is especially visible at Chinese-financed mining sites (Bonfatti and Poelhekke 2017; Dreher et al. 2022; Bluhm et al. 2025).
Figure 10. Colocation of Chinese-financed seaport and mining projects, 2000-2023

Notes: Mine locations are based on AidData’s Chinese Financing for Transition Minerals, Version 1.0 dataset. Only seaport projects with at least one mining site within 500KM are shown. Source: AidData’s CPORTS Dataset, Version 2.0.
In their Power Playbook report, AidData researchers tracked nearly $60 billion of lending and grant-giving from Chinese official sector institutions for critical mineral operations in developing countries (Escobar et al. 2025). A newly released version of AidData’s Chinese Financing for Transition Minerals Dataset (CFTM 2.0) covers both developed and developing countries, capturing nearly $100 billion (in 2023 U.S. dollars) in financial commitments from 53 official sector institutions for the extraction and processing of 31 critical minerals across 47 developed and developing countries (Walsh et al. 2026).
Using geolocated data from the CPORTS 2.0 dataset and the CFTM 2.0 dataset, this study identifies seven seaports that have a Chinese-financed mine within a radius of 250 kilometers: Kisumu Port, Chancay Port, Guyana National Industrial Company Inc. Port, Port of Guayaquil, Posorja Port, Puerto Bolivar, and Puerto Aniquoia. Most of these sites are clustered either in the Latin American countries of Peru, Colombia, Ecuador, and Guyana, with the exception of Kisumu Port in Kenya. As outlined in Table 7, these seaports are located geographically close to mines (for example, the Port of Chancay has two mining sites within 250 kilometers: the Toromocho Copper Mine and the Raura Mine). Meanwhile, the Kisumu Port project is a pledge by China Eximbank to potentially finance the construction of a modern port facility in Kenya, within 135 kilometers of the Sukulu Phosphate Comprehensive Industrial Development Project—which the Industrial and Commercial Bank of China supported with over $250 million for the construction of rare earth and niobium facilities.[20]
Table 7. Examples of co-located Chinese-financed seaports and mines
Seaport |
Chinese financing for port |
Mining site(s) |
Approximate distance |
Chinese financing for mine(s) |
Mineral(s) |
Port of Chancay |
$631 M |
Toromocho Copper Mine, Raura Mine, and Antamina Mine |
227KM, 193KM, and 336KM |
$6.4 B |
Copper, zinc, lead, silver |
Kisumu Port (pledged) |
$144.8 M |
Sukulu Phosphate Comprehensive Industrial Development Project |
135KM |
$251 M |
Rare earth, niobium |
Puerto Antioquia |
$45.9 M |
Buriticá Gold Mine |
162KM |
$440 M |
Gold |
If the radius is expanded to 500 kilometers, an additional 11 unique ports are located within that proximity of a Chinese-financed mining site: the Port of Newcastle (Australia), Gwadar Port (Pakistan), Kyaukyphyu Deepwater Port (Myanmar), Port of Buenaventura (Colombia), Port of Chittagong (Bangladesh), Beira Fishing Port (Mozambique), Sonadia Deep-Sea Port (Bangladesh), Port of Spain (Trinidad and Tobago), Port Sudan (Sudan), Port of Durres (Albania), and the Port of Hodeidah (Yemen). In total, this study identifies 19 Chinese-financed mining sites within 500 kilometers of a Chinese-financed seaport captured in the CPORTS 2.0 dataset.
While some of these Chinese-financed mines are physically proximate to Chinese-financed seaports by pure chance, others represent “growth corridors” that facilitate the export of minerals via seaports and railways (Bonfatti and Poelhekke 2017; Bunte et al. 2018). These hubs of connectivity require both money and time to build, and they are often constructed gradually over years. Chapter 8 delves further into port investments that are either pledged or otherwise fall outside the scope of the CPORTS 2.0 dataset—notably, nearly all of these projects envision linking ports investments with the extraction, processing, and export of critical minerals, heavy metals, or energy commodities like liquified natural gas.
4.3 A case study for China’s new approach: Linking Brazil and Peru
Latin America and the Caribbean has become a major focus of China’s international seaport financing portfolio in the 2020s. The Americas as a region (including Canada and the U.S.) accounted for only 10.8% of the portfolio between 2000 and 2025, but this figure increased to almost 30% between 2020 and 2025. However, seaports in Latin America and the Caribbean have become not only hubs of connectivity and growth but also vulnerability: recent U.S. strikes in Venezuela hit La Guaira port, the country’s busiest port just north of Caracas (Berg 2026).
While significant attention has been focused on China’s exclusive operation of the Port of Chancay in Peru, a vastly ambitious effort to link the newly developed megaport north of Lima to a deepwater port in northeastern Brazil is noteworthy. In 2017, a Chinese consortium pledged financial support for the development of Porto Sul in Bahia, Brazil, part of an intermodal project that would involve the construction of a seaport north of the city of Ilhéus, as well as an iron mine (Pedra de Ferro) and the FIOL railway. Under the terms of a memorandum of understanding (MoU), a Chinese consortium—composed of China Railway Group, China Communications Construction Co., Ltd., and Dalian Huarui Heavy Industries Group—agreed in principle to mobilize approximately $2.4 billion to support the larger inter-modal project, of which Porto Sul will become a part.
Figure 11a. Site of the future Chancay Port in 2018, prior to development
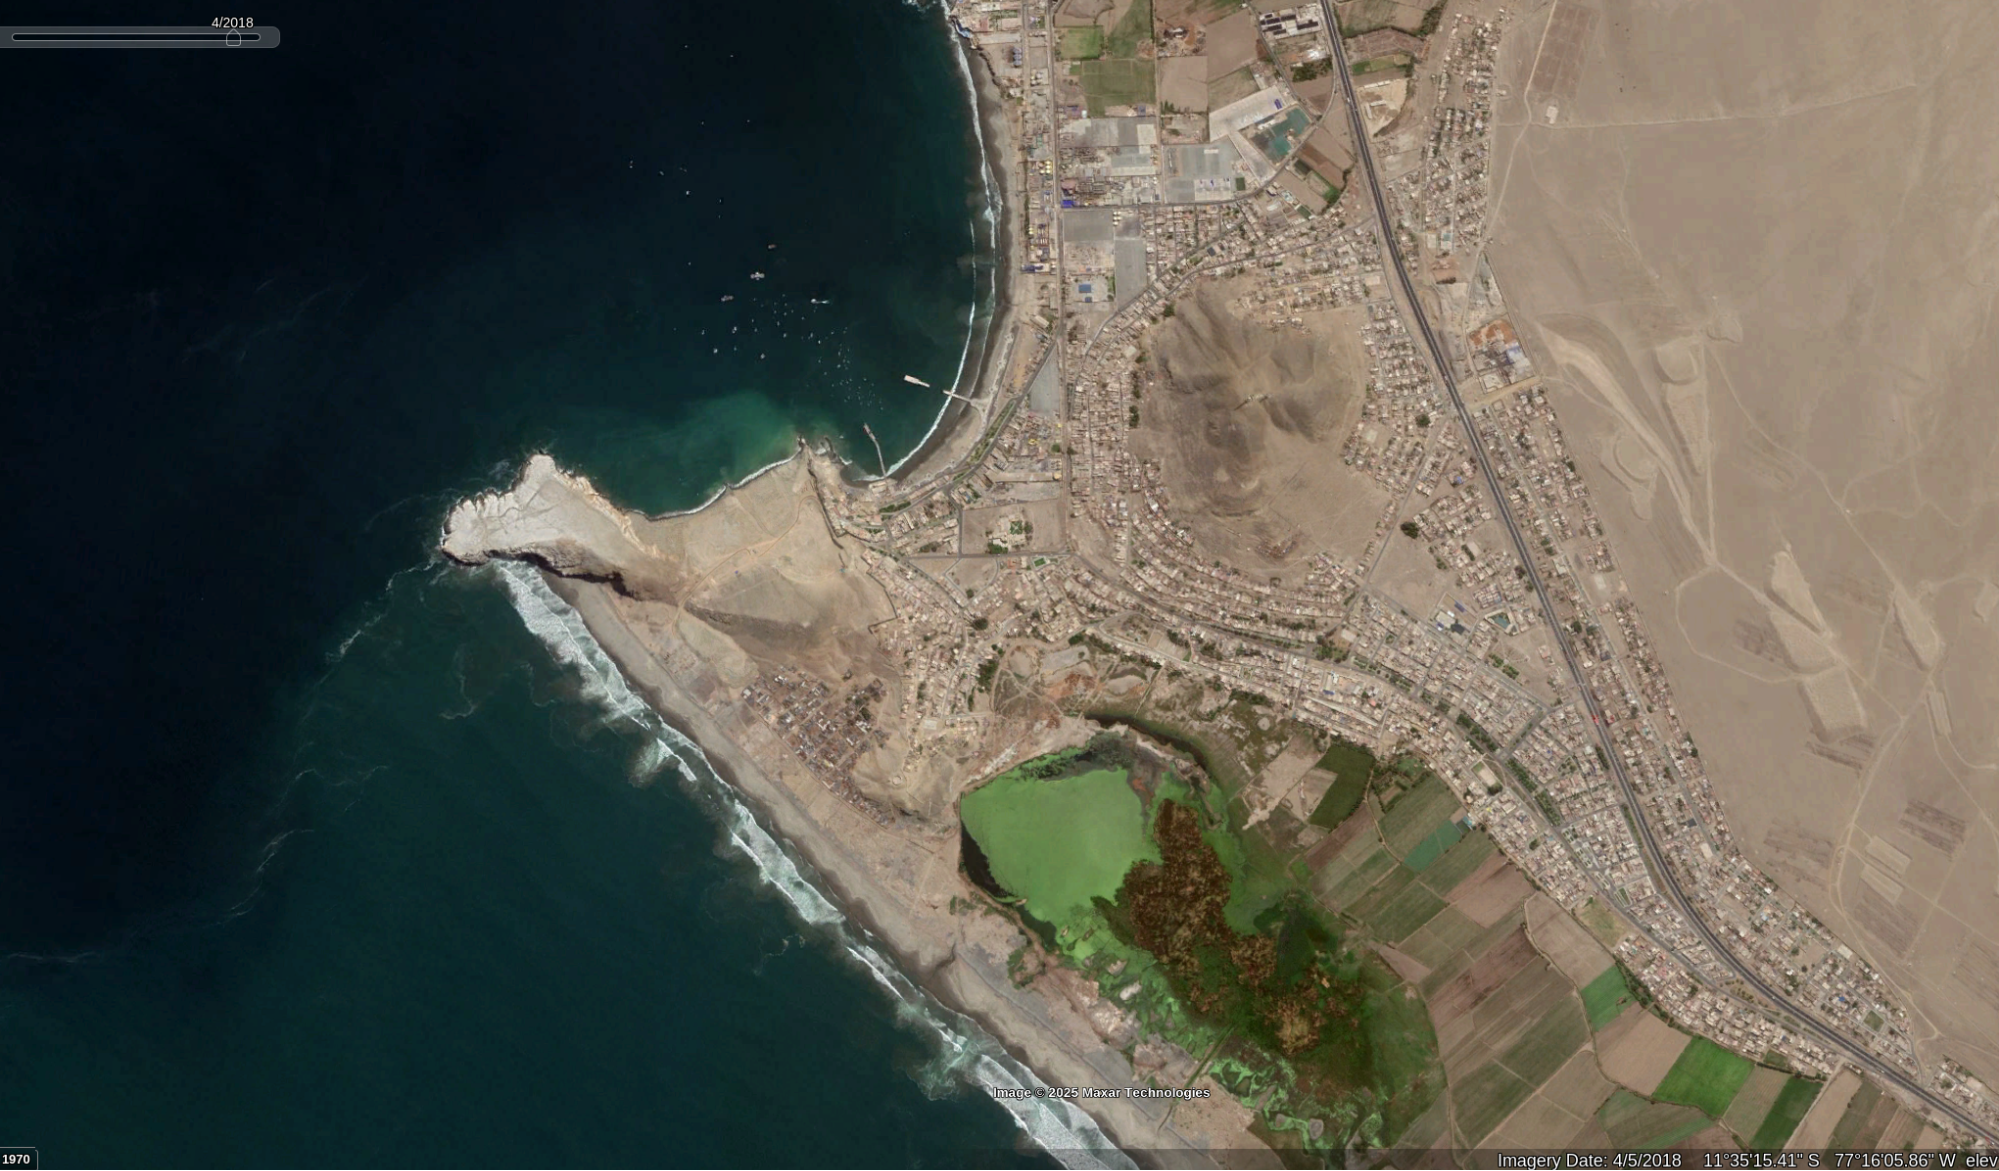
Figure 11b. Chancay Port in 2025, after opening in late 2024
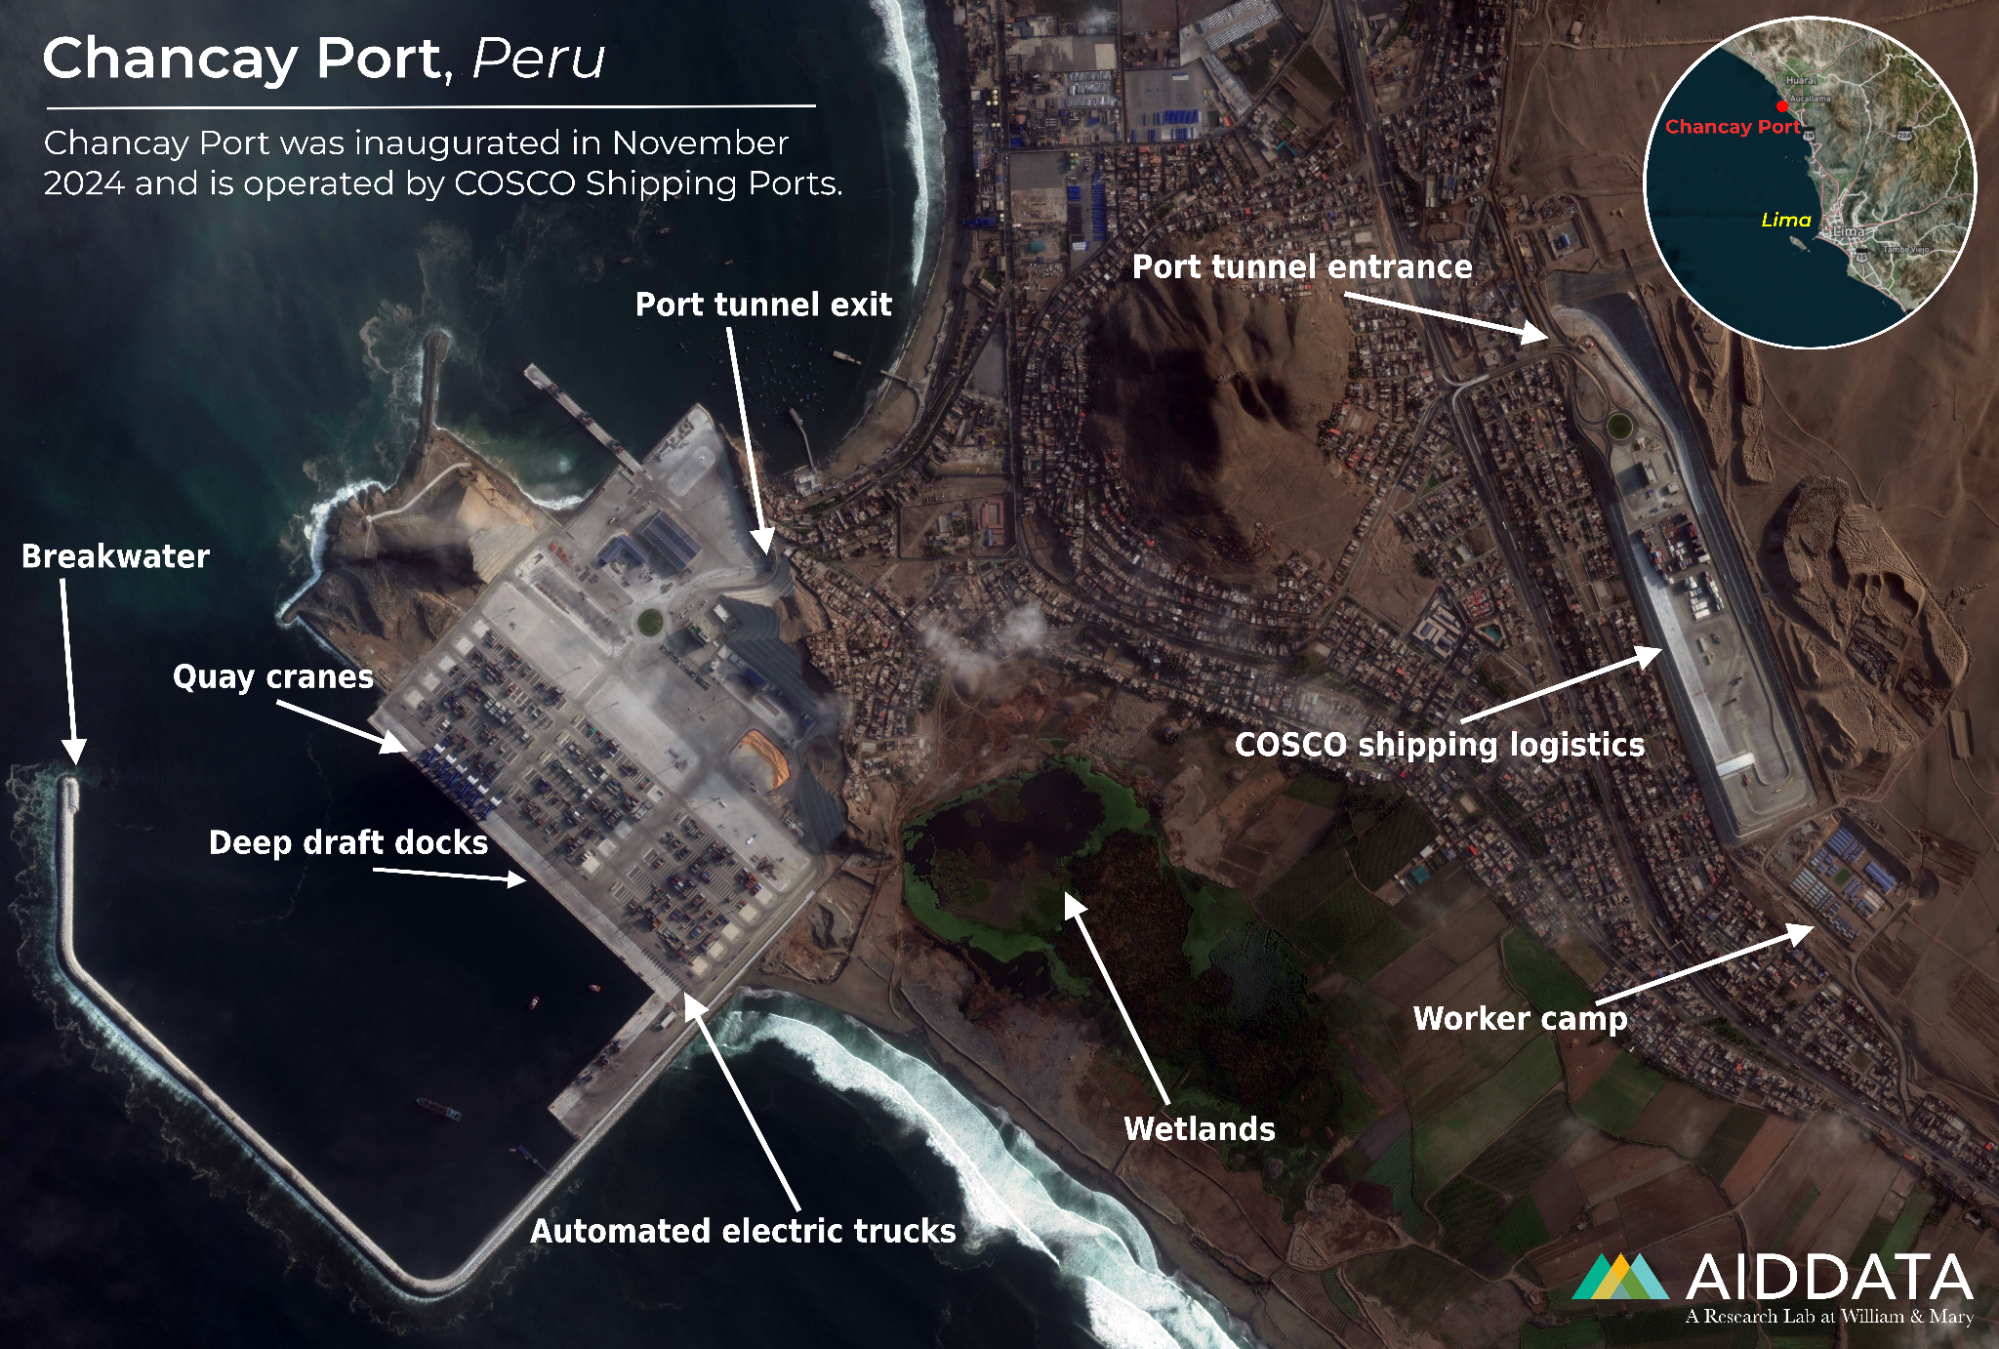
Sources: Imagery in Figures 11a and 11b by Vantor (2025 and 2026, respectively).
While no official sector financing or operator from China has been identified since then, new activities in 2025 confirm continuing Chinese interest in developing the port, as well as linking it with Peru via railway (Hanbury 2025). In addition to exploring three potential railway corridors in Peru (Lima-Barranca, Lima-Ica, and Pucallpa-Chancay), China has also turned towards building a regional bi-oceanic transportation corridor (Chancay Observatory 2026: 38). In July 2025, China and Brazil signed an MoU to conduct a feasibility study of the construction of a railway from Ilheus to Chancay port (Zhao 2025).[21] If the West-East Integration (FIOL) railway came to fruition, it would require an investment worth as much as $50 billion. A subsidiary of China Railway and Engineering Cooperation, CREC-10, and Sinosteel are already working on one part of the railway, FIOL 1 (Eurasian Resources Group 2023).
Figure 12. The Brazil-Peru Bioceanic Corridor and Porto Sul construction plans
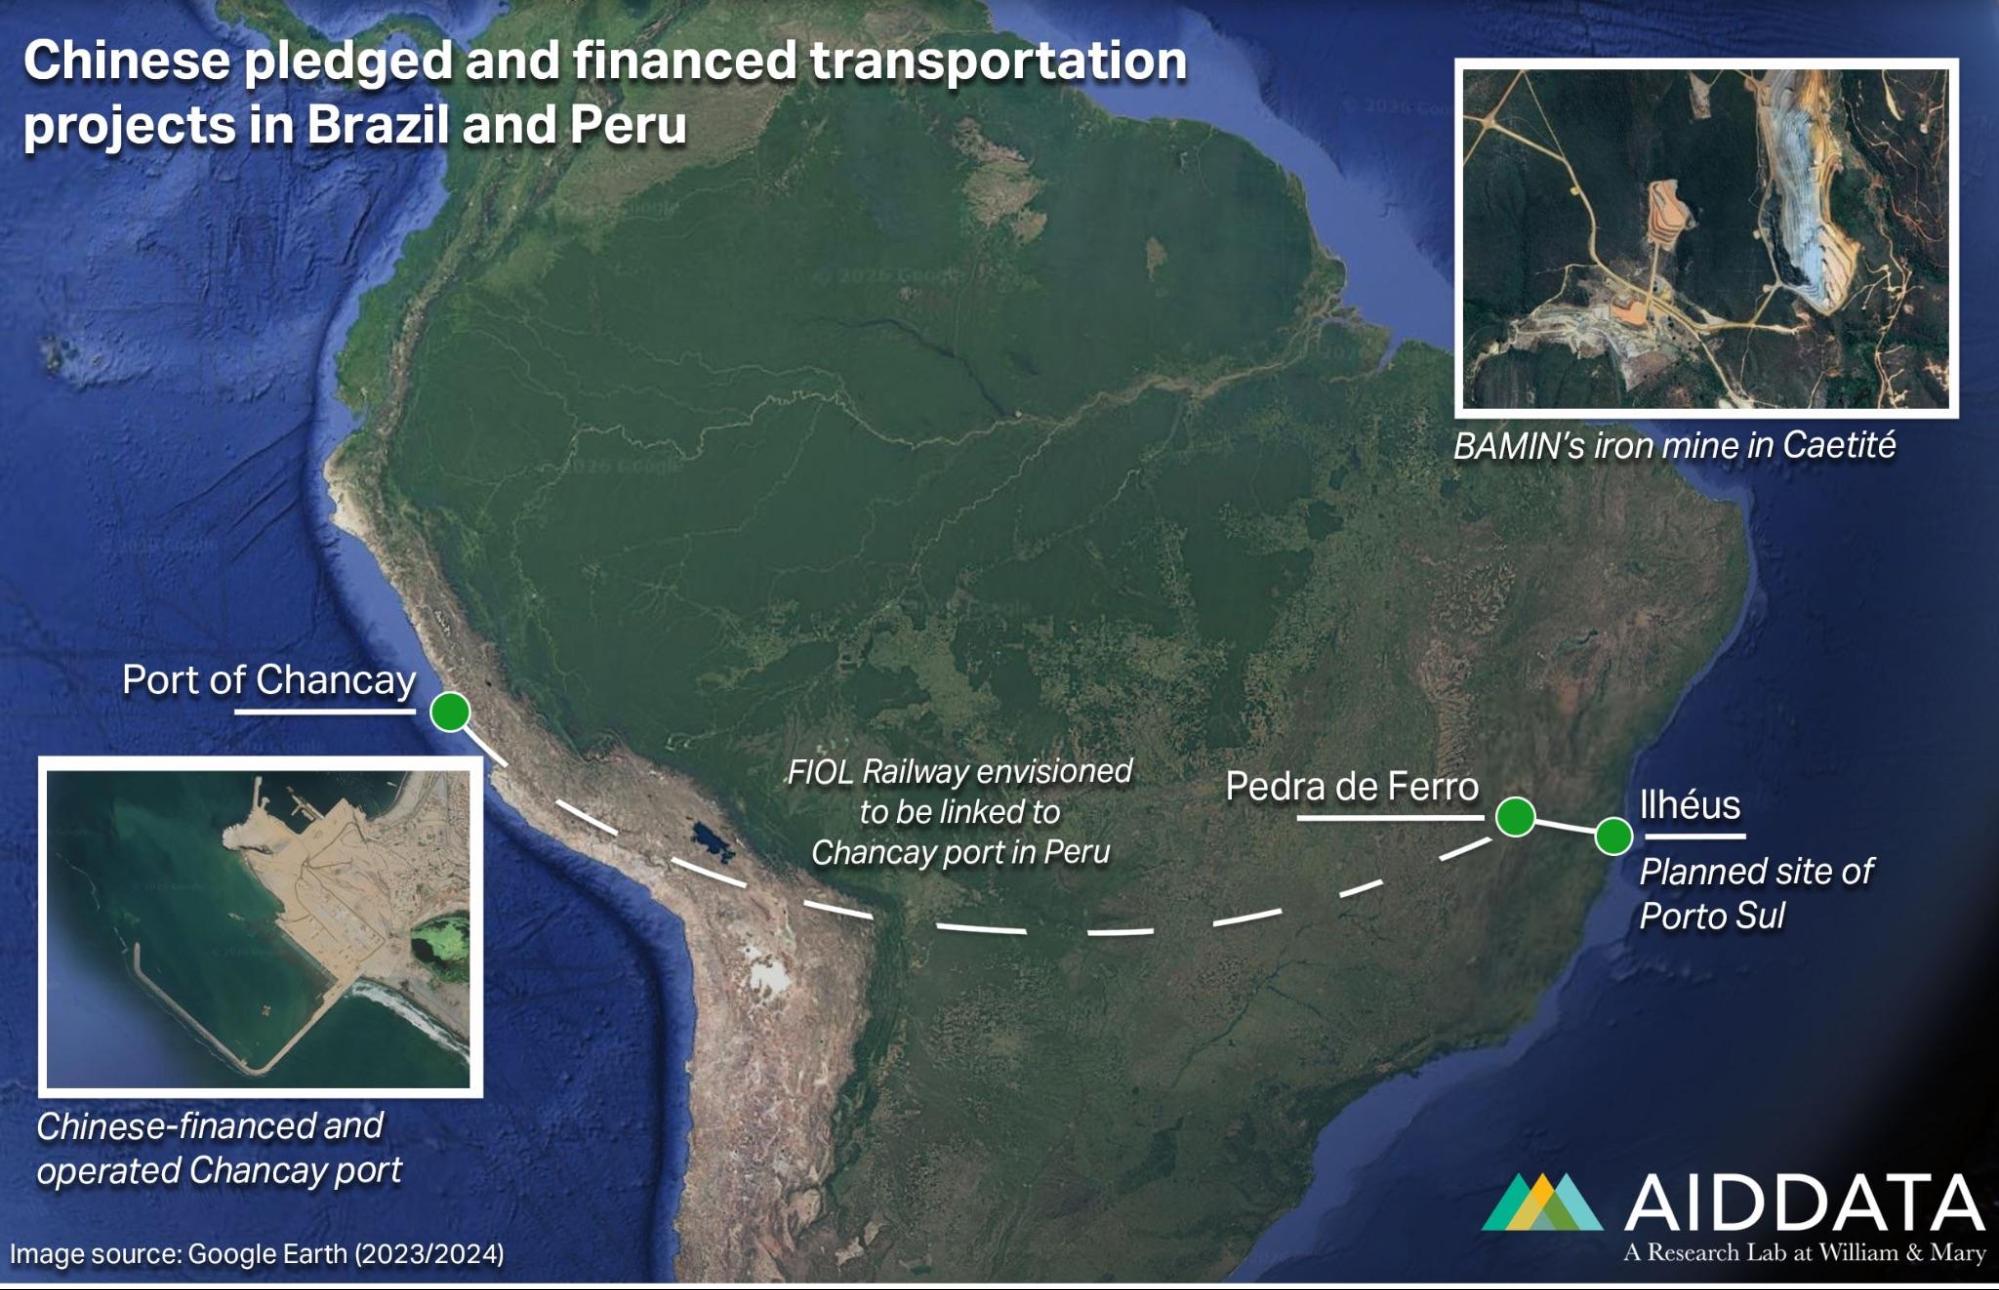
Note: This map is for visualization purposes only and does not provide precise geolocation information. Source: Imagery by Google Earth (2023, 2024).
Brazil has become an important hub of Chinese seaport-related investments: Chinese financiers committed almost $505 million in financing to seaport projects in the country between 2009 and 2023. China has cultivated a close relationship with Brazil to increase its access to natural resources—mostly soybeans, but also at Porto Sul to access the iron mine Pedra de Ferro.
Brazil overtook the U.S. as the largest exporter of soybeans in 2018, when trade tensions and tariffs cooled the U.S.-China relationship. China uses soybeans for human consumption and livestock feed. In 2018, China Merchants Port Holdings Company Limited and Kong Rise Development Limited (a subsidiary of CMP) acquired a 90% stake in Terminal de Contêineres de Paranaguá (TCP), one of the largest ports in Brazil, in order to export this critical commodity. Similarly, the Chinese state-owned enterprise COFCO announced plans to open its “largest export port terminal” at the Port of Santos in Brazil in 2025, an investment worth $285 million (Forum Macao, 2025; Thome and Kennedy 2026: 31).
China’s increasing presence in and access to South America—especially in Brazil and, since November 2024, at the Port of Chancay in Peru—allow China to secure these critical supply chains and enhance its own security standing. While it yet remains to be seen whether this envisioned bi-oceanic corridor will ultimately come into existence, developments should be closely monitored.
Case study: Port of Morébaya, Guinea
On December 3, 2025, the first shipment of iron ore extracted from the Simandou mine was loaded at the Port of Morébaya and dispatched to China. Simandou is recognized as one of the world’s largest and highest-grade iron ore deposits. This operational milestone marked a major step in the development of the Simandou Project, a multi-billion-dollar undertaking intended to reshape global iron ore supply chains.
The total expected cost of the Simandou Project is estimated at approximately $24.5 billion, financed through a mix of debt and equity. Infrastructure development constitutes the largest share of expenditures, with the co-developed rail and port system—including the Simfer Spur Line, the Main Rail Line, and the joint port facilities at Morébaya—estimated at $12.3 billion (AidData 2025).
The mining component is divided between two complexes. The Simandou South complex (Blocks 3 and 4), operated by Simfer S.A., carries an estimated cost of $4.6 billion. The total cost of the Simandou North complex (Blocks 1 and 2), operated by Winning Consortium Simandou S.A.U., has not been publicly disclosed.
To support development of Blocks 3 and 4 and associated infrastructure, six Chinese financiers, including China Eximbank, CDB, Bank of China, ICBC, China Construction Bank, and Agricultural Bank of China (ABC), extended a $3.26 billion syndicated loan with a 15-year maturity in February 2025.
Taken together, the Simandou Project illustrates a comprehensive Chinese “resource independence” strategy in action. China remains structurally dependent on imported iron ore—a critical input for industrial production, infrastructure construction, and defense-related manufacturing. Simandou has therefore emerged as a flagship project demonstrating how Chinese state-owned entities finance and build entire infrastructure ecosystems around strategic resource sites: including mine access, processing facilities, support complexes, long-distance railways, and specialized export ports.
This case also overlaps geographically with the broader Gulf of Guinea, identified in Wooley et al. (2023) as a priority region for extensive Chinese investments in seaports and maritime-related infrastructure, and one which has largely been overlooked by Western policymakers and analysts. Simandou and the Port of Morébaya represent therefore not only a significant resource security initiative, but also a key extension of China’s expanding infrastructure footprint across West Africa.
5. Implications of Chinese naval developments
By Sheng Zhang and Sarina Patterson
Seaports, port facilities, and their associated infrastructure are critical to the operational reach of the People’s Liberation Army Navy (PLAN). Yet it is equally important to examine the PLAN’s evolving platforms and weapon systems. New platforms and weapon systems are reshaping the navy’s force structure and operational concepts, and therefore materially affect naval basing, port requirements, and maritime posture.
This focus is necessary because ports, facilities, and associated equipment are closely correlated with the PLAN’s evolving capabilities. On the one hand, the PLAN will rely on these facilities to support future operations aimed at protecting China’s overseas interests. On the other hand, such ports and facilities are likely to be designed, constructed, and upgraded in ways that maximize their utility for PLAN platforms and operational needs. The PLAN’s modernization trajectory differs in important respects from that of Western navies, and these differences are reflected in how China is approaching overseas basing, port design, and logistical support. Understanding this distinctive development path is therefore critically important for explaining why specific ports, facilities, and equipment hold particular strategic importance.
The following analysis is informed by Chinese official and state-affiliated sources, including PLAN announcements; state-owned media coverage of equipment developments; and interviews with PLAN officers conducted by Chinese government-linked think tanks, with findings cross-checked against reputable English-language naval and defense reporting. A key conclusion is that the PLAN is building a modern navy with high-tech weapon systems and varying usages of destroyers, frigates, and especially landing helicopter docks (LHDs), amphibious assault ships that can operate both as a helicopter carrier and as a landing ship that can transport and launch landing craft. Beyond having the world’s largest number of naval ships, the PLAN is evolving into a modern, high‑tech navy. This transformation emphasizes advanced weapons, power‑dense platforms including lasers and microwaves, and a different employment concept for surface combatants and amphibious/shipborne aviation—in particular, the growing role of LHDs as unmanned aerial vehicles (UAVs) and unmanned system hubs.
An earlier study, Harboring Global Ambitions, summarized the PLAN’s development since 1949 and reviewed pivotal incidents that shaped PLAN doctrine and procurement priorities (for example, the Yinhe incident in 1993 and the Taiwan Strait Crises in 1954-55 and 1958) (Wooley et al. 2023). Those incidents pushed the PLAN toward modernization and an emphasis on force projection and anti-access/area denial (A2/AD) capabilities.
 Liu Huaqing, then-deputy
chief of staff of China’s Joint Staff Department of the Central
Military Commission, on board a United States aircraft carrier in 1980.
Photo by Ron Wood via the NARA & DVIDS Public Domain Archive of the
U.S. National Archives and Defense Visual Information Distribution
Service, in the public domain.
Liu Huaqing, then-deputy
chief of staff of China’s Joint Staff Department of the Central
Military Commission, on board a United States aircraft carrier in 1980.
Photo by Ron Wood via the NARA & DVIDS Public Domain Archive of the
U.S. National Archives and Defense Visual Information Distribution
Service, in the public domain.
One other key event triggered profound long-term effects in the PLAN’s development. In 1980, then-deputy chief of staff of the Joint Staff Department of the Central Military Commission, Liu Huaqing, visited the United States and saw the USS Kitty Hawk CV-63 and USS Ranger CV/CVA-61 (CPPCC 2020). A famous photograph (above) marked his visit. What is less known is that, two years later, he was appointed as commander-in-chief of the PLAN and authored a “Navy Ocean Plan Blueprint” that set the following long‑term goals. First, by 2010, the PLAN should establish command of the sea within the first island chain, which connects Japan, Taiwan, and the Philippines and sits within waters (including the South China Sea) claimed by China. Then, by 2020, the PLAN should secure command of the sea within the second island chain, which runs south from Japan’s Bonin and Volcano Islands through the Mariana Islands (including Guam, an American territory with a heavily fortified military base) and the western Caroline Islands down to Western New Guinea in Indonesia. Finally, by 2040, China should make sure to contain U.S. naval dominance in the Pacific and Indian Oceans.
Current Chinese shipbuilding and systems development—which in some areas now outpaces the U.S.—demonstrates the active pursuit of these objectives that were set out some four decades ago:
- Aircraft carriers and carrier aviation. As of 2025, the PLAN operates three aircraft carriers, with Fujian (18) coming into active service in Hainan in November 2025 (Luck 2025). Fujian’s electromagnetic catapult system has demonstrated the capability to launch larger fixed‑wing aircraft at maximum take off weight, such as the airborne early warning (AEW) platform (KJ‑600) that provides long-range radar detection to carrier strike groups, the J‑15 platform (J‑15T/J‑15DT), and the J-35—the only fifth-generation stealth fighters to be launched by electromagnetic catapult so far in the world (Liu 2025).
- Directed energy and unmanned systems. The PLA displayed multiple naval systems in a military parade on September 3, 2025 (commemorating “The 80th Anniversary of the Victory of the Chinese People's War of Resistance Against Japanese Aggression and the World Anti-Fascist War”). These included laser/microwave weapons, missiles, torpedoes, unmanned surface vessels (USVs), and unmanned underwater vehicles (UUVs). Reports indicate a Type 071 landing platform dock (LPD), an amphibious warfare ship, was modified to carry a candidate laser-based directed-energy weapon (DEW), which uses highly-focused energy to damage targets without using solid projectiles (Luck 2024). Chinese media later reported testing of a system aboard hull 986 (Yang, 2025); this system is believed to be the LY‑1 laser system revealed at the parade.
- Surface combatants and power demands. Modern radars that detect stealth aircraft, combat management systems, and directed-energy weapons have large electrical and cooling requirements. Deployment of these systems requires both high total and peak electrical power that legacy destroyers (fast, maneuverable, long-endurance warships that escort and defend larger vessels) were not designed to support. Older designs lack the robust electricity generation, storage, and distribution systems needed to handle rapid power spikes and retrofitting them risks overloading or paralyzing onboard systems. Large platforms like the Type 071 provide a flexible testbed for high-energy systems, allowing the PLAN to study power management and integration before deploying them on combatants. This explains why Type 055 stealth guided-missile destroyers and other Chinese legacy hulls have not adopted full high-power architectures and highlights the need for future designs to fundamentally rethink internal layout and energy systems (including Type 052D upgrades, Type 055 destroyers with multiple hulls in service/under construction, and new Type 054B frigates) (Liu and Liang 2025).
- LHD‑focused force design. The PLAN operates multiple Type 075 landing helicopter docks (LHDs) with full‑length flight decks and is testing a Type 076 LHD reportedly equipped with electromagnetic (EM) catapults. LHDs are being treated not only as amphibious-capable ships but also as distributed aviation and unmanned‑systems hubs—ideal for launching unmanned air, surface, and underwater vehicles that support airspace control, anti-submarine warfare (ASW), and sustained unmanned undersea operations.
- Complementary carrier-LHD employment. Large Chinese carriers (e.g., Fujian and the new carrier under construction) appear optimized to carry manned fighters, while LHDs provide deck space and electrical capacity for unmanned aerial vehicles (UAVs) and larger unmanned systems. This division of labor improves deck management and enables carriers to host a greater complement of strike fighters. Reported concepts suggest manned fighters (and airborne early warning assets) would coordinate with “loyal wingman” UAVs (reported with J-20s) and shipborne unmanned systems for integrated sensor‑to‑shooter operations (Du 2025).
- Subsurface SSNs (nuclear-powered attack submarines) and SSBNs (nuclear-powered ballistic missile submarines). The PLAN continues to prioritize its nuclear-powered submarine force as a core component of strategic deterrence and undersea warfare, while maintaining strict secrecy regarding the force size, basing patterns, and platform configurations for both its nuclear- and conventionally-powered submarines. Open-source estimates vary, but assessments indicate a growing fleet of SSNs and SSBNs with enhanced stealth, endurance, and command-and-control integration (Nuclear Threat Initiative 2025). Notable public indicators emerged during the September 3, 2025 military parade, where the JL-3 submarine-launched ballistic missile (NATO reporting name: CSS-NX-20) was officially revealed. According to PLA-affiliated reporting, the JL-3 has an estimated range of approximately 10,000 km, enabling SSBNs operating within or near the first island chain to put most potential adversaries, including the continental United States, within their range (Fan and Liu 2025). Similarly, the YJ-19, revealed at the same time, is a hypersonic anti-ship cruise missile that is believed to be powered by an air-breathing scramjet engine and assessed to be deployable from standard 533-mm torpedo tubes. This system could technically provide PLAN submarines with a credible long-range anti-surface strike capability and pose a significant challenge to competitors’ large surface platforms, including of the U.S., due to its speed and limited interceptability.
A fundamental distinction between the PLAN and Western naval development lies in platform philosophy. While Western navies, including the U.S. Navy and European fleets, have pursued multipurpose ship designs such as FREMM (a Franco-Italian family of warships) and the canceled Constellation-class (LaGrone 2025), the PLAN continues to favor a “high-low” mix of specialized vessels, each optimized for a narrower range of missions. The PLAN does not build newer, more capable ships (e.g., the Type 055) to replace the roles of smaller platforms (e.g., the Type 054A or Type 052D). Instead, larger platforms are assigned higher-end, offense-centric missions, particularly anti-access/area denial (A2/AD) and long-range strikes, while smaller combatants continue in supporting roles, performing anti-submarine, anti-aircraft, and anti-missile functions for the fleet. This situation is analogous to the U.S. Navy’s force structure since World War II. However, following the U.S.’s decommissioning of the final Oliver Hazard Perry–class frigates in 2015, the Arleigh Burke–class destroyers assumed additional fleet responsibilities, including missions traditionally performed by frigates (Foggo 2023).
In a potential near-term force employment model, a single PLAN aircraft carrier could operate in conjunction with one or two landing helicopter decks (LHDs), creating a distributed task force with manned fighters from the carrier, unmanned air, surface, and underwater vehicles (from the LHDs), and additional strike or anti-submarine warfare capabilities. This carrier-LHD pairing could present a credible localized challenge to foreign naval presence and operations, especially within the first and second island chains. While the United States retains a clear experiential advantage in composite naval task force operations, the PLAN remains comparatively new to complex multi-capital-ship formations that integrate fixed-wing carrier aviation, amphibious aviation, and unmanned systems. Its experimentation with pairing an aircraft carrier and one or more LHDs therefore reflects active doctrinal development rather than a fully mature operational construct. However, the PLAN’s newer platforms, modernized shipbuilding capacity, and early integration of unmanned and long-range precision strike systems point to a potentially higher long-term operational ceiling. Near-term effectiveness, though, is likely to remain constrained by ongoing doctrinal refinement, command-and-control integration challenges, and especially logistical learning curves.
This evolving force structure—characterized by rapid commissioning of LHDs, specialization over multipurpose design, and integration of power-intensive systems—underscores that the present and future PLAN has fundamentally different needs for port infrastructure and regional basing. Power-dense systems (radars, directed-energy weapons, electromagnetic catapults, and unmanned system support facilities) significantly increase the logistical and electrical demands of both home ports and forward bases. As Omar Bradley, the U.S. General of the Army following WWII, is said to have once remarked, “professionals talk logistics.” Ports would need appropriately-sized berths (with sufficient pier length and depth of water) but also the shoreside power, water, fuel and other supplies to support these high-demand platforms, ensure massive and resilient sources of electric power for thermal management systems, and provide maintenance infrastructure.
At the high end, ports featuring hardened deep-water berths, industrial-scale repair facilities, and substantial electrical generation capacity are best suited to support aircraft carriers, especially the EMALS-equipped platform. With extended range of AEWs and fifth-gen fighters at maximum take off weight, their extended combat radius and payload capacity enhance the feasibility of sustained deployments and the establishment of localized air defense “bubbles” in distant theaters.
By contrast, LHDs suggests a complementary medium-access port model. Aviation- and unmanned-system–configured LHDs are less dependent on heavy industrial infrastructure than aircraft carriers. When paired with medium-sized dual-use commercial ports possessing adequate fuel storage, logistics throughput, secure communications architecture, and modular maintenance space, LHDs could sustain distributed UAV, USV, and UUV operations. In this construct, the port functions less as a carrier-style sustainment hub and more as a drone operations, maintenance, and data-processing center. Such pairings could enable 24-hour ISR (Intelligence, Surveillance, and Reconnaissance) coverage, maritime domain awareness, ASW screening, or selective interdiction operations, especially in gray-zone contingencies where persistent presence is prioritized over overt force concentration.
An additional consideration is ownership and operational control. The ports and facilities mentioned in other chapters of this report may provide distinct tactical advantages in logistics coordination, berthing prioritization, docking flexibility, customs facilitation, security control, and discreet resupply arrangements. Even absent formal basing agreements, such administrative and commercial leverage could compress turnaround times, enhance operational security, and provide greater elasticity in sustaining deployed forces. It is important to emphasize that such arrangements fall fully within the legitimate prerogatives of commercial port operators. The observation here is not intended to question the legality and legitimacy of these activities, but rather to acknowledge the practical operational efficiencies and strategic implications that can arise from ownership structures and operational control of these critical facilities. Collectively, these technical and administrative enablers would allow an evolving fleet structure to tailor its operational footprint across multiple tiers of access. This tiered logistics architecture would maximize operational reach in support of China’s overseas interests at varying levels of priority—including critical mineral supply chains, infrastructure investments, and deployed personnel—while ensuring platforms remain on station longer and farther from the Chinese mainland.
6. China’s naval activity at global seaports
By Lea Thome, Seth Goodman, and Sarina Patterson
This report extends an earlier study, Harboring Global Ambitions, which analyzed China’s seaport financing commitments to low- and middle-income countries, as well as the possibility that those lending and grant-giving relationships could facilitate an eventual military presence at these ports (Wooley et al. 2023). Based on overall levels of Chinese state-directed financing, as well as other country characteristics, Harboring Global Ambitions identified eight locations where the PLAN might seek to locate a future overseas naval base: Hambantota, Bata, Gwadar, Kribi, Ream, Vanuatu, Nacala, and Nouakchott.
6.1 Chinese overseas basing and military installations
Although China significantly expanded and upgraded the Royal Cambodian Navy base in Ream and has since opened a joint logistics and training center at the facility, no further overseas bases have been announced. However, this should not be taken as evidence that the PLA will entirely abandon establishing further military bases overseas. Instead, Beijing has shifted its financing strategy and approach, in part to negate pushback from the U.S. and its allies and to prioritize these strategic hubs of connectivity, and to accommodate host government hedging—as it weighs the costs associated with establishing future military access.[22]
Following the opening of its People’s Liberation Army Support Base in Djibouti in July 2017, reports emerged that China had approached multiple potential host countries for basing access. This included a security agreement, kept secret until leaked, that included basing rights discussions with the Solomon Islands government in 2022; construction at the Cambodian Royal Navy’s Ream Naval Base; and reported military facility construction at the Khalifa Port in the United Arab Emirates in the early 2020s.
News outlets reported that then-President Biden was briefed in 2023 on Chinese efforts to build a base in Oman. Furthermore, the U.S. was also reported to offer economic and development assistance to Gabon, where China was purportedly seeking basing access with the now fallen-out-of-favor President Ali Bongo. Similarly, Diario Rombe—a digital news platform—reported in 2023 that plans for China to construct a military base in neighbouring Equatorial Guinea had already begun as early as 2016 in conjunction with a large loan from NORINCO (a Chinese state-owned defense manufacturer) for the acquisition of military equipment and supplies (Diario Rombe 2024).[23]
While Cambodian officials initially also confirmed that China would have access to the naval base in Ream, officials later walked back these claims in 2024. When the newly-extended base opened in April 2025, Japanese warships were the first foreign ships to dock at the base—with plans of U.S. naval ships docking later in 2025, with U.S. Secretary of Defense Pete Hegseth also announcing plans to visit the ships while in port; however, this visit ultimately only took place in January 2026, without a visit by Secretary Hegseth.
These activities align with other U.S. assessments, including by the RAND Corporation in June 2024 that “Chinese military writings suggest that the PLA has neither the intent nor the capability to use overseas military bases to launch preemptive attacks or other offensive operations on U.S. forces or interests through at least 2030” (Wang and Beauchamp‑Mustafaga 2024). Similarly, Kardon and Leutert (2022: 39) conclude that “Chinese naval forces already employ PRC firms’ port network abroad to project military power without the more costly and visible footprint of permanent bases.”
6.2 Quantifying Chinese naval activity at Chinese-financed seaports overseas
Figure 13. Chinese-financed ports with Chinese naval activity pre- or post-financing, 2000-2025

Notes: “Naval activity” includes Chinese naval port calls, research vessels, and hospital ship visits, as well as joint exercises at the port, as reported by government or state media sources. Ports are marked in red if they saw at least one naval activity during the period of study. Source: AidData’s CPORTS Dataset, Version 2.0.
The CPORTS 2.0 dataset helps quantify this forward-deployed presence of the PLAN (categorized here as “naval activity”) at port facilities financed by Beijing and offers insights into China’s dual-use approach to critical infrastructure investments. Nearly one-third of Chinese-financed overseas port projects (by commitment value) hosted at least one naval activity from China during the period of study (2000-2025). For the purpose of this report, “naval activity” encompasses port calls and dockings by Chinese military and PLAN-affiliated entities, such as military visits to foreign ports for maintenance, diplomatic exchanges, and humanitarian projects; medical ship visits to ports for humanitarian purposes and disaster relief; and joint military exercises, where the port was the home location of the exercise.[24]
A recent example of this implicit tie between Chinese port financing and Chinese naval activity overseas is the Port of Corinto in Nicaragua. In July 2025, China Iconic Technology Company Limited (CHINAICTC) issued two loan commitments worth over $128.2 million for Section A and Section B of the Julia Herrera de Pomares Logistics Center and Expansion Project.[25] This new project will offer services including container storage, customs inspection, refrigerated container areas, parking for heavy vehicles, and administrative offices for institutions such as the General Directorate of Customs and the Institute for Agricultural Protection and Health. Just four months later in November 2025, the Silk Road Ark made a port call at the Port of Corinto—marking the first time a Chinese military vessel had docked in Nicaragua.
Chinese naval activities have taken place at 31.2% of all ports projects captured in the CPORTS 2.0 dataset. If analysis is restricted to China’s financial commitments for port infrastructure—excluding financing that is solely earmarked for port equipment or working capital for ports—this figure rises to 38.7%. The presence of Chinese owners or operators at a port was associated with higher levels of Chinese naval activity during the period of study. Around 41.5% of Chinese-financed port projects focused on physical infrastructure with a Chinese owner or operator present had at least one prior naval activity. For Chinese-financed port facilities with Chinese owners, regardless of the presence of a Chinese operator, more than half of these seaports (52.3%) were host to this Chinese naval activity.[26]
Figure 14. Chinese financing by type for ports with Chinese naval activity pre- or post-financing, 2000-2025

Source: AidData’s CPORTS Dataset, Version 2.0.
This analysis therefore suggests that the higher the level of Chinese investment at a given port, the more likely it is to host some type of Chinese naval activity. Yet the estimates in Figure 14 above likely understate the nature of this relationship, as this analysis relies solely on official government announcements or state-owned media reports to identify instances of Chinese naval activity. “Naval activity” is also narrowly defined here to only include naval port calls, including hospital ship visits and physical dockings of vessels. Research vessel missions and blue sea exploration activities—unless directly conducted by the PLA or PLAN and docking at one of these ports—are excluded.
Without making any causal claims, evidence from case studies suggests that PLAN vessels often visit ports where China has an established presence. This does not, however, mean that Beijing is necessarily signaling an intent to militarize these ports. It could be the case that a prior Chinese presence, especially through ownership and equity stakes, makes it easier for the PLAN to secure port call approvals from partner government authorities.
Kardon and Leutert (2022: 9) also identify technical stops as a significant naval activity overseas, highlighting the example of the “Type-052C destroyer Xi’an [docking at] Egypt’s main port of Alexandria for a four-day technical stop,” where it “underwent specialized repairs at the large dry dock on site, loaded supplies, and equipment, and replenished its fuel and stores.” Such extensive servicing requires not only the physical capability of ports and terminals to accommodate large naval vessels, but also to supply them with the necessary materials, requiring the PLAN to establish service networks overseas (Kardon and Leutert 2022).
One of the most well-known examples of the connection between Chinese port investments and subsequent naval activity is the Port of Hambantota in Sri Lanka. In Harboring Global Ambitions, Wooley et al (2023: 20) noted that in 2017 “China Merchants Port Holdings Company Limited (CMPort) provided a $1.1 billion cash payment to Sri Lanka in exchange for an 85 percent ownership stake in its new port and the right to operate and develop it for 99 years.” Then, in 2019, China gifted Sri Lanka a frigate. In 2022, Chinese research vessel Yuan Wang 5 docked at the port, arousing significant international interest (Permanent Mission of the PRC to the UN 2022).
However, while much attention has been placed on Hambantota, most Chinese naval activity has actually taken place in Colombo, Sri Lanka’s capital. In 2011, CDB provided a $388 million loan to support the Colombo port expansion, leading to the construction of the new Colombo South Container Terminal. Also known as Colombo International Container Terminals (CICT) Co. Ltd., the new terminal project is a joint venture operated by China Merchants Ports and Sri Lanka’s port authority (China Merchants Ports Holdings Co., Ltd. n.d.). Following the investment, multiple naval activities took place at the port: the research vessel Shi Yan 6 docked in 2023; the Chinese hospital ship Peace Ark visited in 2024; and at least five other naval vessels docked between 2014, the year the new terminal commenced operations, and 2024 (Hiru News 2023; Ministry of National Defense 2024b).
A more recent example of Chinese naval activity following financing is the Port of Cotonou in Benin. In 2023, the Africa Growing Together Fund (AGTF), administered by the African Development Bank on behalf of the People’s Bank of China (PBOC), approved a $27.2 million loan to upgrade the Autonomous Port of Cotonou, including the construction of a new container terminal and the expansion of the port area to 20 hectares for bulk and miscellaneous cargo, as well as the creation of a central access point with automated gantries, a 14-hectare parking area for heavy-duty vehicles equipped with an integrated, digitized management system linked to the port’s database, and an integrated center for faster foreign trade and freight processing.[27] Just one year later, the Chinese hospital ship Peace Ark made its maiden visit to Benin, docking at the Port of Cotonou for a seven-day visit (Ministry of National Defense 2024a).
Yet naval activity does not always follow Chinese investments. For example, four state-owned Chinese banks contributed over one billion in a syndicated loan for the Bayport Terminal Concession Project in Israel in 2014. The loan supported Shanghai International Port Group’s (SIPG)’s concession of the Bayport Terminal at Haifa Port. However, two years prior in August 2012, three Chinese warships had docked at the Port of Haifa in Israel, marking the first time Chinese warships had visited Israel (Chen 2012). This visit may have presaged openness to further Chinese engagement, whether military or commercial, at Haifa.
6.3 Tracking Chinese hospital ship diplomacy
More subtle Chinese military outreach has continued, including increased overseas port visits by PLAN vessels. One example is “Mission Harmony,” a series of humanitarian deployments conducted by the PLAN since 2010. This hospital ship diplomacy conducted by the PLAN has been theoretized by Thome and Kennedy, in a separate study, to be part of China’s horizontal toolkit for acquiring larger maritime statecraft (Thome and Kennedy 2026: 22). In 2025 and 2026, as illustrated below in Figure 17, a new PLAN hospital ship, Silk Road Ark, visited a number of key ports in the South Pacific, Latin America, and the Caribbean.
But the places where Silk Road Ark did not dock are as interesting as where it did: the ship’s itinerary largely focused on ports in the Global South, including those that have secured official sector aid and credit from China—while bypassing entirely ports in Australia that also had seen significant Chinese investment. In one stop in early January 2026, the Silk Road Ark docked in Rio de Janeiro at the same time a U.S. research vessel was visiting the country, creating concerns about “China’s growing presence in a region traditionally perceived by Washington as part of its security sphere” (Guimarães 2026).[28]
Figure 15. PLAN hospital ship Silk Road Ark docked at the Port of Rio de Janeiro, Brazil on January 14, 2026
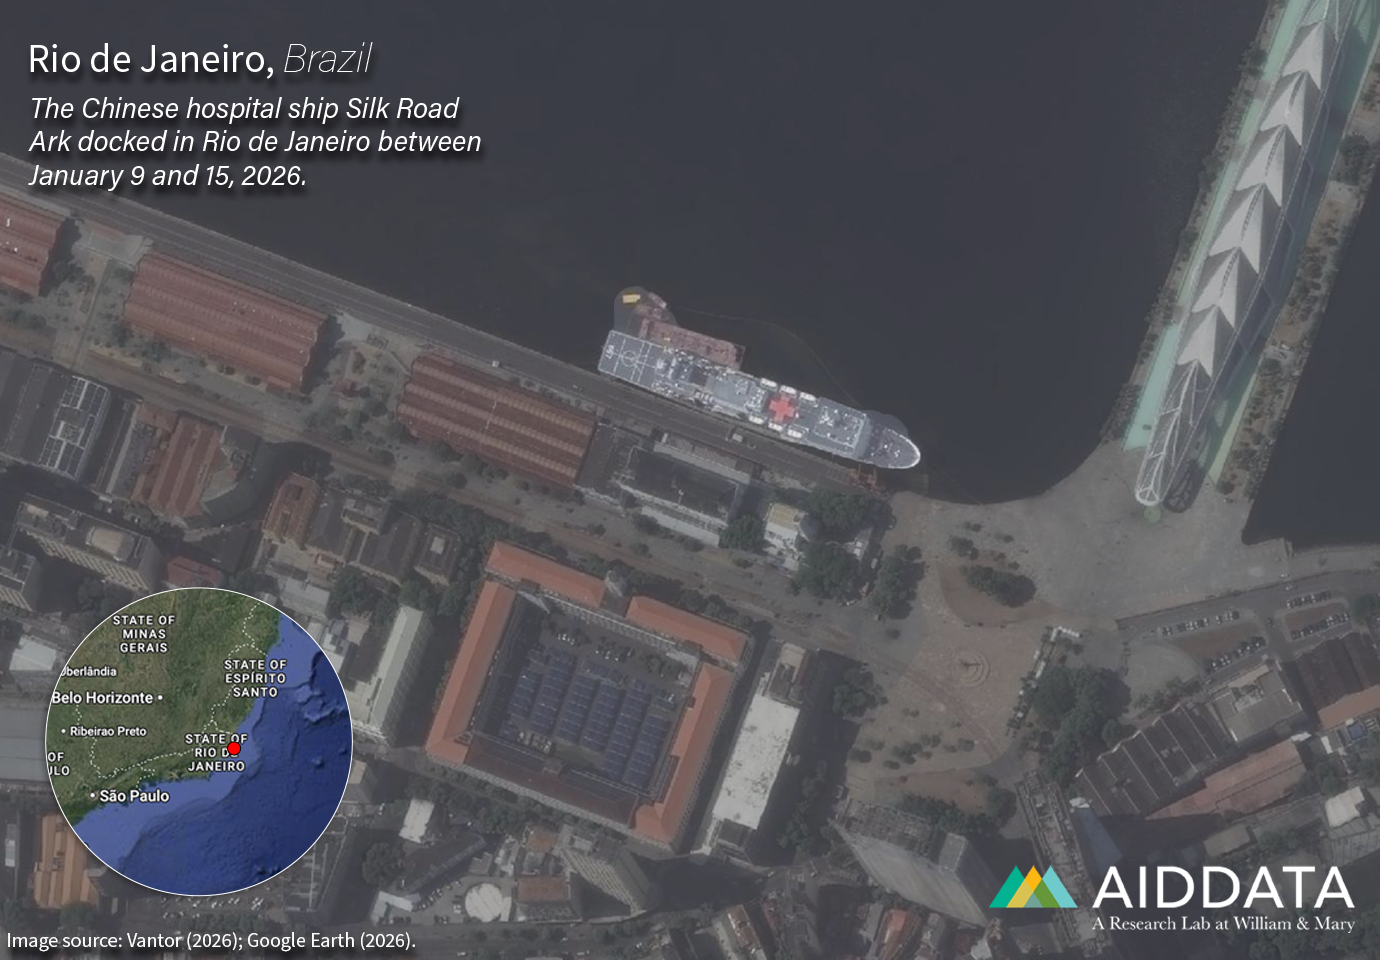
Sources: Imagery by Vantor and Google Earth, 2026.
Figure 16. PLAN hospital ship Silk Road Ark docked at the Port of Nuku'alofa, Tonga on October 13, 2025
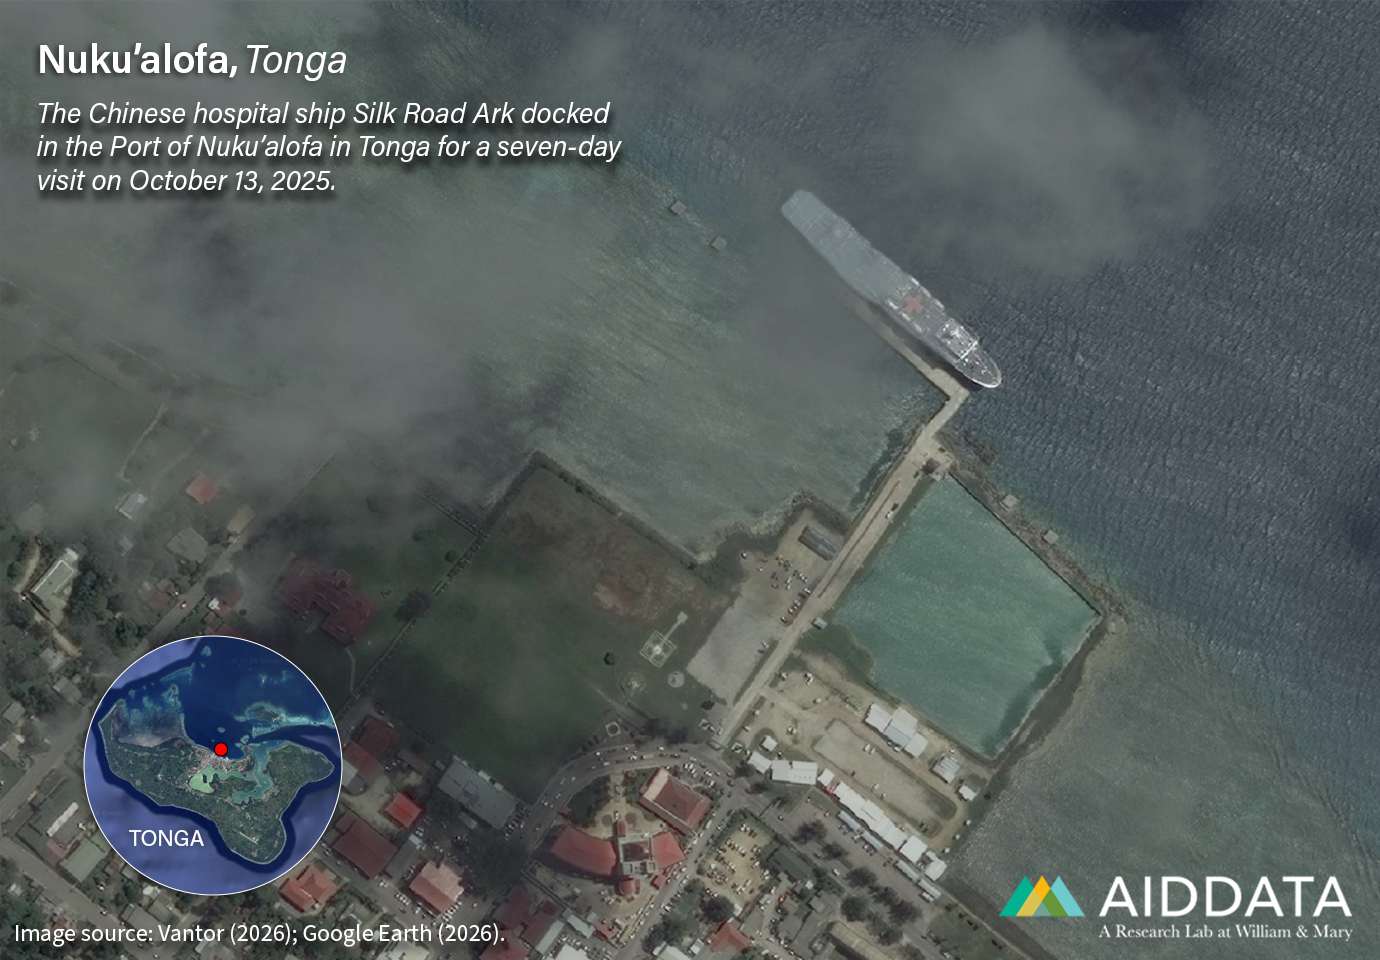
Sources: Imagery by Vantor and Google Earth, 2026.
The 2025-2026 iteration of Mission Harmony included stops in roughly a dozen countries. At the time of this report’s publication, additional stops are planned for Peru, although details have not been announced yet on which port the ship will dock (Ministry of National Defense 2025a). For Brazil, Peru, and Uruguay, this was or will be their first time hosting a Chinese hospital ship visit.
Figure 17. Current and potential stops of PLAN hospital ship Silk Road
Ark for Mission Harmony 2025
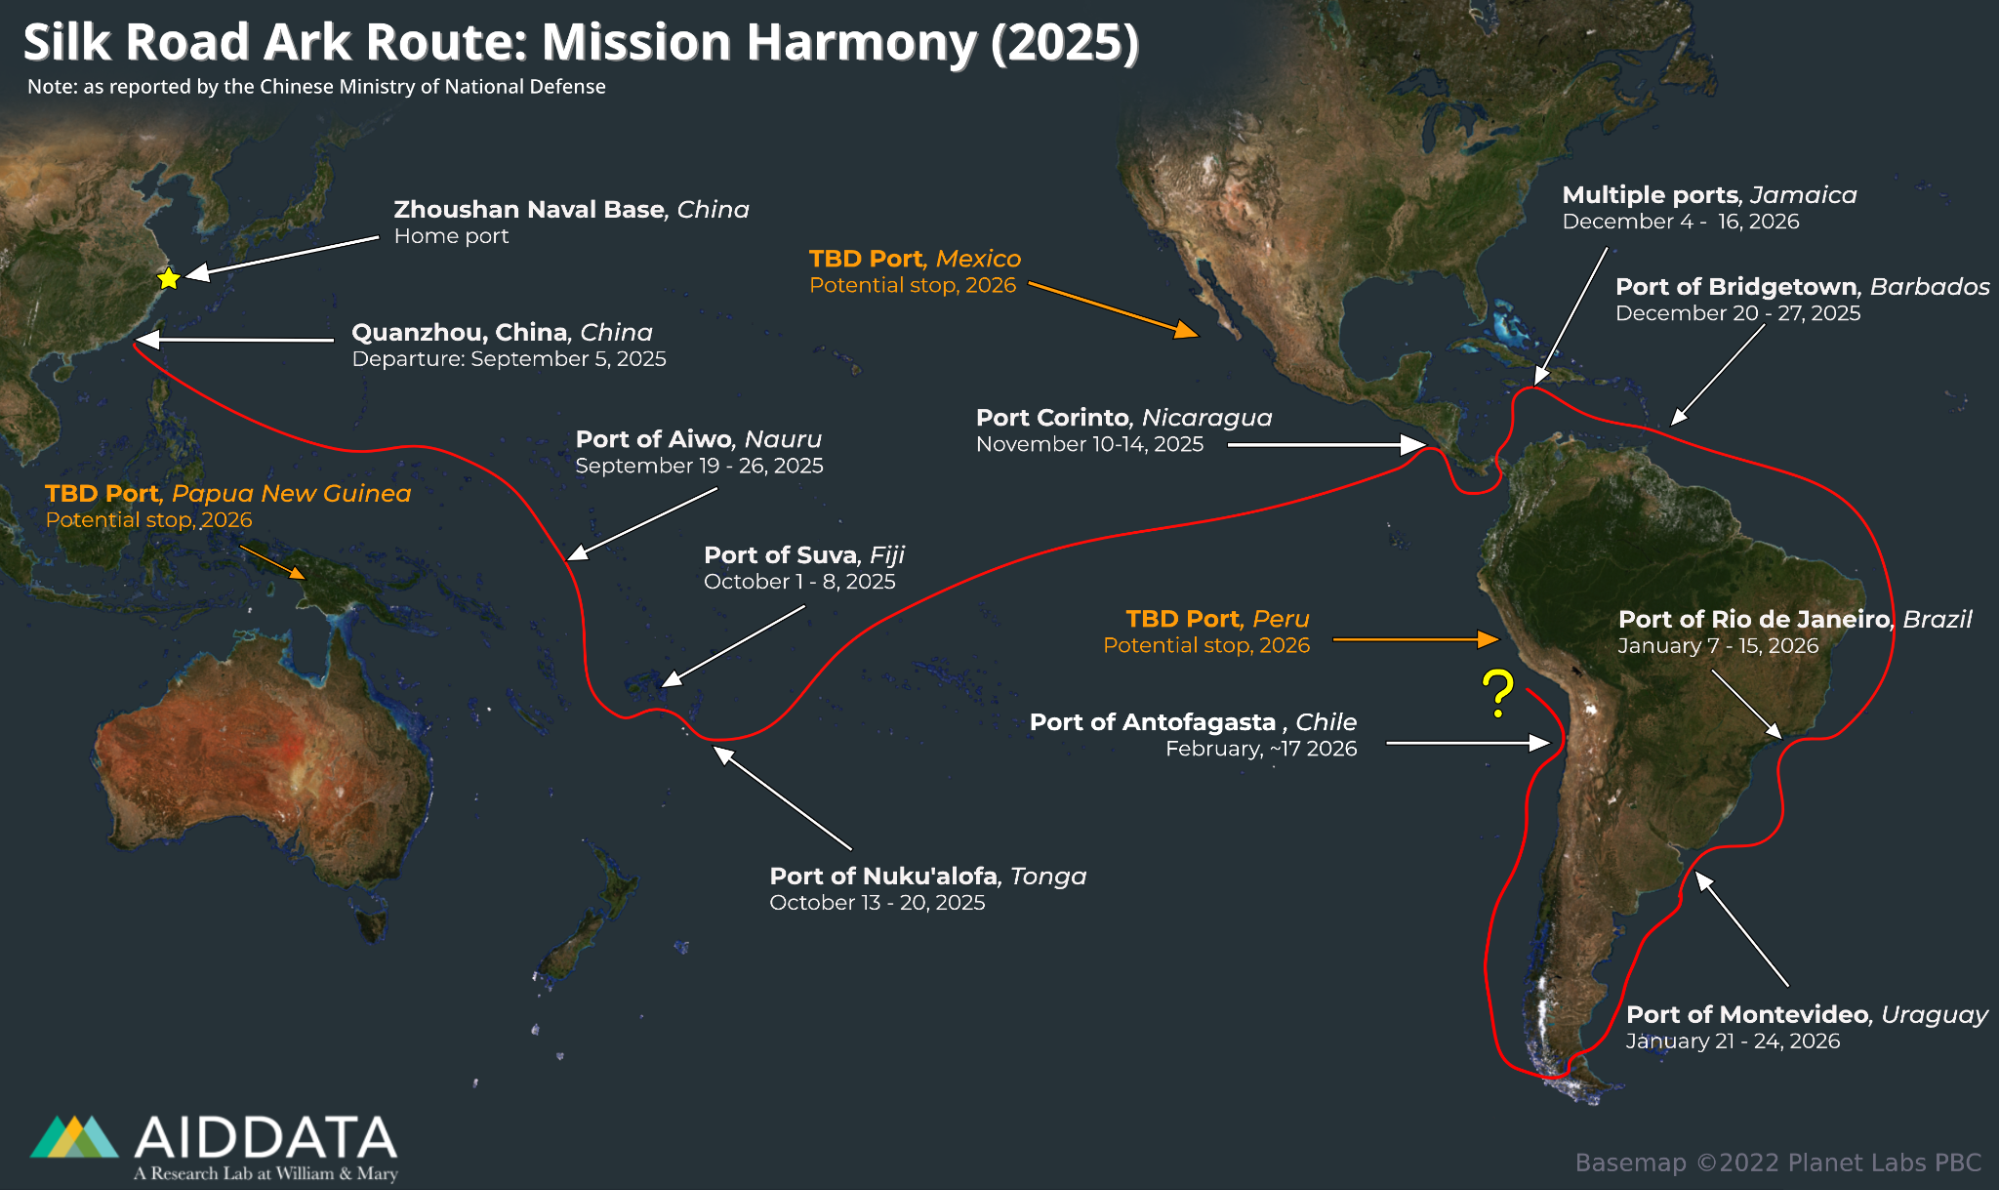
Source: Basemap by Planet Labs, 2022.
At the same time, the PLAN has continued active military diplomacy. In 2025, its 989 Task Group (中国海军989编队)—which includes an amphibious landing ship and two long-range training vessels that collectively carry over 2,100 personnel—made port calls to Cam Ranh Seaport in Vietnam, Port Klang in Malaysia, and Port Tanjung Priok in Indonesia (Ministry of National Defense, 2025b, 2025c, 2025d), in addition to a visit by another ship to Sihanoukville in Cambodia.
Over the past six years, irregular reports in the U.S. media and by government officials have suggested China might be eyeing a permanent military base in Oman, the United Arab Emirates, Cambodia, Equatorial Guinea, or elsewhere. As recently as December 2025, the U.S. Department of Defense assessed that “China has likely [...] considered basing in Angola, Bangladesh, Burma, Cuba, Equatorial Guinea, Indonesia, Kenya, Mozambique, Namibia, Nigeria, Pakistan, Papua New Guinea, Seychelles, Solomon Islands, Sri Lanka, Tajikistan, Thailand, Tanzania, United Arab Emirates, and Vanuatu” (U.S. Department of Defense 2025). Rarely have these ever come to fruition. Instead, this analysis finds a subtle but significant shift in strategy—rather than overtly seeking full-scale naval bases through its official sector financing, Beijing is instead pursuing a broader approach focused on safeguarding national security in its various guises, including the securitization of food supplies, commodities, critical minerals, and trade routes. Tracking Chinese naval activity at global seaports remains vital to understanding these overtures, as “between 2023 and 2024, the United States assesses that Beijing’s overtures have rapidly increased from three potential ‘overseas military installations and access agreements’ to nine” (Thome and Kennedy 2026: 13). Still, maritime nations, and those dependent on maritime trade, cannot afford to be complacent. Military bases are likely still desirable to Beijing in places where Chinese leadership enjoys strong partnerships, has invested heavily, and where it is able to navigate pushback from host countries and competing nations alike.
Before providing policy recommendations for U.S. maritime and economic statecraft in Chapter 7, the remainder of this chapter turns to the case study of a region that as yet has not seen high levels of confirmed investment from China, but which faces increased scrutiny from great powers as a site of future economic and military competition: the Arctic.
Case study: China’s Arctic interests
By Sarina Patterson
A central argument of this report is that China’s pattern of investment in ports and related maritime infrastructure reflects a state-directed effort to improve and harden connectivity: securing the trade lanes, logistics nodes, and energy supply chains that underpin China’s economic and national security objectives. In practice, this has meant prioritizing commercially valuable hubs and activities (container transshipment, energy export terminals, and shipbuilding/transport capacity) while dialing down the visibility and diplomatic cost of pursuing further overt naval bases overseas, beyond the current facilities at Djibouti and Ream. But Chinese investment in ports and shipping remains highly relevant from a military and security standpoint, as Beijing is emphasizing the economic inputs like routes, carriers, and terminals that can serve peacetime trade first, while still creating latent strategic leverage in a crisis.
The Arctic is a useful case study of this connectivity-first posture, because completed Chinese port infrastructure in the Arctic remains limited, while China’s most important commitments cluster around Russian energy export logistics and the Northern Sea Route (Edstrøm 2025; Devytakin 2026; Puranen and Kopra 2023).
Chinese state-directed financing in the Arctic has been modest in terms of port construction, with the major exception of the Port of Sabetta and the Yamal liquid natural gas (LNG) facility. Thus far, China has not built out a portfolio of Arctic ports remotely comparable to its activity in lower latitudes. Instead, the most significant port-adjacent financing is tied to Russia’s Yamal LNG complex at Sabetta, a purpose-built export node on the Yamal Peninsula. Financing from Chinese policy banks was central to Yamal LNG’s broader development, with large lending packages totaling $14.9 billion (Wooley et al. 2023). As outlined in the Harboring Global Ambitions report, it is difficult to disaggregate what percentage of China’s lending for Sabetta and Yamal can be attributed specifically to the seaport, versus upstream LNG infrastructure and associated transport systems (Wooley et al. 2023).
But China’s Arctic financing extends beyond fixed infrastructure like ports into the mobile infrastructure that makes Arctic export routes viable: ships. Beijing uses state-backed finance to support shipbuilding and vessel acquisition to secure energy supply chains in the Arctic, especially LNG flows where specialized carriers (including icebreakers) are critical (Thome 2025b). In Russia specifically, Beijing extended roughly $3.2 billion in financing between 2017 and 2019, tied to the need to move LNG from Russian Arctic projects (such as Yamal LNG) to China—an archetypal connectivity investment that serves both commercial and strategic ends (Thome 2025b).
China’s Arctic priorities, as articulated publicly, reinforce a connectivity-first logic. In a 2018 white paper, China frames itself as a “near-Arctic state” or “near-Arctic power” and declares interests that span scientific research, shipping routes, natural resource development, and participation in Arctic governance (State Council Information Office 2018). A recent survey of China’s Arctic priorities by the Quincy Institute similarly stresses that Beijing seeks to expand its scientific presence and pursue economic opportunities in the Arctic, notably around energy and shipping (Devyatkin 2026). These priorities map onto China’s broader maritime-security concerns—particularly when it comes to reducing its exposure to chokepoints and improving the reliability of trade lanes for critical imports of energy and food. Arctic routes are attractive to China not because they will be dominant in the short-term, but because they can diversify route options and potentially shorten transit between Europe and Asia, especially in the case of conflict closer to home in the South China Sea or a disruption in trade at the Malacca Strait, a major chokepoint for China and other powers (for more, see a discussion of maritime chokepoints in Chapter 7).
At the same time, recent Chinese commentary around the Arctic has a security-conscious bent, as a recent survey of original, official Chinese-language sources finds (Puranen and Kopra 2023). While top-level Chinese statements remain vague on Beijing’s specific aims in the Arctic, Chinese experts and authoritative military texts increasingly treat the region as relevant to expanding national interests. The 2020 edition of The Science of Military Strategy, published by the Chinese National Defense University, states that the Arctic “represents the main direction in which our national interests are expanding” and suggests new missions there could emerge for Chinese forces, while also warning that military demonstrations could trigger “international contradictions” and damage great power relations (Xiao 2020; Fravel 2016). It is possible then that China may selectively deprioritize overt basing and high-visibility, dual-use port investments in the Arctic because they will provoke counterbalancing—while still building out the economic and logistical scaffolding that provides connectivity, access, and options.
The launch of the “China-Europe Arctic Express” last year is a case in point. This route links Chinese hubs, including the Ningbo/Shanghai region, to major European ports, such as Rotterdam, Hamburg, and Gdańsk, via the Northern Sea Route (NSR), cutting transit times by 10 days compared to traditional southern routes (Pascarella 2025; Reuters 2025; Weisko 2026). The container ship Istanbul Bridge made the first-ever liner voyage along the NSR in just 20 days in September 2025, underscoring that China is testing a commercial model to operate container vessels year-round (Weisko 2026; Pascarella 2025). But the NSR lies almost entirely within Russia’s territorial waters and its exclusive economic zone, with Russia imposing navigation governance, fees, and escort requirements that eat into any time savings (Weisko 2026). Fees for icebreaker escort services, often provided by Russia’s nuclear-powered fleet, can be extremely high for large tankers and LNG carriers, reaching hundreds of thousands of dollars per escort in some cases (Humpert 2025). This means that China’s search for Arctic connectivity is, in the near term, reliant on Russia’s discretion and China-Russia maritime cooperation.
However, climate change is an accelerator that makes China’s Arctic route seeking more plausible and strategically salient over time. NOAA’s 2025 Arctic Report Card shows that in 2025, winter sea ice reached its lowest levels ever recorded (NOAA 2025; Milman 2025). Peer-reviewed modeling suggests that Arctic routes will become more navigable relatively soon: one study projects that Polar Class 7 vessels (the least ice-strengthened polar ships designed for thin summer ice) could navigate Arctic passages in nearly all seasons by late century, with optimal routes shifting increasingly toward the central Arctic (Zhao, Li, and Zhang 2024). This raises the prospect for extended or near year-round navigation along the NSR for certain classes of ships (Orf 2024; Zhao, Li, and Zhang 2024). Importantly, the future Transpolar Sea Route—which would run more directly across the central Arctic Ocean and lies outside the exclusive economic zones of Russia and other Arctic countries for significant stretches—could become seasonally navigable much earlier than most assume. A recent study finds transpolar routing options may become viable around 2040, under high-emissions scenarios that appear on track to continue (Li and Lynch 2023). If realized, navigable transpolar routes would reduce China’s reliance on the Russian-controlled NSR and could intensify its incentive to invest in ice-capable fleets, Arctic-ready insurance and logistics ecosystems, and compatible European hub partnerships, aligned with Beijing’s search for maritime connectivity and resiliency.
On the military side, some analysts have argued that China might seek dual-use Arctic ports to support submarine operations or strategic deterrent patrols under polar ice (Brady 2019; Goldstein 2019; Ghoshal 2020). These investments remain highly speculative and politically charged. A recent study by scholars at the Harvard Kennedy School finds that claims of $90 billion in Chinese Arctic investment are significantly exaggerated, with many projects proposed, canceled, or unrealized, especially outside Russia (Edstrøm 2025; Thorsson 2025). In reality, China’s Arctic posture today is an uneven portfolio, where Russian-based energy and shipping logistics dominate what is actually financed and built, while non-Russian Chinese Arctic infrastructure remains thin. Furthermore, the danger of U.S. sanctions increases the risk for Chinese investors, adding another layer of uncertainty into an environment in which it is already difficult to operate.
Looking ahead, the strongest near-term likelihood is that China will keep prioritizing Russia-linked LNG access and NSR logistics, as these investments produce immediate, bankable returns (energy supply and shorter routes) and reinforce bilateral strategic alignment between China and Russia. Recent reporting that a Chinese company, Hainan Yangpu NewNew Shipping, will potentially take a $2.5 billion stake in a terminal project at Arkhangelsk on the NSR fits this trajectory: build capacity at a western NSR gateway and support more regularized container movements (Papachristou and Ng 2025; The Maritime Executive 2025). This would be part of a joint venture that Hainan Yangpu NewNew Shipping and Russian state-owned transport company Rosatom entered in 2024, which seeks to ship 200 million tonnes of cargo through the NSR by 2031 and 1.8 billion tonnes by 2035 (Baird Maritime 2024). Taken together, China’s Arctic activities point to a pragmatic, connectivity-driven strategy: expand shipping and invest where Russia already provides the political and physical enabling environment, while avoiding obvious military signaling and overt port-basing footprints that would galvanize a counter-response.
7. Implications for U.S. maritime and economic statecraft
By Alexander Wooley and Sarina Patterson
Newly-collected data on China’s state-directed financing for overseas ports expansion and construction, available in the CPORTS 2.0 dataset, raises several important questions for Beijing’s peers and competitors—particularly policymakers in the United States and allied countries—to consider, including:
- How much of China’s global ports portfolio overall has squarely commercial aims as opposed to a geostrategic design for global power projection (including future naval bases, logistics and resupply bases, or listening posts) and competition with the U.S.? And how cohesive might this strategy be?
- Which of these ports might be developed and designated purely for military use or purely commercial use—versus potential dual-use facilities?
- How will China’s future shipbuilding programs and military force dispositions affect not only the international security environment, but also the maritime supply chains that bring the world everything?
- How should other powers respond, including the U.S.? How might countries that are home to or considering Chinese-financed ports weigh the costs and benefits of engagement?
The CPORTS 2.0 dataset demonstrates that China both dominates the port building sector globally and is a top player in terms of port operations. China wins twice, with global trade traveling from Chinese-built overseas ports to mega-ports within China itself. Chinese-financed ports are simultaneously the destination points, the departure points, and the means by which global maritime trade is plied.
China’s ubiquitous presence at the world’s top ports means that the U.S. cannot currently insulate itself from Chinese supply chains, in either peacetime or conflict. Even in the case of a future crisis, Chinese merchant ships would continue to ply the world’s oceans, and trade could continue along other sea lanes, with goods passing through the ports of third-party countries. As shown by the reciprocal tariffs established in 2025, protectionism does not shut down global trade or the maritime traffic that underpins the world’s exports and imports—it merely re-routes it (Schrader 2025; Hufbauer and Zhang 2026).
By contrast, China’s maritime dominance gives it options. It has been slow to commit to building permanent overseas bases, beyond facilities at Djibouti and Ream. Beijing could stop short of seeking an extensive array of overseas naval facilities, instead relying on less permanent visiting rights and friendly ports, while choosing to safeguard key sea lines of communication (SLOCs) through which it obtains the commodities, critical minerals, and food imports on which the country depends for continued economic growth.
This report suggests that Chinese state-directed investments into many ports—especially those in high-income countries—were largely for commercial purposes. Crucially, however, Chinese companies and state-owned enterprises are increasingly aligned with state and Chinese Communist Party (CCP) priorities (Parks et al. 2025a). In 2015, the CCP adopted a policy called “Made in China 2025” (MIC2025) that seeks to ensure China’s dominance in a wide array of high-tech manufacturing sectors—including, but not limited to, artificial intelligence, advanced robotics, semiconductors, quantum computing, 5G, biotechnology, and renewable energy. Since the adoption of MIC2025, the percentage of China’s cross-border acquisition lending portfolio targeting “sensitive” sectors has skyrocketed from 46% to 88% (Parks et al. 2025a).
Meanwhile, U.S. and Western national security and economic strategies do not currently have nearly this level of coordination or alignment. While there is some policy movement to better compete in overseas port development and operation, assets and execution have trailed, and it is too soon to tell whether the effort will be successful. Such a shift will require capacity, resources, and some level of shared governance across agencies and allies.
U.S. maritime strength is dramatically lopsided and has been for decades: the U.S. possesses an immensely powerful navy and coast guard. It operates hundreds of overseas military bases (including ports), but lacks any comparative control of global commercial logistics. It remains the world’s largest economy and a top destination for commercial maritime traffic, but is home to a comparatively small commercial shipbuilding industry; a moribund environment for port and waterfront development, with an estimated $12 billion in unmet need over the next decade; a tiny, dilapidated merchant marine of just 200 vessels, compared to China’s 6,000 ships; and scant official public investments in overseas commercial or civilian ports (ASCE 2021; Gomez 2024).
It is unclear yet whether efforts in the U.S. to expand and modernize the navy or revitalize its domestic industrial shipbuilding base will succeed, or to what degree U.S. allies in Europe and the Indo-Pacific might direct increased financing or defense spending for ports infrastructure or maritime security. While this report will not delve deeply into these issues, it is instructive to examine how the U.S. and its allies are currently approaching ports development, shipbuilding, and other strategic maritime infrastructure, and to what degree those efforts leave gaps. Many of these initiatives are summarized in “America’s Maritime Action Plan,” released by the White House in February 2026 (The White House 2026).
In the U.S., a recent bipartisan proposal, the SHIPS for America Act, seeks to add 250 U.S.-flagged vessels over the next decade and establish a Maritime Security Advisor in the White House to lead an interagency board for a National Maritime Strategy, among other priorities. (Introduced in early 2025, the legislation is currently stalled, but could see a push later in 2026). Relatedly, the U.S. Maritime Administration (MARAD) announced $450 million in funding for FY26 port infrastructure development (U.S. Department of Transportation 2025b), while the U.S. Department of Labor announced some $8 million for “Revitalizing Domestic Manufacturing by Developing the Next Generation of America’s Shipbuilders through International Partnerships” (U.S. Department of Labor 2025). This is in addition to the billions of dollars in real and promised investments that South Korean shipbuilding company Hanwha set aside for Philadelphia’s naval yard, with more to potentially come from other U.S. allies (Sadler 2025b). In early April, the White House published an executive order mandating the creation of “Maritime Prosperity Zones” around the U.S. that would grow and diversify domestic shipbuilding and infrastructure manufacturing capacity, with public-private investments and investments from allies (Sadler 2025a). The U.S. is casting the net far and wide for this financing. For example, in January 2026, the U.S. Department of Labor announced a $5.8 million grant awarded to the Massachusetts Maritime Academy (MMA) to partner with Satakunta University of Applied Sciences (SAMK) in Finland with the goal of speeding up U.S. shipbuilding (MMA 2026).
While European governments have been focused on Chinese ownership of and influence over ports across the continent, with the European Parliament calling for a “European Port Strategy,” the U.S. government has made a number of recent efforts to better understand the true scope of China’s global ports portfolio. The bi-partisan Strategic Ports Reporting Act, passed by the House of Representatives in May 2025, intends “to develop a strategy to monitor efforts by the People’s Republic of China (PRC) to build, buy, or own strategic ports that provide capabilities for military, diplomatic, economic, or resource exploration superiority over the United States” (Huizenga 2025). The bill was rolled up into the FY 2026 National Defense Authorization Act (NDAA), which became law in December 2025. Per the Act, the U.S. Department of State (DoS) and the Department of Defense (DoD), in coordination with the Secretary of Defense, is tasked with identifying and mapping any efforts by China to build, buy, or otherwise control ports that may be of importance to the U.S. militarily, diplomatically or commercially, and report to congressional committees through unclassified reports. In coordination with Combatant Commands, MARAD, the DFC, the Director of National Intelligence (DNI), and others, DoS and DoD are required to propose courses of action “to secure trusted investment and ownership of strategic ports and maritime infrastructure, protect such ports and infrastructure from PRC control, and ensure open access and security for such ports…” (U.S. Congress 2025–2026, Section 1704).
The remainder of this chapter focuses on three issues that have strong implications for the U.S.: (1) China’s ports presence at or near the maritime chokepoints through which global supply chains run; (2) Chinese state-directed investments in and activities at ports in the Americas, where the second Trump Administration has sought, at times unilaterally, to reassert American influence; and (3) a case study of the ports and maritime infrastructure of Hampton Roads, Virginia, as a microcosm of the interconnectedness between China and the U.S.
7.1 Maritime chokepoints
In March 2025, the Trump Administration launched an investigation through the Federal Maritime Commission (FMC) of whether and how foreign governments may have created unfavorable conditions for U.S. shipping and trade (FMC 2025). The investigation identified seven maritime chokepoints critical for the U.S.: the English Channel, the Malacca Strait, the Singapore Strait, the Panama Canal, the Suez Canal, the Strait of Gibraltar, and the Northern Sea Passage (Curtis 2025).
Leaders in Beijing almost certainly have a similar list, as many of the West’s chokepoints are China’s chokepoints. Numerous official, Chinese-language sources have named the Malacca Strait, the Panama Canal, the Suez Canal, the Strait of Hormuz, and the Bering Strait (through which flows part of the Northeast Passage) as critical chokepoints for China. A Ministry of Commerce of China (MOFCOM) interview explicitly discussed the “Malacca dilemma” (马六甲困局), noting that the security uncertainties around the Strait, particularly around energy transportation, leave China exposed to its disruption (MOFCOM 2009), while a National Energy Administration article highlighted the large share of Chinese oil imports that transit Malacca and framed this vulnerability as a “throat” (咽喉) or chokepoint for maritime traffic (NEA 2012). A 2021 article published in China Military Online, an official outlet of the PLA, named the Strait of Hormuz and the Suez Canal as “vital passageways” (咽喉要道) for China, while two articles in the same outlet (in 2015 and 2019, respectively) listed the Panama Canal and the Bab el-Mandeb Strait as chokepoints and framed the Bering Strait as a chokepoint analogous to Malacca (Ministry of National Defense 2015, 2019, 2021). Concurrently, Chinese overseas ports financing has clustered near some of these areas: the maps below, based on the CPORTS 2.0 dataset, show that China has invested in a significant number of ports on the approaches to and from key chokepoints.
One notable example is the deep-water port of Muara in Brunei, a facility that exclusively appears in the CPORTS 2.0 dataset because it did not secure official sector PRC financing until late 2024. If Ream provides a northerly, long-distance guard to the approaches to the South China Sea or Malacca Straits, Muara is its southern counterpart. Together, these two ports cover the flanks through which much commercial traffic flows, as would warships in times of conflict. Muara is also just a few hundred miles from Palawan in the Philippines, and the Spratly Islands. In August 2024, the Bank of China issued two loan commitments worth $128 million to a joint venture of Beibu Gulf Holding (HK) Co. Ltd (51% equity stake) and Darussalam Assets Sdn Bhd (49% equity stake) for the Muara port expansion.[29] In very close proximity, within the harbor, is a massive oil refinery and petrochemical plant, which was constructed after securing a $1.75 billion syndicated loan from five Chinese state-owned banks. CDB meanwhile financed the construction of a bridge to the oil refinery and the petrochemical plant. A single contractor—China Harbor Engineering Company—was selected to expand the port’s terminal facilities and build the bridge, the oil refinery, and the petrochemical plant. Muara is also home to a Brunei naval base and so, like Ream, again raising the speculative possibility of a facility that might be used by two navies.
But how might Beijing seek to leverage the ports and facilities it has financed near these chokepoints, especially in a crisis? In Chapter 4, our co-author Sheng Zhang provided an overview of PLAN force developments (particularly as they apply to large surface platforms that emphasize anti-air warfare and deep, blue-water, or open ocean operations). That dovetails with this study’s analysis of official Chinese-funded seaports, which examines water depth, pier length, and other port features to identify whether a port can handle blue-water naval ships.
However, recent developments have shown that a small and unsophisticated shore-based military outfit can have an outsized impact at sea. Using commercially-procured or jury-rigged weapons, sensors, and guidance systems, small bands of fighters can now tie down the surface warfighting platforms of a major opponent—draining them of expensive, difficult-to-replenish ammunition and ordnance while effectively shutting down loss- and risk-averse commercial maritime traffic. Such asymmetric tactics have been prominently used by the Houthis in the Red Sea and Suez Canal and by Ukraine against the Russian Navy’s Black Sea Fleet. But great powers can also adopt these approaches: Russia, an ally of China, including on the high seas, has deployed these tactics when thrust into the role of a weaker power, as seen by its alleged destruction of the undersea cables of Western countries (Ogryzko and Rizzi 2025; Bassoli 2025).
This is likely only the tip of a future iceberg. Artificial intelligence, drones, and unmanned systems technologies are still in the earliest stages of development and deployment. Future uses for inexpensive weapons that small and non-state actors, as well as major players, might put to use to surveil or shut down maritime chokepoints are legion. With a small physical footprint, a military unit of this sort (owned by or in the service of a major power such as China), or under the guise of being a port’s private security detail or armed police detachment, might feasibly operate from within the port of a foreign country near a chokepoint, while remaining largely undetected or difficult to locate. Having the political and economic leverage to access that port in the first place would be key for a power to succeed in this maneuver.
7.2 The Americas
The second Trump Administration has married the political backing of conservative and libertarian country leadership in the Latin America region with an intense focus on leveraging those relationships to help secure oil and gas resources. But the notion that a modern Monroe Doctrine or President Donald J. Trump’s proposed corollary, the recently coined “Donroe Doctrine,” can be implemented overnight flies in the face of the facts. It is China, not the United States, that is entrenched in Latin America. In 2000, trade between Latin America and the Caribbean and China was just over $14 billion; by 2022, it had increased by a factor of thirty-five times to $500 billion (ECLAC 2023, 21). According to a recent analysis undertaken by AidData at the request of the Associated Press (AP), between 2014 and 2023, China issued loans and grants to countries in Latin America and the Caribbean worth roughly $153 billion—the single largest source of official sector financing for the region—compared to the approximately $51 billion from the U.S. during the same ten-year period (Ho-Him et al. 2026).
Earlier in Chapter 4, our co-author Lea Thome explored the significance of the Port of Chancay and other Brazilian ports for China’s supply lines. But Brazil is just one example of how China is flexing its presence in Latin America’s ports. Another case in point is Panama—a newsmaker in recent months, as the U.S. has contested the ownership of key ports infrastructure at an artery that is important both geopolitically and economically (see Section 7.1 for a discussion of China’s maritime chokepoints). While attention has been focused on the ports and associated infrastructure at either end of the canal within Panama, Beijing has also invested in a number of strategically important ports that bracket Panama throughout Central America and the Caribbean. This string of official Chinese port investments includes, on the Pacific Ocean, the Port of Corinto in Nicaragua (a recent loan, captured in the CPORTS 2.0 dataset); and La Libertad Port in El Salvador, recently completed in November 2024.[30] On the Atlantic Ocean, within a few hours steaming of the Panama Canal, lies Colombia’s Urabá Multipurpose Port Facility (Puerto Antioquia), which was granted a permit to begin international operations in January 2026. Further afield are earlier official Chinese investments, including in St. John’s Harbor in Antigua and facilities in Jamaica and the Bahamas.
Latin America is thus characterized by a growing network of Chinese-funded ports, just as China’s supply chains in the region are deepening, not weakening, as Beijing rebalances trade in the wake of U.S. tariffs. On the drawing board are potential logistic routes that will creep far into the interior and extend in multiple directions. For China, this approach echoes its own national development strategy, where for decades (for example, through its “Develop the West” program in the 2000s), the Chinese central government invested heavily in transport infrastructure in the interior of the country to connect poorer western provinces with the more prosperous coastal provinces and ports already locked into foreign trade and markets. These routes were meant not only to reduce inequality but also to ensure key natural resources in western China could be efficiently brought to growing manufacturing and processing centers.
This is a domestic strategy that Beijing has deployed overseas with success. Daniel Munch, an economist with the American Farm Bureau Federation, noted that when a country gains control over ports that make trade faster, cheaper, and more reliable, such as the Port of Chancay, trade flows tend to “lock in” and remain stable (Cordero 2025). It could take decades for the U.S. or any other power to catch up. China is already there in Latin America: for some products, the region provides 70% or more of China’s total imports, in areas such as lithium carbonate, lead ore, and especially food. Between 2010 and 2022, Latin America accounted on average for almost one-third of China’s total food imports; during that period, Brazil alone supplied an average of 21% of China’s food imports (ECLAC 2023, 23).
In the face of shifting global geopolitics, major exporters and their shipping lines have been adept and agile at finding new markets, new suppliers, and new sea routes. China’s investments in Latin American infrastructure across the transportation supply chain means it can obtain a crop like soybeans at a better price than from American farmers—a supply line over which Beijing can exercise more control, creating less dependence for China and less leverage for Washington.
But disentangling economic imperatives from national security interests, or mapping out clear delineations between what is Chinese-financed and what is controlled more securely by the U.S. is difficult. Globalization has intertwined U.S-China relations and interests, and this applies to ports and harbors. A case in point is the Port of Georgetown in Guyana, on the Atlantic Ocean. The only English-speaking country in South America, Guyana is presumably subject to the revived Monroe Doctrine and the Trump corollary. In October 2025, a new Demerara River Bridge—financed by the Panama and Beijing Branches of Bank of China and built by China Railway Construction Corporation (CRCC)—was opened at the port to fanfare. The much-needed span connects the capital’s commuters living on the west bank with those on the east and is popularly referred to as “the Chinese bridge.” While Chinese engineers and workers were constructing this massive structure, a short distance downriver hundreds of American oil workers from major petroleum companies were staking out vast tracts of shoreside property to support the offshore oil and gas operations that have made Guyana one of the world’s fastest growing economies. Alongside Exxon, Chevron and Hess is China’s National Offshore Oil Corporation (CNOOC), which has a sizable economic stake in the oil patch discovered just a decade ago. The Trump Administration has sought increasing engagement with Guyana in both national security and economic terms, positioning it as a counter to Venezuela next door. But the CPORTS 2.0 dataset shows that Guyana has received a growing share of Chinese financing in the region—securing over $956 million between 2020 and 2023, or almost a third of all Chinese official sector financing in South American countries in 2022.
When the ExxonMobil-led consortium began production in Guyana in 2019, Beijing paid close attention and developed a strategy to join in on exploration—despite its historical investment in the fields in neighboring Venezuela (Starbroek 2019; Burgess and Thome 2026). This included financing for the Guyana Deep Water III UK Ltd.’s floating production storage and an offloading vessel to exploit Guyana’s Stabroek Block offshore oil field.[31] Chinese investments, in Latin America and elsewhere, are increasingly syndicated in partnership with American, Canadian, and European companies. These companies share skin in the game and provide Chinese lenders operating behind the scenes with protection from sovereign pressure on their investments.
In this particular case, in 2021, a syndicate of 11 banks, including Bank of China (BOC) and ICBC, entered into a $1.05 billion loan agreement with Guyana Deep Water III UK Limited—a United Kingdom-incorporated special purpose vehicle wholly owned by Netherlands-based SBM Offshore B.V.—for the FPSO Prosperity Project. The two Chinese banks provided close to $200 million of the total loan. The proceeds will be used for the construction and operation of a floating production storage and offloading (FPSO) vessel, the FPSO Prosperity (also known as the FPSO Liza Prosperity).
7.3 Ports in the United States: A case study of the Hampton Roads region
As has been well-documented elsewhere, the U.S. lags behind China and other commercial maritime powers in key areas. This extends to ports, where by some measures not a single U.S. container port ranks among the world’s top fifty most efficient ports, and only nine U.S. container ports rank in the world’s top 100 ports by volume (Cordero 2025; Lloyd’s List 2024). But while Latin American ports saw significant growth and Chinese investment in recent years, as detailed in the previous section, many U.S. ports concurrently experienced a decline in business. Imports at the country’s largest container ports were down 6.6% year-over-year in 2025 and are projected to drop sharply in the first half of 2026, as the effects of U.S. tariffs continue to percolate (Schuler 2026; Berman 2026). Stronger impacts are being felt in specific sectors, such as food commodities; for example, in the important grain corridor of the New Orleans District, soybean exports grew by less than 3% from September 2024 to 2025, while exports plunged by 81% in the Seattle District over the same period (Cordero 2025).
In this strained domestic environment for American ports, an example close to home serves as an instructive microcosm of the U.S.-China relationship and the inseparability of commerce, economics, and national security. The Hampton Roads area in Virginia—where AidData is housed at William & Mary, a university in Williamsburg—is home to the world’s largest naval base; four major deep-water ports, plus 55 other public and private marine terminals; Newport News Shipbuilding, the sole builder of America’s aircraft carriers and one of only two builders of the country’s nuclear-powered submarines; the Norfolk Navy Yard, the U.S. Navy’s largest and most comprehensive industrial facility; and many other ship repair yards.
The Hampton Roads area is also a major hub of connectivity for trade: a railway line that runs down the Virginia Peninsula eventually stops when it reaches the waters and ports of Hampton Roads. Each week, the railway company CSX loads more than 5,000 railcars with coal from Appalachian mines, sending it down the peninsula to be unloaded and formed into enormous hills on a 200-acre waterside site that can accommodate up to 1.7 million tons of coal (Dominion Terminal Associates 2026; U.S. Coal Exports 2023). Nearby, Norfolk Southern Railway owns and runs Lambert’s Point Coal Yard in Norfolk, which has operated nearly 24/7 to ship coal from this spot since 1865. Hampton Roads is the busiest coal exporting region in the U.S., sending overseas some three to six million short tons of coal a month (U.S. Coal Exports 2025).
Only two miles from the Newport News coal depot is Newport News Shipbuilding (NNS), part of HII (formerly Huntington Ingalls Industries), America’s largest shipbuilder. (The shipyard was founded in the late nineteenth century as a means of diversification by the businessmen who had originally built the rail and coal businesses nearby: an early example of modern connective infrastructure). NNS is critical to U.S. national security, keeping the U.S. Navy fleet operational and building the new Gerald R. Ford–class aircraft carriers and the Virginia–class attack submarines. These nuclear-powered submarines are a central, multi-billion-dollar piece of the AUKUS Agreement, a trilateral security pact between the U.S., Australia, and the United Kingdom.
This juxtaposition—the construction of nuclear-powered aircraft carriers and submarines, which feature some of the most sophisticated technologies ever designed, next door to mountains of coal, one of the world’s most ancient energy sources—belies how these old and new technologies remain closely connected and deeply relevant to both Chinese and U.S. interests. Around the time Lambert’s Point Coal Yard was being established, inventors in Europe were testing revolutionary new processes that would industrialize mass production of another material that remains central to modern life: steel.
Coal and steel are intimately connected: today, roughly half the coal that makes its way to Newport News is destined for export as “seaborne metallurgical coal.” Metallurgical coal, also known as met or coking coal, is a naturally occurring sedimentary rock found in the earth’s crust. Unlike the thermal or bituminous steam coal used for power generation, met coal is rarer and of higher quality, burning longer and hotter and selling for two to three times as much. Seventy percent of steel globally is produced with blast furnaces that depend on vast quantities of met coal as a necessary ingredient.
No country makes more steel than China, which in fact produces more steel than the rest of the world combined (World Steel Association 2025). China and India are prime consumers of met coal that is mined in Kentucky, West Virginia, and western Virginia and then loaded onto ships at Newport News. In 2021, China-bound coal helped U.S. coal exports increase an estimated 26% to reach 87 million short tons, of which more than half was metallurgical coal (Gunnoe 2022).
But this relationship is highly asymmetrical. The U.S. may view China—both the world’s largest producer and consumer of met coal—as an important export market, on which American jobs, mines, and companies rely, yet the reverse is not true. In 2025, the U.S. supplied just under three million of the nearly 138 million tons of met coal that China imported that year (Majid 2026). Much of China’s overall coal imports (both thermal and met) come overland from Mongolia. But the country is also the world’s largest seaborne importer of coal, accounting for 27.5% of the global seaborne coal market in 2023, with top sources including Indonesia, Australia and Canada (The Coal Hub 2024). With many willing suppliers, China can afford to be selective, taking into account not only price but also geopolitics. Australia is a massive met coal producer, but ongoing political tensions caused China to cease importation of Australian coal from 2020 to 2023 (Economist Intelligence Unit 2023). This provided a window for the U.S., temporarily driving up American coking coal sales to China and fueling the country’s massive steel production. In turn, China’s civilian and naval shipbuilding industry consume vast quantities of this steel each year. In a future worst-case scenario, met coal shipped from Hampton Roads might find itself as an essential component in the production of steel for a PLAN-guided missile destroyer facing off against an American warship—itself deployed from a Hampton Roads naval yard.
The Hampton Roads region is also home to several major U.S. container ports, and China is present here too. A significant share of the commercial container ships that sail past the U.S. Atlantic Fleet at Naval Station Norfolk on their way to the Port of Norfolk, the U.S.’s fifth-largest port, will have been built in China. Even the U.S. Navy is dependent on Chinese-built vessels: 3 of the 10 commercial oil tankers that ship fuel for the Department of Defense through the Tanker Security Fleet and 7 of the 12 most recently built ships that ship dry cargo supplies for the Maritime Security Fleet were built by Chinese companies (Congressional Research Service 2023). China is deeply embedded in the manufacture of shoreside port infrastructure and equipment as well. ZPMC (Shanghai Zhenhua Heavy Industries Company Limited), a Chinese state-owned enterprise, builds more than 70% of the world’s Ship-to-Shore (STS) cranes used at container terminals in more than 100 countries and some 80% of the ship-to-shore cranes in operation in the U.S. (U.S. House Committee on Homeland Security 2023; Anselmo 2024).
In 2023, the Port of Virginia paid $61 million for five new ZPMC cranes for the main Virginia International Gateway (VIG) and Norfolk International Terminals (NIT). Each crane, which comes fully assembled from China via a heavy-lift ship, can reach across a vessel that is 26 containers wide (three to four containers more than previous cranes could span). This capability is needed for terminals to service the largest, most modern container ships: ultra-large container vessels (ULCVs) capable of transporting 20,000 TEUs. Cranes from China continued to be delivered to Hampton Roads through 2025.
Beyond Virginia, ZPMC cranes are in operation at key ports across both coasts of the U.S., including Baltimore, Philadelphia, Newark, Oakland, and Long Beach. In the early 2020s, U.S. lawmakers raised security concerns over using Chinese-manufactured hardware, including ZMPC cranes, at American ports. Cranes compromised by an adversary could feasibly gather proprietary information on the movement of containers within a port or particular shipments. A compromised crane connected to other parts of a port network could further spy on critical infrastructure, access import-export data or sensitive communications, or monitor U.S. Navy movements at nearby naval stations or shipyards, sending the data back to actors in China. The operational technology (OT) systems of the cranes could even, in theory, be exploited to shut down a port completely, by disrupting crane operations or forcing an emergency shutdown. Control of the crane market as well as possibly being able to access massive amounts of customs scan data (Nuctech) as well as LOGINK raises the specter of Beijing being able to access port ingress and egress data and, in a worst case scenario, remotely shut down a hostile nation's port operations via software commands, in a kind of cyber operation(s) that stop just short of war.
Others considered these concerns overblown, even scaremongering, with the American Association of Port Authorities, representing more than 130 public port authorities in the U.S., Canada, the Caribbean, and Latin America, calling the legislative and media coverage “sensationalized” (The Maritime Executive 2023). But some port operators themselves have taken precautionary steps to secure their ports from foreign interference. The Port of Virginia, for example, has required the installation of American-made software in the port’s ZPMC cranes and mandates inspections in China to ensure quality control and minimize potential intellectual property theft.
A precedent exists, of sorts, in the African Union headquarters in Addis Ababa, Ethiopia. The gleaming office tower was a gift from China, opening in 2012. A few years later, however, allegations emerged that Beijing was nightly transferring data back to China from the AU’s servers, which China had provided (and bugged) during construction.[32]
Regardless of ZPMC’s involvement, dockyard cranes remain essential to global trade, and the vast majority of goods now come to the U.S. via containers that must be unloaded by massive, specialist, high-tech cranes, largely produced by China. In 2024, the Biden Administration announced that the U.S. would invest $20 billion in American port infrastructure and U.S.-based manufacturing of shoreside cranes (by an American subsidiary of Japanese firm Mitsui Engineering & Shipbuilding) would begin for the first time in thirty years (Anselmo 2024). However, given other pressing priorities for the revitalization of American domestic manufacturing, including shipbuilding in particular, it is difficult to imagine that this will be a nationwide industrial priority—even if the will and workers were available.
8. Conclusion and recommendations
By Alexander Wooley and Lea Thome
This chapter proposes several concrete actions that the U.S. and its allies, as well as regional powers like India, and countries hosting Chinese-financed ports can take to level the global ports playing field as part and parcel of navigating competing visions of global orders. First, it is important to note that China has not foisted its capital and expertise unasked-for on countries: ports are recognized as a key form of connective infrastructure that are foundational for national economic development. Chinese financing for overseas ports has helped fill a major infrastructure gap, during a time when financing from other providers was either in short supply or nearly non-existent. Over the past four decades, Western bilateral aid agencies and Western-led multilateral finance institutions largely left the infrastructure business. In turn, not only developing countries, but also some of the world’s wealthiest nations, eagerly sought out official Chinese loans and grants. Belatedly, Western and regional institutions are now hoping to jump in from the sidelines to compete on ports and maritime infrastructure. They are entering a highly uneven playing field that sits increasingly at the intersection of economic growth, soft power influence, and security.
|
A Four-Point Plan for an Integrated Ports Strategy |
|||
1. Policy |
2. Plan |
3. Partner |
4. Platform |
|
Encourage the U.S. and its allies to develop a long-term overseas port financing strategy. |
Incentivize holistic planning and integration of port planning, including shipping and shipbuilding. |
Work with host governments and beneficiaries to develop domestic policy assessment tools for port investments and port management. |
Establish a taskforce to produce high-quality impactful research, assessments, and recommendations. |
8.1 The U.S. and its allies must develop a long-term strategy
In a hypothetical, future maritime dispute between China and the West, it is easy to imagine a country with a Chinese-financed port receiving pressure from Beijing to host PLAN warships or the Chinese merchant ships, militia vessels, and ocean-going fishing fleet that will be expected to take orders from the central government in such a scenario. This blurring of trade, economics, and security was captured by Canadian Prime Minister Mark Carney in a speech at the World Economic Forum in January 2026, where he highlighted how “great powers have begun using economic integration as weapons, tariffs as leverage, financial infrastructure as coercion, supply chains as vulnerabilities to be exploited” (Carney 2026). Beijing’s financing of overseas ports sits at this intersection of economic statecraft and national security, with loans that recipient countries officially repay in cash or commodities—or by becoming de facto allies or safe harbors in times of conflict. Where for decades the U.S. and E.U. provided limited financing options and mechanisms, China placed big bets on ports (as well as other large infrastructure projects) and their host governments worldwide, and many leaders in receiving countries depend on China for investment, credit, and even credibility. It is therefore unlikely that host countries would unanimously reject the use of their ports by China in a conflict, should Beijing apply pressure to access a port it has already built and paid for. Furthermore, fine distinctions between civilian versus military use would likely fall by the wayside in a conflict; in early 2026, thousands of Chinese fishing vessels were mobilized in an unprecedented exercise to practice blockade drills at sea, a presumed tactic for intercepting U.S. and allied warships attempting to reinforce Taiwan during time of war (Buckley et al. 2026). In such a scenario, the possibility of those vessels refueling and resupplying at an overseas port financed by China is high.
Should this hypothetical come to pass, China has an enormous leg up. More agile and less bureaucratic than most Western lenders and creditors, Beijing has been investing globally in ports for decades. Yet it still takes years to construct or expand a major port, from the initial feasibility study to the point at which the first ship is received, and Beijing must build and maintain relationships with host governments throughout, creating longstanding ties on which China can lean. In this context, the U.S. and its allies must have the vision, patience, sources of capital, and long-term strategy to viably compete. The European Commission has already started taking a first step towards realizing this long-term vision, drafting an European Ports Strategy that was published in early March alongside an EU Industrial Maritime Strategy. This new strategy envisions “establishing guiding principles for EU funding” and “investments in third-country ports,” while also strengthening the competitiveness, security, and innovation of European Ports (European Commission 2026).
Drawn from the CPORTS 2.0 dataset, below are some of the ports in China’s financing pipeline, at the time of writing in early 2026. This list is not exhaustive, and some projects may never come to fruition—but it provides an indication of the geographic scope and ambition of China’s official port-building program.
Overseas ports projects under development or in China’s financing pipeline
In addition to ports which have committed financing, are currently being implemented, or have been completed, the CPORTS 2.0 dataset also captures pledged projects worth an additional $11.6 billion for 30 ports. These are projects that Chinese official sector entities have pledged to finance between 2000 and 2025. These include:
- Porto Sul, Brazil: In September 2017, a Chinese consortium agreed to own, develop, and arrange the financing of the Porto Sul deep-water port project, which would link the port with the Pedra de Ferro iron ore mine via the FIOL railway, a major under-construction cargo railway.
- Mongla Port, Bangladesh: During President Xi Jinping’s 2016 state visit to Bangladesh in October 2016, a Memorandum of Understanding (MOU) was signed to finance the expansion and modernization of Mongla Port facilities. In 2023, it was announced that China Eximbank had agreed in principle to finance the port expansion and modernization project. Then, in October 2023, the Chinese Embassy in Bangladesh urged the Government of Bangladesh to submit a formal application for a loan from China Eximbank for the expansion and modernization of Mongla Port. Then, on March 25, 2025, a key milestone was achieved: Mongla Port Authority (MPA) and China Civil Engineering Construction Corporation (CCECC) signed a commercial contract for the implementation of the project.
- Kyaukphyu Port, Myanmar: In 2009, Xi Jinping, then the Vice President of China, witnessed the signing of an MOU for the Kyauk Phyu Economic and Technological Development Zone, Deep Sea Port, and Railway Projects in Myanmar. China Eximbank pledged a loan to the Government of Myanmar to finance its acquisition of a 15% equity stake in Kyaukphyu Deepwater Port Project in 2018, but the project has been repeatedly delayed and halted.
- Hamdania Port, Algeria: In January 2016, the Transport Ministry of Algeria, China Harbor Engineering Company (CHEC), and China State Construction Engineering Corporation (CSCEC) signed an MOU to construct and develop the El Hamdania Deepwater Container Port Infrastructure Project. China Eximbank subsequently acknowledged that the project was under appraisal for a potential loan.
- Kisumu Port, Kenya: CGTN Africa, a media network owned by the Chinese government, reported as late as 2019 that the Export-Import Bank of China loaned $140 million USD to Kenya in 2017 for the construction of a modern port facility in Kisumu. In 2025, the Chinese ambassador to Kenya paid a visit to the port to continue exploring potential collaboration (Kenya News Agency 2025).
Beyond these projects that have secured pledges of financial support, there are several port projects that are proposed but have no active Chinese funding or commitments as of February 2026, as well as port projects with Chinese involvement outside the scope of the CPORTS 2.0 dataset (such as ports that are not supported by loan financing). Almost all of these newly-pledged or planned port projects combine seaport financing with critical mineral extraction, energy and heavy metal processing and export, or other co-located investments alongside the port. These include:
- San Juan de Marcona Port, Peru: In early 2024, as the first phase of construction at Chancay Port in Peru neared completion, it was announced that Chinese mining company Jinzhao Peru would construct and operate the Port of San Juan de Marcona in Peru—envisioned to become the third-largest port in the country.
- San Lorenzo Port, Honduras: In August 2023, China Harbour Engineering Company signed a contract with the Honduran company Empresa Nacional Portuaria (ENP) to modernize the San Lorenzo port, including a pier extension and dredging work, expected to cost around $150 million. China Eximbank agreed in principle to finance the project (Madrid 2024).
- Port of Sandino, Nicaragua: In March 2024, China CAMC Engineering Co., Ltd. (CAMCE) and Nicaragua’s Ministry of Finance signed a loan agreement worth nearly $30 million to construct three liquid petroleum gas (LPG) storage facilities at the Miramar fuel distribution plant near the Port of Sandino. Then, in January 2025, CAMCE and Nicaragua’s Empresa Portuaria Nacional (EPN) signed a commercial contract to improve the operational efficiency of the Port of Sandino, which is located on the Pacific coast. China’s Ambassador to Nicaragua visited the LPG storage facilities and the Port of Sandino in January 2026 (La Prensa 2026).
- Mubarak Al-Kabeer Port, Kuwait: In the early 2010s, it was announced that China and Kuwait would construct the Mubarak Al-Kabeer Port in Kuwait. Following multiple delays, China and Kuwait reached an agreement worth $4 billion, with China Communications Construction Company (CCCC) handling the engineering, procurement, and construction (EPC) of the port in late 2025.
- Arkhangelsk Port, Russia: In 2025, news media reported that Chinese carrier NewNew Shipping Lines would support the construction and expansion of the Port of Arkhangelsk near the White Sea (The Maritime Executive 2025).
- Port of Lobito, Angola: In early 2026, Sonangol Group announced plans to seek out a Chinese loan, with China Development Bank identified as a potential financier, worth up to $4.8 billion to finance the construction of a refinery at the port of Lobito (Reuters 2026). It remains to be determined whether this refinery will directly be located at the port, and whether it will also include a new export terminal or other port facility construction.
- Port of Qasim, Pakistan: In late 2025, China’s Shandong Xinxu Group, a clean-energy company specializing in batteries and nuclear waste, shared in a press release that they met with officials in Pakistan for the “Integrated Maritime Industrial Complex (IMIC)” project, which would include “the revival of the Iron Ore and Coal Berth (IOCB) Jetty, commonly referred to as the steel jetty, the establishment of shipbuilding and shipbreaking facilities, and the setting up of a steel mill integrated with port operations” (Pakistan Ministry of Information and Broadcasting 2025). It is unclear whether this revitalization at the Port of Qasim would include debt financing, and there has not been an announcement yet about an official deal or contract.
Overall, this report finds some 90 countries worldwide are beneficiaries of Chinese financing for seaport projects—ranging from the acquisition of an equity stake to the construction of a new port or provision of port equipment. Many of these countries have also received financing and investments from other major port companies and investors. For example, at the Port of Laem Chabang in Thailand, Chinese and Hong Kong companies like Hutchison Ports Thailand and COSCO are operating terminals, in addition to APM Terminals’ operation at the port.
Both public and private Chinese lenders finance a number of important ports in high-income countries. These include historically important harbors that remain at the heart of commercial activity and are the lifeblood of those host countries. At the same time, this study uncovers and tracks financing for a significant number of ports off the beaten path or in regions of the world that have received scant attention from Western policymakers—but where China is active and has established a long-lasting presence.
Compounding the dearth of bilateral engagement for ports from Western countries, multilateral lending portfolios have also been shrinking in countries where Chinese commercial actors (SOEs and private firms) are increasingly active. China is flooding the market in some places and crowding out demand for multilateral loans from other creditors and providers. The U.S. Development Finance Corporation (DFC) and other bilateral and multilateral agencies elsewhere must be funded, equipped, and given the mandate to be able to compete.
At the same time, Western powers cannot compete on everything, everywhere, and all at once. The U.S. and its allies must pick and choose areas of engagement, leveraging regional friends and allies. Policymakers must be empowered and informed to determine whether to prioritize ports at or near commercial and naval chokepoints; whether investing and lending agencies should prioritize financing ports that are commercial-only, could be dual use, or have entirely naval purposes; and how investments in ports infrastructure can or should be coupled with trade deals, greater economic integration, or security partnerships.
8.2 Port construction is just one piece of the puzzle, requiring holistic thinking
The U.S. and its allies lag across much of the commercial maritime domain, of which port construction and expansion is just one piece. Other areas where China excels include:
- Regional concentration. China’s regional concentration in parts of Europe, West and Central Africa, and Latin America allow it to drive down prices intra-regionally. COSCO owns shares in Antwerp, Hamburg, and Rotterdam, and “they are increasingly in a position to play these terminals off against one another in order to reduce the costs of using them,” according to an analysis by the Center for Eastern Studies (Popławski 2025).
- Port operations and shipping lines. This same Center for Eastern Studies report finds that Beijing’s grip on ports is enhanced by a strong Chinese presence in other parts of the maritime supply chain, in which COSCO, the world’s fourth-largest shipping company “...is not only a port operator but primarily a major provider of maritime transport and freight forwarding services, challenging Europe’s leading shipping lines…with such market strength, it is able to direct cargo flows towards preferred locations” (Popławski 2025). In Piraeus, China has majority control of the port authority—which is typically a quasi-governmental entity of the host nation-state—and thus has control over all its piers and terminals. In addition to offering relative speed, agility and large sources of capital for port construction or expansion, China’s comparative advantage is in being able to provide a package of port services to a client country. These are especially attractive to the governments of developing nations, where a port may be getting started from scratch, or significantly expanded. As the authors of this Anchoring Global Ambitions report discovered in conversation with leaders in the shipping industry, the presence of a sound port operator, as well as major shipping and logistics companies, is as important to the success of a port as its initial design, construction or expansion. Port operators and logistic firms will facilitate and encourage trade and ensure the port features on major shipping routes, connected to global networks. China has been adept at offering, through turnkey operations and joint ventures, a menu of services—investment financing, harbor construction, port equipment, and port operation once construction is complete.
- Port equipment and technology dependence. China’s enormous market share of manufacturing, as well as its provision of free logistics platforms like LOGINK, means some ports will be married to a closed, integrated ecosystem of highly automated Chinese port operating systems and hardware that are written to Chinese standards; financed, designed and operated by that Chinese entity; and effectively exclude products or services from rival countries or companies.
Whether through its massive shipbuilding program or its container traffic fees and rates, one of Beijing’s key advantages is to offer customers discounts and lower prices—and sometimes free products, like LOGINK. Yet China has competition. Western nations and allies are home to some of the world’s largest and most important shipping lines—including the Italian-Swiss MSC, Denmark’s Maersk, France’s CMA CGM, Germany’s Hapag-Lloyd, and Taiwan’s Evergreen—and China’s largest shipbuilding competitors are Japan and South Korea, two U.S. allies. Meanwhile, Silicon Valley remains a global leader in technological innovation.
Democratic nations could build an interoperable port network of their own, that would include common logistics standards and systems, and accompanying shoreside hardware. But the U.S. and its allies currently lack anything close to a cohesive strategy that would bind together friendly maritime nations with similar values, who favor open markets and open sea lanes and are willing to capitalize on these inherent advantages and economic clout.
8.3 Countries that host ports must be empowered to better screen investments
While this report focuses to a large degree on China’s global ports financing and great power competition for maritime dominance, it also emphasizes the agency that developing country governments have over whether, when, and how a port gets built. Major port projects funded by overseas creditors tend to generate significant media coverage and even political controversy in the countries where they are to be located. But recipient countries have considerable leverage when it comes to negotiating who they borrow from and generating more favorable terms and conditions for specific loan offers. These governments likely have more power than they think (and more power than they sometimes exercise) in the face of foreign lenders. Yet surprisingly, across nearly two decades of advising developing country governments, AidData has found that they are not always equipped with the data, inputs, technical capacity, or decision-making tools needed to make informed decisions about incoming infrastructure loan or grant offers (either new or re-negotiated) or understand the long-term impacts these loans may place on subsequent administrations or citizens of their country.[33]
Loans are complex financial instruments. The ways in which they are priced, presented, negotiated, and restructured are intricate, making them difficult to understand, interpret, and assess both qualitatively and quantitatively. These complexities constrain the abilities of government and debt management officials in borrower countries to evaluate and, even more importantly, compare sovereign loan proposals from creditors— undermining their negotiating power and limiting their capacity to secure more favorable terms that could save their countries potentially hundreds of millions of dollars. Such analyses can enable not only side-by-side comparisons of loan proposals, but also portfolio-level assessments of borrower country loan holdings to identify patterns in costs, risks, and sustainability that can inform future decision-making. As a result, there is a high level of unmet demand in borrower countries for data and tools that can support rigorous credit analysis and strengthen sovereign debt-related decision-making.
Figure 18. A proposed “Port Shopper Tool” to navigate port financing and deals
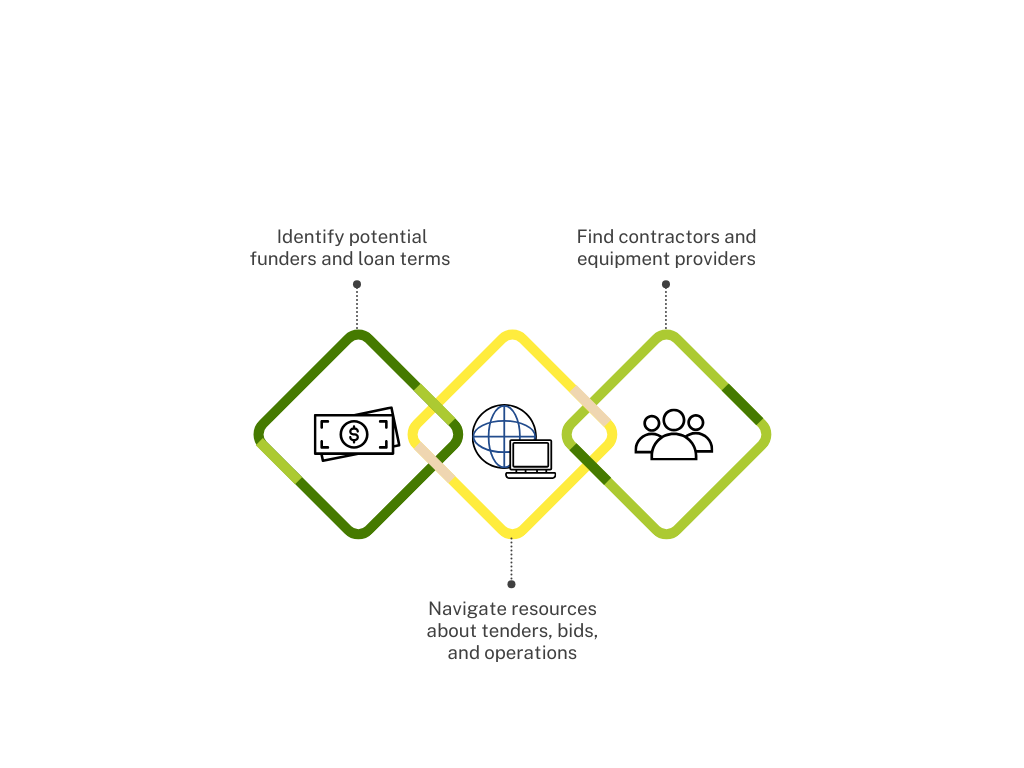
As a result, AidData has developed and piloted a “Credit Evaluation Tool” that would allow decision-makers and debt management officials in government line ministries to better assess competing, incoming infrastructure financing options across a range of variables and contract terms and conditions. A loan’s interest rate, maturity, grace period, disbursement schedule, principal repayment schedule, management fee, commitment fee, and insurance fee each have unique characteristics and calculation methods that together determine the full price or cost of the loan. In addition, non-financial and legal terms (including default clauses, repayment seniority, termination, enforcement, and confidentiality) further complicate the evaluation of a loan’s true cost and risk (Gelpern et al. 2023, 2025a, 2025b).[34]
AidData is considering the development of a related specialized and dedicated tool, based on the Credit Evaluation Tool, that would enable custom analysis of ports financing packages—essentially, a “Port Shopper Tool.” At present, developing country governments typically do not have access to such screening tools. In addition to offering a way to evaluate the sustainability of loans for port construction, modernization, and extension, this kind of tool could also provide a platform for borrowers to access resources on navigating open competitive bidding processes and connect with private and public financiers and port equipment and construction companies.
For developed countries, the challenge is of a different nature. As the authors of AidData’s Chasing China report discovered, Beijing appears to be taking steps to limit oversight, through measures such as routing funds through shell companies in offshore financial centers; requiring stringent confidentiality and non-disclosure agreements; outsourcing public-facing roles to non-Chinese entities; and pivoting toward more exotic credit instruments that are more expensive and difficult to track, but far less likely to appear in audited financial statements, stock exchange filings, and bond prospectuses (Parks et al 2025a). Investment Screening Mechanisms (ISMs)—like the U.S. Committee on Foreign Investments in the U.S. (CFIUS) or the Australian Foreign Investment Review Board (FIRB)—are valuable tools to vet and limit foreign investment in sensitive sectors, especially related to mergers and acquisitions.
However, not all countries employ extensive ISMs, especially in the transportation sector, which includes ports infrastructure—leaving a blind spot in studying and understanding the effects of port stake acquisitions. According to the Politics and Regulation Investment Screening Mechanisms (PRISM) dataset, only eight of the 18 countries that are in the PRISM dataset and are also captured in the CPORTS 2.0 dataset screen the transportation infrastructure sector: Australia, Israel, Mexico, Netherlands, New Zealand, Spain, and the United Kingdom. Mexico and Spain were the earliest countries to begin screening this critical sector in 2008, with the United States and Australia only starting to do so in the 2020s, according to the PRISM dataset (Bauerle Danzman and Meunier 2023).
8.4 Establish a taskforce or research center on China’s overseas seaports
2026 and 2027 will be critical years for maritime competition worldwide. Data, transparent and publicly available, will be critical for awareness and as a first line of defense. Yet significant data and evidence gaps currently exist that hamper a full understanding of the scale, scope, intent, and impacts of China’s overseas ports portfolio and its larger official lending and grant-giving, leaving a vacuum for speculation absent the facts. To help fill this gap, AidData maintains a year-round, multi-million-dollar, continuous effort to collect and code data tracking Chinese official overseas loans and grants that feeds into rigorous policy and scholarly research. AidData’s China research team comprises some 15 full-time faculty and staff and more than 120 research assistants. Other research organizations are conducting important work in this field as well, with some focused on shedding new light on particular sectors of Chinese overseas financing or specific geographies. However, there are currently no standardized data collection methods, definitions, or datasets across this research landscape. This creates a confusing environment for government agencies, international organizations, private sector businesses, and the media, who are left to their own devices to assess the usefulness and applicability of any given research report or dataset.
As a result, AidData is proposing to host an inter-disciplinary task force to bring together key players in the field to (1) quantify and better understand China’s overseas ports and maritime infrastructure footprint and (2) suggest and develop policies that may assist decision-makers in both developed and developing countries. Just as the recent U.S. push to improve its maritime strength and naval competitiveness is a whole-of-government effort, a “whole-of-research” effort is needed to collect and standardize data, terms, and definitions that will draw together researchers and policymakers across the domains of economic statecraft, trade, national and international security, diplomacy, and maritime law.
Features of this research task force would include:
- Working members drawn from government agencies, think tanks, academia, international organizations, and the private sector (including banks, port construction companies, shipbuilders, and shipping lines);
- Researchers and scholars working on key questions related to Chinese-funded ports seeking consensus on methodologies and data;
- Coordination and agreement on data sources, research parameters, methods, and definitions;
- Regular, unclassified reporting and convening, supported by the ongoing analysis efforts of taskforce members; abd
- Policy-oriented and action-focused recommendations and options.
AidData is acknowledged by many—in government, academia, and the media—as producing some of the most comprehensive and detailed data and analysis on China’s overseas lending and grant-giving operations. AidData’s datasets offer unusually broad geographic coverage, tracking official Chinese sources of aid and credit to some 217 countries and territories. AidData is based at William & Mary, a public university in Virginia and the home of a recently-announced “AUKUS Center of Excellence” (with other centers planned at Sheffield in the United Kingdom and at Adelaide in Australia). Located in Hampton Roads, close to the most important naval and shipbuilding facilities in the country, as well as a fast-growing commercial maritime hub, AidData and William & Mary could serve as a potentially useful gathering space for the work and conversations of a future taskforce.
9. References
Anselmo, Joelle. 2024. “White House Onshoring Cargo Crane Production.” Manufacturing Dive, February 29, 2024. https://www.manufacturingdive.com/news/white-house-onshoring-cargo-crane-production-china-zpmc-national-security/708668/.
ASCE. 2021. Report Card for America’s Infrastructure: Ports. Reston, VA: American Society of Civil Engineers. https://2021.infrastructurereportcard.org/cat-item/ports-infrastructure/.
Baird Maritime. 2024. “Russia, China to establish Arctic shipping joint venture.” Baird Maritime, June 10, 2024. https://www.bairdmaritime.com/shipping/boxships/russia-china-to-establish-arctic-shipping-joint-venture
Bassoli, Anna Matilde. 2025. “NATO’s Subsea Cable Strategy Turns Into a Catch-22.” RealClearDefense, October 24, 2025. https://www.realcleardefense.com/articles/2025/10/24/natos_subsea_cable_strategy_turns_into_a_catch-22_1142966.html.
Bauerle Danzman, Sarah, and Sophie Meunier. 2023. “Mapping the Characteristics of Foreign Investment Screening Mechanisms: The New PRISM Dataset.” International Studies Quarterly 67(2): June 2023. https://doi.org/10.1093/isq/sqad026.
Berg, Ryan C., Mark F. Cancian, and Joseph S. Bermudez Jr. et al. 2026. “Imagery from Venezuela Shows a Surgical Strike, Not Shock and Awe.” Center for Strategic and International Studies, January 9, 2026. https://www.csis.org/analysis/imagery-venezuela-shows-surgical-strike-not-shock-and-awe.
Berman, Jeff. 2026. “Port Tracker Report Calls for U.S. Import Declines over the First Half of 2026.” Logistics Management, February 9, 2026. https://www.logisticsmgmt.com/article/port_tracker_report_calls_for_u.s_import_declines_over_the_first_half_of_2026
Bluhm, Richard, Axel Dreher, Andreas Fuchs, Bradley C. Parks, Austin M. Strange, Michael J. Tierney 2025. “Connective financing: Chinese infrastructure projects and the diffusion of economic activity in developing countries.” Journal of Urban Economics 145: 103730.
Bonfatti, Roberto and Steven Poelhekke. 2017. “From Mine to Coast: Transport Infrastructure and the Direction of Trade in Developing Countries.” Journal of Development Economics 127 (C): 91-108.
Brady, Anne-Marie. 2019. “Facing Up to China’s Military Interests in the Arctic.” Jamestown Foundation. https://jamestown.org/facing-up-to-chinas-military-interests-in-the-arctic/.
Brasil Ministério dos Transportes. 2025. “Secretário Nacional de Transporte Ferroviário e delegação chinesa visitam obras da Fiol e Porto Sul, na Bahia.” Ministério dos Transportes, April 15, 2025. https://www.gov.br/transportes/pt-br/canais_atendimento/avisos-de-pauta/2025/04/secretario-nacional-de-transporte-ferroviario-e-delegacao-chinesa-visitam-obras-da-fiol-e-porto-sul-na-bahia.
Buckley, Chris, Agnes Chang, and Amy Chang Chien. 2026. “Thousands of Chinese Fishing Boats Quietly Form Vast Sea Barriers.” The New York Times, January 16, 2026. https://www.nytimes.com/interactive/2026/01/16/world/asia/china-ships-fishing-militia-blockade.html.
Burgess, Bryan, and Lea Thome. 2026. “China’s divorce from Venezuela wasn’t caused by the US. It already happened a decade ago.” AidData at William & Mary, January 16, 2026. https://www.aiddata.org/blog/chinas-divorce-from-venezuela-wasnt-caused-by-the-us.
Bunte, Jonas B., Harsh Desai, Kanio Gbala, Bradley C. Parks, and Daniel Runfola. 2018. “Natural Resource Sector FDI, Government Policy, and Economic Growth: Quasi-Experimental Evidence from Liberia.” World Development 107: 151-162. https://doi.org/10.1016/j.worlddev.2018.02.034.
Carney, Mark. 2026. “Davos 2026: Special address by Mark Carney, Prime Minister of Canada.” World Economic Forum, January 20, 2026. https://www.weforum.org/stories/2026/01/davos-2026-special-address-by-mark-carney-prime-minister-of-canada/.
Chancay Observatory. 2026. “Puerto de Chancay en su primer año: Conectado al mar, ¿de espaldas a la ciudad?” Universidad del Pacifico, January 2026. https://cechap.up.edu.pe/wp-content/uploads/InformeChancay-2.pdf
Chen, Keqin. 2012. “中国海军舰艇首访以色列 [Chinese naval vessels make their first visit to Israel].” CCTV News, August 15, 2012. https://news.cntv.cn/20120815/102481.shtml?
Chan, Edward Sing Yue. 2025. “China’s Perspective on the International Maritime Order.” Chinese Political Science Review. https://doi.org/10.1007/s41111-025-00313-2.
China Merchants Ports Holdings Co, Ltd. n.d. “Sri Lanka: Colombo International Container Terminals, Ltd.” China Merchants Ports Holdings Co, Ltd. https://www.cmport.com.hk/EnTouch/business/Infor.aspx?id=10005376
Corbeau, Anne-Sophie and Erica Downs. 2025. “What the Conflict in the Middle East Means for China’s Natural Gas Supply Security.” Center on Global Energy Policy at Columbia University, June 26, 2025. https://www.energypolicy.columbia.edu/what-the-conflict-in-the-middle-east-means-for-chinas-natural-gas-supply-security/.
CPPCC. 2020. “Liu Huaqing de Hangmu Meng [Liu Huaqing’s Aircraft Carrier Dream].” Chinese People’s Political Consultative Conference (CPPCC), May 7, 2020. http://www.cppcc.gov.cn/zxww/2020/05/08/ARTI1588900134352215.shtml.
Coorey, Phillip, and Laura Tingle. 2015. “’Let Us Know Next Time’: How Obama Chided Turnbull over Darwin Port Sale.” Australian Financial Review, November 18, 2015. https://www.afr.com/politics/let-us-know-next-time-how-obama-chided-turnbull-over-darwin-port-sale-20151118-gl1qkg.
Cordero, Mónica. 2025. “China Is Investing Billions in Latin America, Potentially Sidelining U.S. Farmers for Decades to Come.” Arkansas Advocate, December 29, 2025. https://www.agriculture.com/partners-china-is-investing-billions-in-latin-america-potentially-sidelining-u-s-farmers-for-decades-to-come-11876837.
Curtis, Laura. 2025. “US Probe of Maritime Chokepoints Sets Up Expanded Global Reach.” Bloomberg, March 14, 2025. https://www.bloomberg.com/news/articles/2025-03-14/us-probe-of-maritime-chokepoints-sets-up-expanded-global-reach.
Devyatkin, Patel. 2026. “Restraint and Diplomacy in Arctic Policy: Cooperation Amid U.S.-Russia-China Tensions.” Quincy Institute for Responsible Statecraft, January 27. https://quincyinst.org/research/restraint-and-diplomacy-in-arctic-policy-cooperation-amid-u-s-russia-china-tensions/.
Diario Rombe. 2024. “Operación Ceiba: secretos de la base militar china en Guinea Ecuatorial.” Diario Rombe. August 9, 2024. https://diariorombe.es/politica/operacion-ceiba-secretos-de-la-base-militar-china-en-guinea-ecuatorial/en-guinea-ecuatorial/
Dreher, Axel, Andreas Fuchs, Bradley Parks, Austin Strange, Michael J. Tierney. 2022. “Banking on Beijing: The Aims and Impacts of China’s Overseas Development Program. Cambridge University Press.
Dominion Terminal Associates. 2026. Facility & Operations. https://www.dominionterminal.com/facility-operations/.
Du, Wenlong. 2025. “歼‑20S亮相航展,指挥无人机猎杀预警机,开启 ‘忠诚僚机’时代.” Sina Finance (新浪财经), September 20, 2025. https://cj.sina.com.cn/articles/view/7295052889/1b2d1ac59020018gk4.
NU. CEPAL. 2023. “International Trade Outlook for Latin America and the Caribbean 2023.” United Nations Economic Commission for Latin America and the Caribbean. UN Symbol: LC/PUB.2023/16-P https://www.cepal.org/en/publications/68664-international-trade-outlook-latin-america-and-caribbean-2023-structural-change.
Economist Intelligence Unit. 2023. “China begins to unwind ban on Australian coal imports.” January 11, 2023. https://www.eiu.com/n/china-begins-to-unwind-ban-on-australian-coal-imports.
Edstrøm, Anders, Guðbjörg Ríkey Th. Hauksdóttir, and P. Whitney Lackenbauer. 2025. “Cutting Through Narratives on Chinese Arctic Investments.” Harvard Kennedy School, Belfer Center for Science and International Affairs. https://www.belfercenter.org/research-analysis/china-arctic-investments.
Escobar, Brooke, Ammar A. Malik, Sheng Zhang, Katherine Walsh, Alexandra Joosse, Bradley C. Parks, Jacqueline Zimmerman, and Rory Fedorochko. 2025. “Power Playbook: Beijing’s Bid to Secure Overseas Transition Minerals.” AidData at William & Mary. https://www.aiddata.org/publications/power-playbook-beijings-bid-to-secure-overseas-transition-minerals
Eurasian Resources Group. 2023. “ERG Commences the Construction of FIOL 1 Railway in Bahia, Capable of Transporting 60 mln Tons of Cargo Annually; Receives Endorsement from the President of Brazil.” News. July 7, 2023. https://www.eurasianresources.lu/en/news/ERG%20commences%20the%20construction%20of%20FIOL%201%20Railway%20in%20Bahia%2C.html.
European Commission. 2026. “Commission launches EU Industrial Maritime and Ports Strategies to boost competitiveness across the maritime sector.” European Commission, March 3, 2026. https://ec.europa.eu/commission/presscorner/detail/en/ip_26_484.
Fan, Wei, and Liu Xuanzun. 2025. “九三阅兵,新一代武器装备震撼亮相 [93rd Military Parade: New‑Generation Weapons Impress].” 新浪新闻 (Sina News), September 4, 2025. https://news.sina.com.cn/c/2025-09-04/doc-infphqmv8990587.shtml.
FMC. 2025. “FMC Launching Examination of Global Maritime Chokepoints.” U.S. Federal Maritime Commission, March 17, 2025. https://www.fmc.gov/articles/fmc-launching-examination-of-global-maritime-chokepoints/.
Foggo, James G. 2023. “Part I: Sundowning the Oliver Hazard Perry‑Class Frigate.” Center for Maritime Strategy, December 19, 2023. https://centerformaritimestrategy.org/publications/sundowning-the-oliver-hazard-perry-class-frigate/.
Forum for Economic and Trade Co-operation between China and Portuguese-speaking Countries (Macao). 2025. “Chinese company COFCO opens largest port export terminal in Brazil.” CLbrief, February 7, 2025. https://www.forumchinaplp.org.mo/en/economic_trade/view/8605.
Fritelli, John. 2023. U.S. Commercial Shipbuilding in a Global Context. CRS Report No. IF12534. Congressional Research Service. https://www.congress.gov/crs_external_products/IF/PDF/IF12534/IF12534.2.pdf.
Fravel, M. Taylor. 2016. “China's Changing Approach to Military Strategy: The Science of Military Strategy from 2001 and 2013.” Joe McReynolds, ed., The Evolution of China’s Military Strategy (Washington, DC: Brookings Forthcoming), MIT Political Science Department Research Paper No. 2016-15. https://papers.ssrn.com/sol3/papers.cfm?abstract_id=2774761.
Funaiole, P. Matthew, Hart, Brian, and Powers-Riggs, Aidan. 2025. “China Dominates the Shipbuilding Industry.” Center for Strategic and International Studies, March 25, 2025. https://www.csis.org/analysis/china-dominates-shipbuilding-industry.
Galanopoulos, Rebecca. 2026. “China’s State-Owned COSCO Tops Orderbook as Containers Reclaim First Place.” Veson Nautical, February 12, 2026. https://veson.com/blog/china-state-owned-cosco-tops-orderbook-as-containers-reclaim-first-place/.
Gardner, Alysha, Joyce Lin, Scott Morris, and Bradley Parks. 2020. “Bargaining with Beijing: A Tale of Two Borrowers.” Center for Global Development; AidData at William & Mary. Revised February 2021. https://www.aiddata.org/publications/bargaining-with-beijing-a-tale-of-two-borrowers.
Gelpern, Anna, Ommar Haddad, Sebastian Horn, Paulina Kintzinger, Bradley C. Parks, and Christoph Trebesch. 2025a. “How China Collateralizes.” AidData Working Paper #136. AidData at William & Mary. https://www.aiddata.org/publications/how-china-collateralizes
Gelpern, Anna, Ommar Haddad, Sebastian Horn, Paulina Kintzinger, Bradley C. Parks, and Christoph Trebesch. 2025b. “How China Lends 2.0: Introducing an extended dataset of 371 debt contracts.” AidData at William Mary. https://www.aiddata.org/publications/how-china-lends-2-0-research-brief
Gelpern, Anna, Sebastian Horn, Scott Morris, Bradley C. Parks, and Christoph Trebesch. 2023. “How China lends: a rare look into 100 debt contracts with foreign governments.” Economic Policy 38 (114): 345-416. https://academic.oup.com/economicpolicy/article/38/114/345/6827797
Gelpern, Anna, Ommar Haddad, Sebastian Horn, Paulina Kintzinger, Bradley C. Parks, and Christoph Trebesch. Forthcoming. “Flow Control: The Work of Collateral in Chinese Overseas Lending. Journal of International Economic Law.” https://doi.org/10.1093/jiel/jgaf052
Ghoshal, Debalina. 2020. “China’s Submarine Fleet in the Arctic.” European Security & Defence, February 14, 2020. https://euro-sd.com/2020/02/articles/16137/chinas-submarine-fleet-in-the-arctic/.
Glass, David. 2017. “Piraeus Port One of the Few Successes in Greek Privatisation Programme.” Seatrade Maritime, March 8, 2017. https://www.seatrade‑maritime.com/containers/piraeus‑port‑one‑of‑the‑few‑successes‑in‑greek‑privatiation‑programme.
Goldstein, Lyle J. 2019. “Chinese Nuclear Armed Submarines in Russian Arctic Ports? It Could Happen.” The National Interest, June 2, 2019. https://nationalinterest.org/feature/chinese-nuclear-armed-submarines-russian-arctic-ports-it-could-happen-60302.
Gomez. Sonha. 2024. “Rebuild the Merchant Marine.” U.S. Naval Institute Proceedings 150 (10): 1,460. https://www.usni.org/magazines/proceedings/2024/october/rebuild-merchant-marine.
Government of Pakistan. 2025. “China’s Shandong Xinxu Group Meets Maritime Minister Junaid Anwar Chaudhry on Port Qasim Mega Industrial Plan. Ministry of Education and Broadcasting, December 18, 2025. https://pid.gov.pk/site/press_detail/31379
Guimarães, Thayz. 2026. “China’s Latest Naval Moves in the Western Hemisphere Put Brazil in the Diplomatic Spotlight.” Atlantic Council, January 14, 2026. https://www.atlanticcouncil.org/dispatches/chinas-latest-naval-moves-in-the-western-hemisphere-put-brazil-in-the-diplomatic-spotlight/.
Gunnoe, Chase. 2022. “Overseas Demand for Metallurgical Coal Likely to Bolster U.S. Coal Carloadings.” Trains, January 27, 2022. https://www.trains.com/trn/news-reviews/news-wire/overseas-demand-for-metallurgical-coal-likely-to-bolster-u-s-coal-carloadings-in-2022-analysis/.
Hanbury, Shanna. 2025. “Brazil & China Move Ahead on 3,000‑km Railway Crossing the Amazon.” Mongabay, May 21, 2025. https://news.mongabay.com/short‑article/2025/05/brazil‑china‑move‑ahead‑on‑3000‑km‑railway‑crossing‑the‑amazon/.
Ho-Him, Han, Gabriela Sa Pessoa, and Megan Janetsky. 2026. “Takeaways from AP’s report on Latin American markets flooded by cheap Chinese goods.” Associated Press, February 2, 2026. https://apnews.com/article/china-latin-trump-trade-jinping-3bd62dd2d73ed711fa754ead1997634a
Humpert, Malte. 2025. “Russia to Earn $160bn in Taxes From Northern Sea Route by 2035, Arctic Region Accounts for 7.5 Percent of GDP.” High North News, May 19, 2025. https://www.highnorthnews.com/en/russia-earn-160bn-taxes-northern-sea-route-2035-arctic-region-accounts-75-percent-gdp.
Hiru News. 2023. “Chinese Research Vessel Shi Yan 6 to Dock in Colombo for Replenishments.” Hiru News, October 25, 2023. https://www.hirunews.lk/en/352229/chinese-research-vessel-shi-yan-6-to-dock-in-colombo-for-replenishments?#google_vignette
Hufbauer, Gary Clyde, and Ye Zhang. 2026. “Trump’s Trade War Wreaked Little Havoc on Trade Patterns Last Year.” RealTime Economics (PIIE), February 2, 2026. https://www.piie.com/blogs/realtime-economics/2026/trumps-trade-war-wreaked-little-havoc-trade-patterns-last-year
Huizenga, Bill. 2025. “Huizenga leads Bipartisan, Bicameral Introduction of Strategic Ports Reporting Act to Address Growing Economic & Military Threat from China.” Press release. February 27, 2025. https://huizenga.house.gov/news/documentsingle.aspx?DocumentID=404007
Industrial and Commercial Bank of China (ICBC). 2019. Khalifa Port Container Terminal 2, UAE. n.d. https://www.dropbox.com/scl/fi/69iejym3a8z08tts6muc3/Khalifa-Port-Container-Terminal-2-UAE.pdf?rlkey=f3855oqu04w7i2zwsya0gad13&e=3&dl=0.
International Monetary Fund. 2018. “2018 Article IV Consultation and Fourth Review Under the Extended Arrangement Under the Extended Fund Facility.” IMF Country Report No. 18/175. https://www.imf.org/-/media/files/publications/cr/2018/cr18175.pdf
Kardon, Isaac B. and Wendy Leutert. “Pier Competitor: China's Power Position in Global Ports.” International Security 46 (4): 9-47. https://direct.mit.edu/isec/article-abstract/46/4/9/111175/.
Jinping, Xi. 2019. “Árthro: Sí Tzinpíng stin ‘K’: Eíthe i sofía ton archaíon politismón na fotísei to méllon [Article: Xi Jinping in ‘K’: May the Wisdom of Ancient Civilizations Illuminate the Future].” Kathimeriní, November 10, 2019. https://www.kathimerini.gr/politics/1051060/arthro-si-tzinpingk-stin-k-eithe-i-sofia-ton-archaion-politismon-na-fotisei-to-mellon/.
Mahandara, Chris. 2025. “Chinese Envoy Visits Kisumu Inland Port, Explores Investment Opportunities.” Kenya News Agency, June 3, 2021. https://www.kenyanews.go.ke/chinese-envoy-visits-kisumu-inland-port-explores-investment-opportunities/.
Koutantou, Angeliki. 2021. “Greece Completes Transfer of 16% Stake in Piraeus Port to COSCO.” Reuters, October 7, 2021. https://www.reuters.com/article/markets/asia/greece-completes-transfer-of-16-stake-in-piraeus-port-to-cosco-idUSKBN2GX1OU/.
La Prensa. 2026. Cómo una foto del embajador chino deja en evidencia el fiasco sobre la construcción de aeropuerto de Punta Huete. La Prensa, February 6, 2026. https://www.laprensani.com/2026/02/06/economia/3621433-como-una-foto-del-embajador-chino-deja-en-evidencia-el-fiasco-sobre-la-construccion-de-aeropuerto-de-punta-huete
LaGrone, Sam. 2025. “Navy Cancels Constellation‑class Frigate Program, Considering New Small Surface Combatants.” USNI News, November 25, 2025. https://news.usni.org/2025/11/25/navy-cancels-constellation-class-frigate-program-considering-new-small-surface-combatants.
Li, Xueke, and Amanda H. Lynch. 2023. “New insights into projected Arctic sea road: operational risks and implications.” Climatic Change 176 (30). https://doi.org/10.1007/s10584-023-03505-4.
Liu, Xuanzun, and Rui Liang. 2025. “China’s Newly Modified Version of Type 052D Destroyer Joins Training Exercises.” Global Times, June 2, 2025. https://www.globaltimes.cn/page/202506/1335254.shtml.
Liu, Zhen. 2025. “Landmark Launch for China’s J‑35 Stealth Jet from Fujian Aircraft Carrier.” South China Morning Post, September 22, 2025. https://www.scmp.com/news/china/military/article/3326424/landmark-launch-chinas-j-35-stealth-jet-fujian-aircraft-carrier.
Lloyd’s List. 2024. “One Hundred Ports 2024.” Lloyd’s List. https://www.lloydslist.com/one-hundred-container-ports-2024.
Lubold, Gordon and Warren P. Strobel. 2021. "Secret Chinese Port Project in Persian Gulf Rattles U.S. Relations With U.A.E.". Wall Street Journal, November 19, 2021. https://www.wsj.com/politics/national-security/us-china-uae-military-11637274224.
Luck, Alex. 2024. “Chinese Navy Testing Laser Turret on Type 071 LPD.” Naval News, August 23, 2024. https://www.navalnews.com/naval-news/2024/08/chinese-navy-testing-laser-turret-on-type-071-lpd/.
Luck, Alex. 2025. “Chinese Navy Takes Aircraft Carrier Fujian Into Active Service in Hainan.” Naval News, November 7, 2025. https://www.navalnews.com/naval-news/2025/11/chinese-navy-takes-aircraft-carrier-fujian-into-active-service-in-hainan/.
Madrid, Yarely. 2024. Empresa Portuaria de Honduras blinda de secretismo acuerdo con empresa China. Expediente Público, April 2, 2024. https://www.expedientepublico.org/empresa-portuaria-de-honduras-blinda-de-secretismo-acuerdo-con-empresa-china/
Majid, Puteri. 2026. “China’s Dec met coal imports rise 28% MOM to 13.8 mil mt.” S&P Global Commodity Insights, January 21, 2026. https://www.spglobal.com/energy/en/news-research/latest-news/metals/012126-chinas-dec-met-coal-imports-rise-28-mom-to-138-mil-mt
Massachusetts Maritime Academy. 2026. “Mass Maritime Receives $5.8 M Grant to Develop/Train Shipbuilding Workforce.” The Maritime Executive, January 17, 2026. https://maritime-executive.com/corporate/mass-maritime-receives-5-8-m-grant-to-develop-train-shipbuilding-workforce.
Mazzucco, Leonardo Jacopo Maria. 2025. “China’s Basing Quest in the Gulf: Pipe Dream or Strategic Reality?” Atlantic Council, June 13, 2025. https://www.atlanticcouncil.org/blogs/menasource/chinas-basing-quest-in-the-gulf-pipe-dream-or-strategic-reality/.
McIlroy, Tom. 2026. “China’s Ambassador Warns Albanese Reclaiming Port of Darwin Will Force Beijing to Intervene.” The Guardian, January 28, 2026. https://www.theguardian.com/australia-news/2026/jan/28/china-ambassador-xiao-qian-port-darwin-warning.
Milman, Oliver. “Arctic endured year of record heat as climate scientists warn of ‘winter being redefined.’” The Guardian, December 16, 2025. https://www.theguardian.com/world/2025/dec/16/artic-record-heat-shrunken-sea-ice-report.
Ministry of Commerce of the People’s Republic of China (MOFCOM). 2009. “A strategic leap westward 1,000 kilometers: A new trade strategy for Yunnan’s Two Oceans Land Bridge.” Ministry of Commerce of the People’s Republic of China, November 25, 2009. https://interview.mofcom.gov.cn/detail/201605/1457.html.
Ministry of National Defense of the People’s Republic of China. 2015. “How great are the risks of the "Maritime Silk Road" today?” February 11, 2015. http://www.81.cn/jwgd/2015-02/11/content_6351319_5.htm.
Ministry of National Defense of the People’s Republic of China. 2019. “Bering Strait: “The Malacca of the North.” July 31, 2019. http://www.81.cn/jfjbmap/content/1/2019-07/31/10/2019073110_pdf.pdf.
Ministry of National Defense of the People’s Republic of China. 2021. “US sends unmanned technology task force to Middle East.” September 15, 2021. http://www.81.cn/gfbmap/content/2021-09/15/content_299099.htm.
Ministry of National Defense of the People’s Republic of China. 2023. “Overview of Chinese personnel evacuation from Sudan by PLA Navy.” May 5, 2023. http://eng.mod.gov.cn/xb/News_213114/Features/16222977.html.
Ministry of National Defense of the People’s Republic of China. 2024a. “Chinese naval hospital ship makes maiden visit to Benin.” Ministry of National Defense of the People’s Republic of China, October 18, 2024. http://eng.mod.gov.cn/xb/News_213114/TopStories/16346222.html.
Ministry of National Defense of the People’s Republic of China. 2024b. “Chinese naval hospital ship Peace Ark visits Sri Lanka.” Ministry of National Defense of the People’s Republic of China, December 21, 2024. http://eng.mod.gov.cn/xb/MilitaryServices/News_213106/16360290.html.
Ministry of National Defense of the People’s Republic of China. 2025a. “PLAN Hospital Ship Silk Road Ark Sets Sail for Mission Harmony in the South Pacific and Latin America.” Ministry of National Defense of the People’s Republic of China, September 12, 2025. http://eng.mod.gov.cn/xb/Home/Focus/16409302.html.
Ministry of National Defense of the People’s Republic of China. 2025b. “中国海军989编队抵达越南进行友好访问.” Ministry of National Defense of the People’s Republic of China, November 21, 2025. http://www.mod.gov.cn/gfbw/jswj/cf/16423271.html.
Ministry of National Defense of the People’s Republic of China. 2025c. “中国海军989编队抵达马来西亚进行友好访问.” Ministry of National Defense of the People’s Republic of China, November 29, 2025. http://www.mod.gov.cn/gfbw/jswj/cf/16424395.html.
Ministry of National Defense of the People’s Republic of China. 2025d. “海军989编队抵达印度尼西亚进行友好访问.” Ministry of National Defense of the People’s Republic of China, December 8, 2025. http://www.mod.gov.cn/gfbw/jswj/cf/16425918.html.
National Energy Administration of the People’s Republic of China. 2012. “China-Russia crude oil pipeline opens a new energy channel.” National Energy Administration, September 11, 2012. https://www.nea.gov.cn/2012-09/11/c_131841879.htm.
NOAA. 2025. Arctic Report Card 2025. Washington, DC: U.S. National Oceanic and Atmospheric Administration (NOAA). https://arctic.noaa.gov/report-card/report-card-2025/.
Nuclear Threat Initiative. 2025. China Submarine Capabilities. Part of the Submarine Proliferation Resource Collection. Washington, DC: Nuclear Threat Initiative. November 19, 2025. https://www.nti.org/analysis/articles/china-submarine-capabilities/.
Orf, Darren. 2024. “By 2100, the Northern Sea Route Will Be Navigable Year-Round. That Changes Everything.” Popular Mechanics, August 5, 2024. https://www.popularmechanics.com/science/environment/a61754915/northern-sea-route-year-round-navigation-climate-change/.
Ogryzko, Lesia and Alberto Rizzi. 2025. Shallow Seas and Shadow Fleets: Europe’s Undersea Infrastructure Is Dangerously Vulnerable.” European Council on Foreign Relations, April 8, 2025. https://ecfr.eu/article/shallow-seas-and-shadow-fleets-europes-undersea-infrastructure-is-dangerously-vulnerable/.
O’Rourke, Ronald. 2025. China Naval Modernization: Implications for U.S. Navy Capabilities—Background and Issues for Congress. CRS Report RL33153. Washington, DC: Congressional Research Service. https://sgp.fas.org/crs/row/RL33153.pdf.
Pascarella, Enrico. 2025. “China takes the Arctic route: first ship set to arrive in Europe via the Northern Passage.” EUnews, September 18, 2025. https://www.eunews.it/en/2025/09/18/china-takes-the-arctic-route-first-ship-set-to-arrive-in-europe-via-the-northern-passage/.
Parks, Bradley, Ammar A. Malik, and Alex Wooley. 2022. “Is Beijing a predatory lender? New evidence from a previously undisclosed loan contract for the Entebbe International Airport Upgrading and Expansion Project.” AidData at William & Mary.
Parks, Bradley C., Ammar A. Malik, Brooke Escobar, Sheng Zhang, Rory Fedorochko, Kyra Solomon, Fei Wang, Lydia Vlasto, Katherine Walsh, and Seth Goodman. 2023. “Belt and Road Reboot: Beijing’s Bid to De-Risk Its Global Infrastructure Initiative.” AidData at William & Mary.
Parks, Bradley C., Sheng Zhang, Brooke Escobar, Katherine Walsh, Rory Fedorochko, Lydia Vlasto, Jacqueline Zimmerman, Julie Sickell, Emma Bury, Ameya Joshi, Lea Thome, Oshin Pandey, and Pavan Raghavendra Raja Manuri Venkata. 2025a. “Chasing China: Learning to Play by Beijing's Global Lending Rules.” AidData at William & Mary.
Parks, Bradley C., Brooke Escobar, Katherine Walsh, Sheng Zhang, Rory Fedorochko, Lydia Vlasto, Julie Sickell, Sailor Miao, Emma Bury, Jacqueline Zimmerman, Samantha Custer, Axel Dreher, Lukas Franz, Andreas Fuchs, Sebastian Horn, Ammar A. Malik, Carmen M. Reinhart, Austin Strange, Michael J. Tierney, and Christoph Trebesch. 2025b. “Tracking Loans and Grants from China to Low-, Middle-, and High-Income Countries: An Application of AidData’s TUFF 4.0 Methodology.” AidData at William & Mary.
Permanent Mission of the People’s Republic of China to the UN. 2022. “Foreign Ministry Spokesperson Wang Wenbin’s Regular Press Conference on August 16, 2022.” Permanent Mission of the People’s Republic of China to the UN. August 16, 2022. https://un.china-mission.gov.cn/eng/fyrth/202208/t20220816_10744243.htm.
Phillips, Michael. M. 2024. “U.S.-China Tensions Have a New Front: A Naval Base in Africa.” Wall Street Journal. February 10, 2024. https://www.wsj.com/world/africa/u-s-china-tensions-have-a-new-front-a-naval-base-in-africa-616e9e77
Popławski, Konrad. 2025. “Turning the Tide: The U.S. Pushes Back Against Chinese Influence in European Ports.” Center for Eastern Studies (OSW), OSW Commentary, March 17, 2025. https://www.osw.waw.pl/en/publikacje/osw-commentary/2025-03-17/turning-tide-us-pushes-back-against-chinese-influence-european.
Port de Barcelona. 2025. “The ports of Barcelona and Shanghai sign an agreement to strengthen their relationship and create a green corridor.” Port de Barcelona, August 4, 2025. https://www.portdebarcelona.cat/en/communication/news/ports-barcelona-and-shanghai-sign-agreement-strengthen-their-relationship-and-create-green-corridor.
Puranen, Matti, and Sanna Kopra. “China’s Arctic Strategy – a Comprehensive Approach in Times of Great Power Rivalry.” Scandinavian Journal of Military Studies 6, (1): 239-253. https://sjms.nu/articles/10.31374/sjms.196.
Reuters. 2025. “Company launches China-Europe shipping route, Global Times says.” Reuters, September 22, 2025. https://www.reuters.com/sustainability/climate-energy/company-launches-china-europe-shipping-route-global-times-says-2025-09-22/.
Reuters, 2026. “Angola’s state oil firm Sonangol seeks $4.8 billion loan from China for refinery.” Reuters, February 25, 2026. https://www.reuters.com/business/energy/angolas-state-oil-firm-sonangol-seeks-48-billion-loan-china-refinery-2026-02-25/.
Sadler, Brent. 2025. “America’s Local Shipyards Should Self-Nominate As ‘Maritime Prosperity Zones’.” The Heritage Foundation, November 20, 2025. https://www.heritage.org/defense/commentary/americas-local-shipyards-should-self-nominate-maritime-prosperity-zones
Sadler, Brent. 2025. “America’s Maritime Revival: Sailing Into Some Headwinds.” The Heritage Foundation, October 2, 2025. https://www.heritage.org/defense/commentary/americas-maritime-revival-sailing-some-headwinds.
Sadler, Brent. 2025. Reviving America’s Maritime Strength: Comprehensive by Necessity. Backgrounder No. 3918, The Heritage Foundation, July 24, 2025. https://www.heritage.org/sites/default/files/2025-07/BG3918.pdf.
Schrader, Esther. 2025. “Trade, Tariffs, Rerouting, and Uncertainty.” Harvard Business School, Institute for Business in Global Society, October 28, 2025. https://www.hbs.edu/bigs/trade-tariffs-rerouting-and-uncertainty.
Schuler, Mike. 2026. “Tariff Uncertainty Poised to Cut U.S. Container Imports in Early 2026.” gCaptain, February 9, 2026. https://gcaptain.com/tariff-uncertainty-poised-to-cut-u-s-container-imports-in-early-2026/
Singleton, Craig. 2023. “China’s Military Is Going Global.” Guest Essay. The New York Times, September 7, 2023. https://www.nytimes.com/2023/09/07/opinion/china-military-strategy-global.html.
Soni, Paroma and Catherine Allen. 2026. “5 charts show China’s oil dilemma after US strikes.” Politico, March 2, 2026. https://www.politico.com/news/2026/03/02/iran-us-strikes-china-oil-supply-charts-00806415.
Starbroek News. 2019. “Historic draw of first oil arrives.” Starbroek News, December 21, 2019. https://www.stabroeknews.com/2019/12/21/news/guyana/historic-draw-of-first-oil-arrives/.
State Council Information Office of the People’s Republic of China. 2018. Full text: China’s Arctic Policy. Beijing: State Council Information Office, January 26, 2018. https://english.www.gov.cn/archive/white_paper/2018/01/26/content_281476026660336.htm.
State Council Information Office of the People’s Republic of China. 2025. China’s National Security in the New Era. Beijing: State Council Information Office, May 12, 2025. http://www.scio.gov.cn/zfbps/zfbps_2279/202505/t20250512_894771.html.
Sun, Degang, and Yahia H. Zoubir. 2021. “Securing China’s ‘Latent Power’: The Dragon’s Anchorage in Djibouti.” Journal of Contemporary China 30 (130): 677–92 .https://www.tandfonline.com/doi/full/10.1080/10670564.2020.1852734.
The Coal Hub. 2024. “Coal imports: Indonesia is still the top supplier of coal to China.” The Coal Hub, February 13, 2024. https://thecoalhub.com/coal-imports-indonesia-is-still-the-top-supplier-of-coal-to-china.html.
The Maritime Executive. 2023. “American Ports Dismiss Chinese Spy Cranes as Media Sensationalism.” The Maritime Executive, March 10, 2023. https://maritime-executive.com/article/american-ports-dismiss-chinese-spy-cranes-as-media-sensationalism.
The Maritime Executive. 2025. “Chinese Carrier May Invest up to $2.5B in Russia’s Port of Arkhangelsk.” The Maritime Executive, July 28, 2025. https://maritime-executive.com/article/chinese-carrier-may-invest-up-to-2-5b-in-russia-s-port-of-arkhangelsk.
The Trade Practitioner. 2019. “CFIUS Clearance; Mitigation: COSCO SHIPPING Holdings, and Orient Overseas (International).” May 1, 2019. https://www.tradepractitioner.com/2019/05/cosco-shipping-orient-overseas-international/.
The White House. 2025. “Restoring America’s Maritime Dominance.” April 9, 2025. https://www.whitehouse.gov/presidential-actions/2025/04/restoring-americas-maritime-dominance/.
The White House. 2026. “America’s Maritime Action Plan.” The White House, 2026. https://www.whitehouse.gov/maritimemight/
Thorsson, Elías. 2025. “China’s Arctic investments exaggerated, Harvard report finds.” ArcticToday, June 24, 2025. https://www.arctictoday.com/chinas-arctic-investments-exaggerated-harvard-report-finds/.
Thome, Lea. 2024. “Chancay Port Opens as China’s Gateway to South America.” AidData at William & Mary, November 14, 2024. https://www.aiddata.org/blog/chancay-port-opens-as-chinas-gateway-to-south-america
Thome, Lea. 2025a. “China’s Global Scanner Dissemination.” AidData at William & Mary, February 20, 2025. https://www.aiddata.org/blog/chinas-global-scanner-dissemination.
Thome, Lea. 2025b. “How China is Financing its Domestic Shipbuilding and Vessel Acquisition Industry.” AidData at William & Mary, April 24, 2025. https://www.aiddata.org/blog/how-china-is-financing-its-domestic-shipbuilding-and-vessel-acquisition-industry.
Thome, Lea, and Mark Kennedy. 2026. “Ports of Power: China’s Growing Maritime Network of Ports, Bases, and Dual-Use Facilities.” Center for Maritime Strategy, February 25, 2026. https://centerformaritimestrategy.org/publications/ports-of-power-chinas-growing-maritime-network-of-ports-bases-and-dual-use-facilities/.
Papachristou, Harry, and Karen Ng. 2025. “Chinese shipping firm eyes investing $2.5bn in Russian Northern Sea Route port.” TradeWinds, July 28, 2025. https://www.tradewindsnews.com/ports/chinese-shipping-firm-eyes-investing-2-5bn-in-russian-northern-sea-route-port/2-1-1850722.
U.S. Coal Exports. 2023. “Hampton Roads Coal Exports Rise Again.” June 22, 2023. https://uscoalexports.org/2023/06/22/hampton-roads-coal-exports-rise-again/
U.S. Coal Exports. 2025. “Hampton Roads Coal Exports Inch Up in December.” February 4, 2025. https://uscoalexports.org/2025/02/04/hampton-roads-coal-exports-inch-up-in-december/
U.S. Congress. 119th Cong., 2025–2026. S. 2296, National Defense Authorization Act for Fiscal Year 2026. Washington, DC: Government Publishing Office. https://www.congress.gov/bill/119th-congress/senate-bill/2296.
U.S. Department of Labor. 2025. Revitalizing Domestic Manufacturing by Developing the Next Generation of America’s Shipbuilders through International Partnerships. FOA-ILAB-25-45. Washington, DC: U.S. Department of Labor. https://grants.gov/search-results-detail/360093.
U.S. Department of Defense. 2025. Report to Congress on Military and Security Developments Involving the People’s Republic of China 2025. Washington, DC: U.S. Department of Defense. https://media.defense.gov/2025/Dec/23/2003849070/-1/-1/1/ANNUAL-REPORT-TO-CONGRESS-MILITARY-AND-SECURITY-DEVELOPMENTS-INVOLVING-THE-PEOPLES-REPUBLIC-OF-CHINA-2025.PDF
U.S. Department of Transportation, Maritime Administration (MARAD). 2025. U.S. Maritime Advisory 2025‑006: Worldwide Foreign Adversarial Technological, Physical, and Cyber Influence. Washington, DC: U.S. Department of Transportation. https://www.maritime.dot.gov/msci/2025-006-worldwide-foreign-adversarial-technological-physical-and-cyber-influence.
U.S. Department of Transportation, Maritime Administration (MARAD). 2025. Port Infrastructure Development Program (PIDP). Washington, DC: U.S. Department of Transportation. https://www.maritime.dot.gov/PIDPgrants
U.S. Energy Information Administration. 2019. “Today in Energy.” https://www.eia.gov/todayinenergy/detail.php?id=3830
U.S. House Committee on Homeland Security. 2023. “Chairmen Green, Gallagher Slam DHS’s Silence.” May 12, 2023. https://homeland.house.gov/2023/05/12/chairmen-green-gallagher-slam-dhss-silence-demand-answers-on-threats-posed-by-chinese-manufactured-cranes-at-u-s-ports/.
U.S. International Development Finance Corporation (DFC). 2023. “DFC Commits $125 Million to Modernize Elefsina Shipyard in Greece, Establish Critical Energy Supply Hub in the Mediterranean.” Press release, Washington DC: DFC. Accessed on October 4, 2025 at https://www.dfc.gov/media/press-releases/dfc-commits-125-million-modernize-elefsina-shipyard-greece-establish-critical
U.S. International Development Finance Corporation (DFC). 2024. Initial Project Summary – Onex Elefsis Shipyards Project. Washington DC: DFC. Accessed on October 4, 2025 at https://www3.dfc.gov/environment/eia/elefsina/Initial_Project_Summary.pdf
U.S. International Development Finance Corporation (DFC). 2025. Modernizing a Greek shipyard critical to U.S. strategic interests. Washington DC: DFC. Accessed on 4 October 2025 at https://www.dfc.gov/investment-story/modernizing-greek-shipyard-critical-us-strategic-interests
Walsh, Katherine, Brooke Escobar, Sheng Zhang, Jacqueline Zimmerman, Lydia Vlasto, Sailor Miao, Ameya Joshi, Emma Bury, and Ammar A. Malik. 2026. “Tracking China’s Transition Mineral Financing: Methodology and Approach, Version 2.0.” AidData at William & Mary.
Wang, Howard, and Nathan Beauchamp‑Mustafaga. 2024. Not Ready for a Fight: Chinese Military Insecurities for Overseas Bases in Wartime. RR‑A1800‑2. Santa Monica, CA: RAND Corporation. https://www.rand.org/pubs/research_reports/RRA1800-2.html.
Weisko, Paul. 2026. “A New Chapter for the Northern Sea Route.” Institute for National Security Studies, January 26, 2026. https://www.inss.org.il/publication/northern-sea-route/.
Wooley, Alexander, Sheng Zhang, Rory Fedorochko, and Sarina Patterson. 2023. “Harboring Global Ambitions: China’s Ports Footprint and Implications for Future Overseas Naval Bases.” AidData at William & Mary. https://www.aiddata.org/publications/harboring-global-ambitions.
World Steel Association. 2025. World Steel in Figures 2025. Brussels, Belgium: World Steel Association. https://worldsteel.org/data/world-steel-in-figures/world-steel-in-figures-2025/.
Xiao, Tianliang, ed. Science of Military Strategy 2020. Translated by the China Aerospace Studies Institute. Beijing, China: National Defense University Press, 2020. https://www.airuniversity.af.edu/Portals/10/CASI/documents/Translations/2022-01-26%202020%20Science%20of%20Military%20Strategy.pdf.
Xinhua. 2025. “China builds 60 automated container terminals, leads global smart port construction.” State Council of the People’s Republic of China, October 17, 2025, https://english.www.gov.cn/news/202510/17/content_WS68f23149c6d00ca5f9a06de2.html.
Yang, Feng. 2025. “绕开055大驱,燎原-1激光武器为何率先部署在071登陆舰” 网易新闻 (Wangyi Xinwen, NetEase News), October 10, 2025. https://www.163.com/dy/article/KBHQV4210553JHXF.html.
Yang, Jiejin. “The future of ports is in Tianjin, China.” Huawei, n.d. https://www.huawei.com/en/media-center/transform/21/16-tianjin-port.
Zhao, Pengjun, Yunlin Li, and Yu Zhang. “Ships are projected to navigate whole year-round along the North Sea route by 2100.” Communications Earth & Environment 5, 407 (2024). https://www.nature.com/articles/s43247-024-01557-7.
Zhao, Yusha. 2025. “China, Brazil Sign MoU to Conduct Feasibility Study for Transcontinental Railway Project: Brazilian Ministry.” Global Times, July 9, 2025. https://www.globaltimes.cn/page/202507/1337961.shtml.
10. Appendix: Methodology
For the purposes of this analysis, we sought to identify the universe of projects and activities financed by Chinese state-owned entities in 90 low-, middle- and high-income countries for ports construction and expansion, as well as ports equipment and related infrastructure, over a 26-year period from 2000 to 2025. Our data and analysis do not capture ports exclusively funded through equity investments from official sector or private sector entities in China. However, many ports are financed with a mix of aid, debt and equity—and such ports are captured here, so long as they received at least one grant or loan commitment from an official sector entity in China.
The resulting Chinese-Financed Ports Overseas and Related Terminals Dataset, Version 2.0 (CPORTS 2.0) consists of 363 projects and activities for 168 ports in 90 countries. 47 official sector lenders and donors from China provided $23.9 billion in loans and grants for these projects and activities between 2000 and 2025. 66 Chinese companies and 117 non-Chinese companies were responsible for implementing these projects and activities. The CPORTS 2.0 dataset also includes the latitude-longitude coordinates of the project/activity locations, as well as a precision marker for those coordinates to indicate whether the geolocation is precise or approximate.
10.1 Compilation of the dataset
First, we began with records captured by the earlier 1.0 version (China's Official Seaport Finance Dataset, 2000-2021) of the CPORTS dataset. We then applied a string detection technique to search for additional records in AidData’s China’s Global Loans and Grants Dataset, Version 1.0 (CLG-Global 1.0), which captures 33,580 projects financed by Chinese state-owned entities between 2000 and 2023 (Parks et al. 2025a). We did so by compiling a list of keywords (“strings”)—including port, terminal, wharf, harbor, pier, dock, jetty, naval, and variations thereof—and automatically identifying projects and activities in the CLG-Global 1.0 dataset with a “description” field containing one or more of these pre-specified keywords. For more on the 4.0 version of the Tracking Underreported Financial Flows (TUFF) methodology that was used to assemble the CLG-Global 1.0 dataset, see Parks et al. (2025b). We also relied on our previous research published on China’s scanner dissemination to identify additional port equipment projects and activities for inclusion in CPORTS 2.0, expanding the scope of our dataset (Thome 2025b). Finally, we manually reviewed each of the corresponding record descriptions to eliminate false positives (i.e., those projects and activities not directly related to ports infrastructure).
10.2 Port equipment methodology
To code and capture China’s official sector financial commitments for the acquisition, installation, and use of seaport equipment, we applied an equal contribution principle unless a specific financial amount was specified for port equipment like scanners and cranes. Some records capture equipment for airports and other customs-related ports, in addition to seaports. In these cases, we assumed equal contributions across all facilities and then removed non-seaport facilities from the dataset and estimated financial commitment amounts. For these records, we have set the “seaport_amount_estimate” field for yes, as we estimate an equal contribution for these equipment records and activities. Multiple equipment records and activities may have the same “aiddata_record_id” if we manually split the “seaport_amount” columns to ensure that each “port_name” cell only has one port name, rather than multiple ports.
10.3 Methodology notes
The CPORTS 2.0 dataset (2000-2025) tracks 363 port projects and activities supported by grant and loan commitments worth $23.9 billion, while the 1.0 version (2000-2021) tracked 123 projects and activities supported by grant and loan commitments worth $29.9 billion. The aggregate value of the financial commitments captured by the CPORTS 2.0 dataset decreased, despite the number of records more than doubling, due to a methodological change: the latest version of the CPORTS dataset focuses on financial commitments that can be confirmed only for port construction and expansion and port equipment.
To avoid overestimation, we exclude all financial commitments from the 2.0 dataset that we cannot confidently attribute to a port project or activity. The Yamal LNG Project in Russia, which includes port infrastructure at Sabetta and liquid natural gas (LNG) production assets, received some $14.9 billion in financial commitments from Chinese state-owned creditors, but we are unable to determine the specific amount that was earmarked for the Sabetta seaport component of the project. Similar challenges occur for China’s official sector financial commitments for the Port of Morébaya in Guinea and a handful of small scanner donations to various ports. If we include all financial commitments for the Port of Sabetta and the Port of Morébaya (i.e., commitments that supported port infrastructure and mine infrastructure) and other excluded commitments in our analysis, China’s official sector financing for port projects and activities reaches almost $43.7 billion between 2000 and 2025.[35]
Some records capture the construction of multiple (seaport and non-seaport) infrastructure assets. Unless the percentage of the overall financial commitment that was earmarked for the seaport component of a larger infrastructure project/activity is known, these records were excluded from our analysis (by setting the “seaport_recommended_for_aggregates” field to No), although they are still included in the CPORTS 2.0 dataset for qualitative analysis. The following record identification numbers capture the excluded projects and activities: 87857, 92138, 62577, 54808, 56146, 56164, 67041, 67062, 67063, 67064, 67040, 43016, 102605, 108566, 111791, 111790, 111789, 11788, 11787, 111785, and 108567.
We have updated our dataset with projects and activities from 2024 and 2025, and have thus deflated all values to constant 2025 U.S. dollars. To calculate these updated figures, we rely on official World Bank statistics for (1) official exchange rates and (2) inflation rates. For the commitment year 2025, official data from the World Bank on inflation rates were not yet released at the time of the publication of the CPORTS 2.0 dataset. Qualitative reports show that the inflation rate for 2025 is likely to be similar to what China experienced in 2024 (which was -0.7%), so the deflator calculation for 2025 carried forward the same inflation rate into 2025.[36]
10.4 CPORTS unique variables
CPORTS 2.0 offers 29 fields unique to this dataset to add additional units of analysis and information about ports financing transactions. These include the following variables:
Variable |
Definition |
port_name |
This field captures the name of the port facility Chinese financing has been committed to. For records and activities where financing supported a company and no direct port facility, this field is set to NA. |
terminal_name |
This field identifies the specific terminal supported by Chinese financing. It is left blank if one specific terminal cannot be identified or if financing was extended for the overall port or equipment at the port. |
port_facility |
This field will be marked as yes if financing is dedicated towards the maintenance, construction, extension or modernization of physical port infrastructure. |
port_equipment |
This field captures if financing is dedicated towards the provision, installation, or utilization of port equipment such as port cranes or scanners. |
port_stake_acquisition |
This field will be marked as yes if the financing was provided to purchase a stake, ownership, or concession of a seaport. |
chinese_entity_present |
This field is set to yes if (1) chinese_port_owner_present and/or chinese_port_operator present is marked as yes. |
chinese_port_owner_present |
This field identifies whether at port_name a Chinese or Hong Kong owner of a terminal or the overall port facility is present. An owner can be defined as “a Chinese entity having a definitive equity stake in the specified port, wharf, container terminal, or other physical entity itself,” (CFR 2024). For this field, which also tracks concessions at the ports, we have elected to omit the limitation against “concessions for port management and/or operations or leases” included in CFR’s methodology. In this dataset, we do not distinguish between a controlling stake and a minority stake, but we capture all known owners as a definitive stake. |
chinese_port_owner_name |
This field captures the name(s) of the owner(s) identified based on the chinese_port_owner_present field. |
|
chinese_port_operator_present |
This field identifies whether at port_name a Chinese or Hong Kong operator of a terminal or the overall port facility is present. An operator can be defined as a Chinese or Hong Kong company and/or entity which holds a concession over a terminal or port facility and manages day-to-day responsibilities at the port facility. |
chinese_port_operator_name |
This field captures the name(s) of the operator(s) identified based on the chinese_port_operator_present field. |
port_facility_type |
This field captures what kind of construction, expansion, and modernization activities that were supported by a given financing event at port_name. This field can include any combination of the following eight attributes: (1) pier or berth, (2) terminal, (3) port, (4) port basin and marine preparation, (5) industrial park, (6) mineral or energy infrastructure, (7) administrative, storage, or supportive facilities, and (8) shipyard. This field will be set to yes if the record or activity relates to the port’s financing or operation, and if port_facility field is set to yes. (1) Pier or Berth category identifies a structure extending from the shore into a body of water. (2) An entry with the Terminal category is a specific area of the port dedicated to a specific kind of cargo or activity. For example, a container terminal is dedicated to transporting containers from land to sea or sea to land. In some cases, ports will contain multiple terminals, which are operated by different entities. Select this category if financing is provided to enhance specific terminal facilities. (3) The Port category identifies if the financing is provided to construct, expand, and/or modernize the entire port area. (4) Port Basin and Marine Preparation refers to any dredging connected to the financing of the project, as well as other preparatory work of the marine port area. (5) Industrial Park is used when the project is integrated into a larger industrial park project, like with the Port of Duqm (Oman). An industrial park is defined as a specific area developed for manufacturing, storage, and other industrial uses. (6) Mineral or Energy Infrastructure includes storage, processing and refining, generation, and transport infrastructure specifically for minerals (like rare earth minerals, coal, or others) and energy commodities (like oil). For example, if a storage facility, which would typically be tracked in category (7), is built specifically for mineral or energy storage, it will be included in category (6). (7) Administrative, Storage, or Supportive Facilities include general infrastructure and facilities like offices and control stations, warehouses, and bunkering facilities. (8) Shipyard includes infrastructure intended to support the construction and repair of ships and other marine craft, such as drydocks. |
port_facility_purpose |
This field identifies for a given port_name, the general purpose(s) of the port and whether it was constructed to serve general cargo or the export of a specific commodity. This field identifies the purpose(s) as (1) General Cargo and Container, (2) Agriculture and Fishing, (3) Shipbuilding, (3) Energy and Minerals, (4) Ferry or Passenger, or (5) Military. This variable may identify multiple purposes of a port. This field will be coded when any of the following fields is set to yes: port_facility, port_equipment, and/or port_acquisition_stake. |
port_equipment_type |
This field captures whether the port equipment financed by a given transaction is (1) Customs and Security Equipment, such as a scanner, (2) Ship-to-Shore and Handling Equipment, such as a crane, or (3) General Equipment provision alongside financing. General equipment can include forklifts, conveyor belts, hopper feeders, container stackers, loaders, and other various equipment that is not specifically a crane or scanner or identified in the project description. This field is only populated if the port_equipment field is set to yes. |
port_equipment_provider |
This field identifies the provider of the equipment based upon the implementing_agency field or additional research when the port_equipment field is set to yes. |
chinese_naval_activity |
This field captures whether a given port facility previously hosted a Chinese military port call, a Chinese medical ship visit, a Chinese research vessel visit, or a joint exercise, this tag will be set to yes. A Navy port call includes military visits to foreign ports for maintenance, diplomatic exchanges, and humanitarian projects. Medical ships visit ports for humanitarian purposes and disaster relief. For port calls and medical visits, this field will be set to yes if the ship visits the port facility. When joint exercises are conducted at ports, ships do not always dock at the port itself; in this case, set this field to yes if the port is identified as a host of the exercise. Furthermore, this field is only set to yes if the activity was explicitly identified in an official government source and/or state media source. |
|
chinese_financed_mine_within_250km |
This field is set to yes if there are Chinese-financed mines captured in AidData's Chinese Financing for Transition Minerals Dataset (CFTM 2.0), Version 2.0 (Walsh et. al 2026), which identifies 86 unique mining sites globally. To populate this field, we identified coordinates within the feature of the mining site using (1) OpenStreetMap and (2) open-source geospatial tools like Google Earth and conducted a perimeter analysis of 250 kilometers (155.3 miles), combining both the CPORTS 2.0 and CFTM 2.0 datasets. |
|
chinese_financed_mine_250km_name |
This field identifies the name(s) of the Chinese-financed mines overseas captured in CFTM 2.0 within proximity of a given port_name, if chinese_financed_mine_within_250km is set to yes. |
|
chinese_financed_mine_250km_mineral_type |
This field identifies the mineral(s) of the Chinese-financed mines overseas captured in CFTM 2.0 within proximity of a given port_name, if chinese_financed_mine_within_250km is set to yes. |
|
chinese_financed_mine_within_500km |
This field is set to yes if there are Chinese-financed mines captured in AidData's Chinese Financing for Transition Minerals Dataset (CFTM 2.0), Version 2.0 (Walsh et. al 2026), which identifies 86 unique mining sites globally. To populate this field, we identified coordinates within the feature of the mining site using (1) OpenStreetMap and (2) open-source geospatial tools like Google Earth and conducted a perimeter analysis of 500 kilometers (310.7 miles), combining both the CPORTS 2.0 and CFTM 2.0 datasets. |
|
chinese_financed_mine_500km_name |
This field identifies the names of the Chinese-financed mines overseas captured in CFTM 2.0 within proximity of a given port_name, if chinese_financed_mine_within_500km is set to yes. |
|
chinese_financed_mine_500km_mineral_type |
This field identifies the mineral(s) of the Chinese-financed mines overseas captured in CFTM 2.0 within proximity of a given port_name, if chinese_financed_mine_within_500km is set to yes. |
port_latitude |
This field captures the latitude of the seaport identified in the port_name field. The coordinates were identified based on (1) AidData's Geospatial Global Chinese Development Finance Dataset, (2) continued capturing of features in OpenStreetMap, or (3) manual identification of the port using a combination of open-source geospatial tools. |
port_longitude |
This field captures the longitude of the seaport identified in the port_name field. The coordinates were identified based on (1) AidData's Geospatial Global Chinese Development Finance Dataset, (2) continued capturing of features in OpenStreetMap, or (3) manual identification of the port using a combination of open-source geospatial tools. |
|
seaport_recommended_for_aggregate |
This field captures the projects that we recommend using for analysis that requires the aggregation of projects/activities supported by financial or in-kind commitments from official sector institutions in China, including analysis of monetary amounts and project/activity counts. It is useful for identifying formally approved, active, and completed Chinese financing for projects/activities—and excluding all canceled projects/activities, suspended projects/activities, and projects/activities that never reached the formal approval (official commitment) stage. This variable is based upon AidData's "Tracking Loans and Grants from China to Low-, Middle-, and High-Income Countries: An Application of AidData’s TUFF 4.0 Methodology" (Parks et al. 2025b), with a select number of records and activities manually set to not recommended for aggregates due to (1) unknown amount of contribution to the seaport, or (2) the record and activity falling outside of the scope of our dataset or definition of seaports. |
|
seaport_amount_original_currency |
This field captures the monetary amount that the funding agency committed (or pledged) in its original currency of denomination. This variable is based upon AidData's "Tracking Loans and Grants from China to Low-, Middle-, and High-Income Countries: An Application of AidData’s TUFF 4.0 Methodology" (Parks et al. 2025b), with a select number of records and activities manually adjusted to reflect our equal distribution principle for port equipment records. For more information, please see our methodology appendix in our report Anchoring Global Ambitions. |
seaport_original_currency |
This field captures that currency of denomination associated with the monetary amount that the funding agency committed (or pledged), as recorded in the seaport_amount_original_currency field. This variable is based upon AidData's "Tracking Loans and Grants from China to Low-, Middle-, and High-Income Countries: An Application of AidData’s TUFF 4.0 Methodology" (Parks et al. 2025b), with a select number of records and activities manually adjusted to reflect our equal distribution principle for port equipment records. For more information, please see our methodology appendix in our report Anchoring Global Ambitions. |
seaport_amount_estimated |
This marker designates whether AidData estimated the monetary amount that the funding agency committed (or pledged), as captured in the seaport_amount_original_currency field. The field is set to "Yes" when the seaport_amount_original_currency field is estimated by AidData.This variable is based upon AidData's "Tracking Loans and Grants from China to Low-, Middle-, and High-Income Countries: An Application of AidData’s TUFF 4.0 Methodology" (Parks et al. 2025b), with a select number of records and activities manually adjusted to reflect our equal distribution principle for port equipment records. For more information, please see our methodology appendix in our report Anchoring Global Ambitions. |
|
seaport_amount_constant_usd_2025 |
This field captures the monetary value of the official commitment (or pledge) issued by the funding agency in constant 2025 U.S. dollars. This variable is based upon AidData's "Tracking Loans and Grants from China to Low-, Middle-, and High-Income Countries: An Application of AidData’s TUFF 4.0 Methodology" (Parks et al. 2025b), with a select number of records and activities manually adjusted to reflect our equal distribution principle for port equipment records. For more information, please see our methodology appendix in our report Anchoring Global Ambitions. |
seaport_amount_nominal_usd |
This field captures the monetary value of the official commitment (or pledge) issued by the funding agency in nominal U.S. dollars. It is one of the inputs used to calculate financial commitment (and pledge) amounts in constant 2025 U.S. dollars, as recorded in the seaport_amount_constant_usd_2025 field. This variable is based upon AidData's "Tracking Loans and Grants from China to Low-, Middle-, and High-Income Countries: An Application of AidData’s TUFF 4.0 Methodology" (Parks et al. 2025b), with a select number of records and activities manually adjusted to reflect our equal distribution principle for port equipment records. For more information, please see our methodology appendix in our report Anchoring Global Ambitions. |
The following fields (“seaport_recommended_for_aggregate”, “seaport_amount_original_currency”, “seaport_amount_estimated”, “seaport_amount_constant_usd_2025”, and “seaport_amount_nominal_usd”) are all originally derived from AidData’s China’s Loans and Grants Dataset, Version 1.0 (CLG-Global 1.0) and have been adjusted for the purposes of the CPORTS 2.0 dataset, according to the definitions and methodology noted above. We derive these original definitions from AidData’s methodology underlying the CLG-Global 1.0 dataset, Tracking Loans and Grants from China to Low-, Middle-, and High-Income Countries: An Application of AidData’s TUFF 4.0 Methodology (Parks et. al 2025b).
All other fields present in the CPORTS 2.0 dataset are derived from AidData’s CLG-Global 1.0 dataset with no further adjustments, and these field definitions can also be found in the underlying methodology document (Parks et al. 2025b). All fields from AidData’s CLG-Global 1.0 dataset can be merged into the CPORTS 2.0 dataset using the “aiddata_record_ID” field.
[2] See www.aiddata.org/data/chinas-global-loans-and-grants-dataset-1-0.
[3] The CPORTS 2.0 dataset (2000-2025) tracks 363 ports projects supported by grant and loan commitments worth $23.9 billion, while the 1.0 version (2000-2021) tracked 123 projects supported by grant and loan commitments worth $29.9 billion. The aggregate value of the financial commitments captured by the CPORTS 2.0 dataset decreased, despite the number of records more than doubling, due to a methodological change: the latest version of the CPORTS dataset focuses on financial commitments that can be confirmed only for port construction and expansion and port equipment. To avoid overestimation, all financial commitments from the 2.0 dataset that cannot be confidently attributed to a port project are excluded. The Yamal LNG Project in Russia, which includes port infrastructure at Sabetta and liquid natural gas (LNG) production assets, received some $14.9 billion in financial commitments from Chinese state-owned creditors, but the specific amount that was earmarked for the Sabetta seaport component of the project cannot be determined. If the excluded Port of Sabetta and the Port of Morébaya in Guinea (i.e., commitments that supported port infrastructure and mine infrastructure) and other excluded commitments in our analysis are included in our data analysis, then Chinese official sector financing for port projects reaches almost $43.7 billion worth of loan and grant-financed commitments between 2000 and 2025.
[4] Apart from the CLG-Global 1.0 Dataset, AidData maintains a searchable online repository of unredacted contracts between 20 Chinese creditors and 155 borrowers from 60 countries, available at https://china-contracts.aiddata.org/. A significant number of these contracts support overseas seaport projects.
[5] These methods are discussed at greater length in Chapter 10.
[6] In November 2017, China Eximbank and ICBC issued a $659 million syndicated loan for the Queen Elizabeth II Quay Project, and construction commenced December 2017. However, in 2018, implementation was reportedly halted after reports that the legal entity responsible for the project—National Port Development (SL) Ltd.—was owned by an Israeli businessman who contributed to the President of Sierra Leone’s reelection campaign. The IMF also sounded the alarm after learning Sierra Leone’s Ministry of Finance issued a sovereign guarantee for the syndicated loan, placing a large contingent liability (worth 15% of the country’s GDP) on the government’s books. As of February 2026, AidData has not identified evidence of construction resuming or that the syndicated loan agreement was ever suspended or cancelled.
[7] The Doraleh Multipurpose Port and the Damerjog Livestock Port are separate facilities located approximately 21 KM from each other. In 2016, China Eximbank provided a $407 million loan to the Government of Djibouti to construct both facilities. AidData has been unable to determine what portion was used for the Doraleh port versus the Damerjog port. The two are therefore combined together, and this tally also includes a $59 million loan from ICBC Doraleh port.
[8] Total financial commitments for certain port projects differ in Table 2 from other tables in this report, as some transactions were not coded as having both a Chinese port operator and owner present at the port (i.e., in instances where Chinese operators and owners acquired their position at the port after a given transaction). Therefore, financial commitments shown in Table 2 may be lower than the total commitments recorded in Tables 1 and 4 for the same ports. For more information, see the methodology note in Chapter 10 and the definitions tab in the CPORTS 2.0 dataset.
[9] On this issue, also see Bonfatti and Poelhekke (2017) and Bluhm et al. (2025)
[11] These 29 ports exclude the Port of Sabetta in Russia, which is not recommended for aggregation due to the impossibility of allocating finance going towards the Yamal LNG Project versus to the port itself. Financing for this project is thus excluded from the $10.8 billion figure for HICs and the global figure of $23.9 billion, but is included in qualitative analysis in this report
[12] Whereas 49.4% of China’s financing for seaports in HICs solely finance M&A and liquidity support measures, only 27.1% of its global seaport financing portfolio supports such activities.
[13] Port Botany and Port Kembla are two separate ports located about 61 kilometers (38 miles) from each other in the state of New South Wales, Australia. In 2013, the government of New South Wales privatized both two ports on 99-year leases to a consortium of investors, backed by a lending syndicate including ICBC. The $183 million contribution of the Chinese state-owned bank cannot be broken down on a per-port basis. Therefore AidData combined the two ports together for dataset construction purposes and treats them as a single port in this report.
[14] In total, 63.3% of China's financing for seaports in HICs benefits ports with Chinese or Hong Kong owners or operators.
[15] In the case of the loans backing Macquarie’s acquisition of Long Beach Container Terminal, the financing—a $625 million USD syndicated loan featuring ICBC—was supporting the removal of Chinese influence; specifically, the Committee on Foreign Investment in the United States ordered Hong Kong-based container shipment company Orient Overseas International (OOIL), which held the 80% stake in the terminal, to divest from the asset in order to receive approval for the acquisition of OOIL by Chinese state-owned firms China COSCO Shipping Corporation Limited and Shanghai International Port Group (Trade Practitioner 2019).
[16] In comparison, loans for ports in Australia—and other HICs—often have a large number of syndicated lenders. The A$850 million syndicated loan for the Port of Brisbane in 2022 featured 15 lenders, while a 2024 $330 million NZD syndicated loan for New Zealand’s Port of Tauranga only had four lenders.
[17] In the CPORTS 2.0 dataset, the units of observation are instances of state-controlled Chinese entities providing loans and grants for ports, and as such the activities of Chinese SOEs or even privately-held Chinese or Hong Kong companies like Hutchison Ports are only captured when they meet these criteria.
[18] In November 2023, the U.S. Development Finance Corporation (DFC) issued a $125 million loan to ONEX Elefsis Shipyards and Industries S.A. to support the acquisition and rehabilitation of the shipyard in Elefsina, which is located 12 miles away from the Port of Piraeus (DFC 2023, 2024). Then, in October 2025, the DFC claimed that its investment in the Elefsina shipyard “countered efforts by the Government of China to expand its influence in the region” (DFC 2025).
[19] The CPORTS 2.0 dataset splits activities that took place at more than one port location, thus resulting in multiple projects with the same “aiddata_record_id” variable. When examining port equipment by unique AidData record ID, we capture 82 unique IDs that involve port equipment donations, loans, and activities. For more information on our port equipment methodology, please see our methodology note in Chapter 9.
[20] We have included the Sukulu project in our calculation of 19 mines within 500 kilometers, although the Kisumu Port is not recommended for aggregate, as it is a pledged project. For more information on the Sukulu Phosphate Comprehensive Industrial Development Project, see https://china.aiddata.org/projects/60236.
[21] Just a few months prior, a Chinese delegation paid Ilheus and the site of Porto Sul a visit, together with Brazil’s Secretary of Rail Transport, Leonardo Ribeiro (Brasil Ministério dos Transportes 2025).
[22] For evidence that China has continued to pursue the possibility of establishing other overseas military bases since June 2023 (when AidData first published the Harboring Global Ambitions report), see Singleton (2023), Diario Rombe (2024), and Phillips (2024).
[23] In July 2017, NORINCO and the Government of Equatorial Guinea signed a $344,879,897 supplier's credit (loan) agreement (ID#NOR/GEMOF/2017/01) for the CEIBA Project. The loan carried the following borrowing terms: a 4.5% interest rate, a 6-year maturity, a 1-year grace period, and a 4.25% (Sinosure) insurance premium (worth $14,280,884). The borrower was expected to use the proceeds of the loan to finance 85% of the cost of a revised commercial contract with NORINCO worth $402,033,663. The borrower was also expected to make an advance payment worth 15% of the commercial contract cost ($66,012,868). The purpose of the CEIBA project was to facilitate the acquisition of ammunition, an anti-tank missile system (model HJ8L), and other equipment for the military (including its rapid intervention force). It also involved the provision of operational training on use of the equipment.
[24] This report classifies “naval activity” as engagement facilitated by the Chinese Ministry of Defense and the Central Military Commission, as well as its affiliated branches and theatres of command and arms, such as the People’s Liberation Army and the People’s Liberation Army Navy. Chinese paramilitary branches or UN Peacekeeping Forces are not included here as part of naval activity.
[25] China Iconic Technology Company Limited (CHINAICTC or 中徽建技术有限公司) is a subsidiary of China Communications Services Corporation Limited, which is a subsidiary of China Telecommunications Corporation (a Chinese state-owned enterprise).
[26] The CPORTS 2.0 dataset tracks 28 unique ports that have received Chinese official sector financing and have a Chinese owner present at the larger port facility, thus significantly reducing the sample size for tracking this Chinese naval activity, compared to looking at port facilities overall irregardless of ownership (99 unique port facilities where the variable “port_facility” is set to yes).
[27] Port Autonome de Cotonou (PAC) and the AGTF subsequently signed an EUR 25 million loan agreement for the project in February 2025.
[28] The Port of Rio de Janeiro has not received official Chinese financing, but other ports in Brazil have, including Porto Paranagua, Porto São Luís, Porto Sul, and Port of Rio Grande.
[29] Beibu Gulf Holding (HK) Co. Ltd is a state-owned corporation from China and a subsidiary under the Guangxi Beibu Gulf International Port Group. Darussalam Assets Sdn Bhd is owned by the Government of Brunei Darussalam.
[30] China Eximbank has also recently signalled its interest in financing new work at Honduras’ Henecán Port and San Lorenzo Port (Madrid 2024). If approved, the loan proceeds would be used to finance one or more commercial contracts between Honduras' National Port Authority (ENP) and China Harbour Engineering Company. See https://web.archive.org/web/20240602070630/https://www.expedientepublico.org/wp-content/uploads/2024/03/RESPUESTA-CONJUNTA-SOL-ENP-173-175-2023.pdf.
[32] For more details, see https://china.aiddata.org/projects/49542.
[33] For more on this topic, see Gardner et al. (2020) and Parks et al. (2022)
[34] In conjunction with the Credit Evaluation Tool, AidData recently launched a searchable online repository of 371 unredacted contracts between 20 Chinese creditors and 155 borrowers from 60 countries (at https://china-contracts.aiddata.org/). The repository includes loan contracts for overseas seaport projects. Debt management officials in borrower countries have informed AidData that they believe they can more effectively negotiate with Chinese creditors when they are able to directly access the terms and conditions that their peers have successfully negotiated with the same creditors.
[35] The 1.0 version of the CPORTS dataset (previously named the “China's Official Seaport Finance Dataset, 2000-2021”) captured grant and loan commitments between 2000 and 2021 worth $29.9 billion (in constant 2021 U.S. dollars) for projects and activities that partially or exclusively supported ports (Wooley et al. 2021). If one exclusively tallies the grant and loan commitments for ports in the CPORTS 1.0 dataset (as we do in the CPORTS 2.0 dataset), this figure falls to $15 billion (in constant 2021 U.S. dollars).
[36] Representing values in constant USD terms is a standard practice in financial analysis when flows are being measured over time, as it ensures comparability across years. The CPORTS 2.0 dataset was initially derived from AidData’s China’s Global Loans and Grants Dataset, Version 1.0 (Parks et. al 2025a), with additional commitments for the commitment years 2024 and 2025 identified in the dataset. As a result, we have deflated the CPORTS 2.0 dataset from the “amount_constant_2023_USD” variable used in AidData’s CLG-1.0 to “seaport_amount_constant_2025_USD.” This deflation of commitment values from 2023 to 2025 resulted in lower amounts, as 2025 values had greater purchasing power, causing commitment values expressed in 2025 constant prices to fall. For more information on AidData’s use and calculation of deflators, see page 29 in Tracking Loans and Grants from China to Low-, Middle-, and High-Income Countries: An Application of AidData’s TUFF 4.0 Methodology (Parks et. al 2025b).